Bank of England Inflation Report For March – CPI 0%, Please Explain!

In order to maintain price stability, the Government has set the Bank’s Monetary Policy Committee (MPC) a target for the annual inflation rate of the Consumer Prices Index of 2%. Subject to that, the MPC is also required to support the Government’s economic policy, including its objectives for growth and employment. The Inflation Report is produced quarterly by Bank staff under the guidance of the members of the Monetary Policy Committee. It serves two purposes. First, its preparation provides a comprehensive and forward-looking framework for discussion among MPC members as an aid to decision-making. Second, its publication allows the MPC to share our thinking and explain the reasons for their decisions to those whom they affect.

GDP growth was robust in 2014, moderating in the second half of the year. Despite the weakness in 2015 Q1, the outlook for growth remains solid. Household real incomes have been boosted by the fall in food, energy and imported goods prices. The absorption of remaining slack and a pickup in productivity growth are expected to support wage growth in the period ahead. Along with the low cost of finance, that will help maintain domestic demand growth. Activity in the United States and a number of emerging markets has slowed but momentum in the euro area appears to have strengthened over the quarter as a whole.

CPI inflation was 0.0% in March 2015 as falls in food, energy and other import prices continued to weigh on the annual rate. Inflation is likely to rise notably around the turn of the year as those factors begin to drop out. Inflation is then projected to rise further as wage and unit labour cost growth picks up and the effect of sterling’s appreciation dissipates. The MPC judges that it is currently appropriate to set policy so that it is likely inflation will return to the 2% target within two years. Conditional on Bank Rate following the path currently implied by market yields — such that it rises gradually over the forecast period — that is judged likely to be achieved.

CPI inflation was 0.0% in March, triggering a second successive open letter from the Governor to the Chancellor of the Exchequer. Around three quarters of the weakness in inflation relative to target, or 1.5 percentage points, was due to unusually low contributions from food, energy and other goods prices, which are judged largely to reflect non-domestic factors. The biggest single driver has been the large fall in energy prices. Falls in global agricultural prices and the appreciation of sterling have also led to lower retail prices for food and other goods. Absent further developments, these factors will continue to drag on the annual inflation rate before starting to drop out around the end of 2015.

The remaining one quarter of the weakness in inflation relative to target, or 0.5 percentage points, is judged to reflect domestic factors. Wage growth remained subdued in Q1, despite a further fall in the unemployment rate. Part of that weakness is likely to reflect the effects of slack in the labour market, although the concentration of recent employment growth in lower-skilled jobs, which tend to be less well paid, is also likely to account for part of it.

Chart 2 shows the Committee’s best collective judgement for the outlook for CPI inflation. In the very near term, inflation is projected to remain close to zero, as the past falls in food, energy and other goods prices continue to drag on the annual rate. Towards the end of 2015, inflation rises notably, as those effects begin to drop out. As the drag from domestic slack continues to fade, inflation is projected to return to target within two years and to move slightly above the target in the third year of the forecast period.

The path for inflation depends crucially on the outlook for domestic cost pressures. A tightening of the labour market and an increase in productivity should underpin wage growth in the period ahead. There is a risk that the temporary period of low inflation may persist for longer — for example, if it affects wage settlements. Alternatively, wages could pick up faster as labour market competition intensifies, which could pose an upside risk to inflation. Inflation will also remain sensitive to further movements in energy and other commodity prices, and the exchange rate.

BOECPIMAy2015Another influence on wage and price-setting decisions is inflation expectations. Nearly all measures of inflation expectations have fallen over the past year, with household measures now below pre-crisis average levels. Surveys suggest that employees and firms expect little recovery in pay growth this year. Other measures of inflation expectations are, however, close to historical averages. The MPC judges that inflation expectations remain broadly consistent with the 2% inflation target.

The MPC also noted, however, that, as set out in the February 2014 Report, the interest rate required to keep the economy operating at normal levels of capacity and inflation at the target was likely to continue to rise as the effects of the financial crisis faded further. Despite this, beyond the three-year forecast horizon the yield curve had flattened further over the past year. There was uncertainty about the reasons for this. Given that uncertainty, there was a risk that longer-term yields would move back up over time, for example, in response to a tightening of US monetary policy.

 

Wall Street’s Thinking About Creating Derivatives on Peer-to-Peer Loans

Interesting article from Bloomberg Business on the continuing morphing of P2P lending into the main stream, and potentially wrapped up into derivatives.

It began with a seemingly wacky idea to reinvent banking as we know it. But no one is scoffing at peer-to-peer lending anymore — least of all, Wall Street. Barely a decade old, “P2P” has gone mainstream and is now being co-opted by some of the big financial players it was supposed to bypass. Investment funds can’t get enough of this business, which involves lending to people over the Internet and hoping they pay you back. Investors are snapping up the loans directly, while the banks are bundling them into securities, much as they did with subprime mortgages.

Now peer-to-peer lending and its Internet enablers like LendingClub Corp., the industry leader, are being pulled into the high-octane world of derivatives. While many hail Wall Street’s growing involvement, others warn investors could get carried away, as they did during the dot-com era and again during the mortgage mania. The new derivatives could help people hedge their risks, but they could also lure speculators into the market.

“It feels like the year 2000 again,” said Frank Rotman, a partner at QED Investors, an Alexandria, Virginia-based venture-capital firm that has invested in Prosper Marketplace Inc., Social Finance Inc. and 13 other P2P lending platforms. “Everyone is chasing ’it,’ but they don’t know what ’it’ is, and that is kind of scary.”

Lured by Yield

It’s easy to see why investors are so enthusiastic. In today’s low-interest-rate world, high-quality P2P loans yield about 7.6 percent. Two-year U.S. Treasuries, by comparison, were yielding a mere 0.6 percent on Friday.

But P2P’s rapid growth also raises questions about the potential risks, including whether the firms involved might lower their standards to stay competitive. During the mortgage boom, Wall Street’s securitization machine fueled questionable lending practices. Derivatives tied to the debt were blamed for spreading their risks around the globe, and then amplifying investors’ losses when the housing market crashed.

Now a firm led by Michael Edman, a veteran of Morgan Stanley, is creating derivatives that will give investors a new way to bet for — or against — peer-to-peer loan performance. Edman has ridden credit booms before: he was a figure in “The Big Short,” Michael Lewis’s best-seller about the buildup to the housing bubble of the 2000s.

“It’s a high-coupon asset that’s had very good returns for the short period of time it’s been around,” Edman said of P2P loans. “I don’t have reason to believe that’s going to change dramatically anytime soon, but there are bad loans out there.”

Satisfying Demand

Derivatives could help satisfy investors’ demand for P2P assets, while also helping others hedge risks on loans they’ve already bought. The instruments could also bring more investors swooping into the market simply to place speculative wagers.

Brendan Dickinson, principal at Canaan Partners, a $4.2 billion asset firm based in New York and Menlo Park, California, is counting on the former.

“If you could create a synthetic product that mimics all the features of a P2P loan and had the same risk and yield tradeoff, there would be a lot of demand to buy that paper,” said Dickinson, whose firm has invested in LendingClub and Orchard Platform and is looking to invest $5 million to $10 million in a firm trying to create derivatives on P2P loans. Other small firms are racing to create P2P derivatives before big banks try to muscle in.

Derivatives Pioneer

Edman, who runs New York-based Synthetic Lending Marketplace, or SLMX, has some high-profile experience. In the early 2000s, he helped invent a kind of credit-default swap that enabled some Wall Street firms to bet against U.S. subprime mortgage bonds.

But Edman sees little resemblance between the boom-era mortgage market of and the current peer-to-peer market. He said his derivatives will help investors hedge their bets and also improve the pricing of the underlying loans.

Indeed, Edman said the ability to short the loans could curb some of the enthusiasm for this asset class before any of the debt sours.

“If derivatives in mortgage-backed securities existed in 1998, we wouldn’t have gotten to the point that we did in terms of the bubble in mortgages,” Edman said. “This keeps a market honest.”

Investors are already showing some skepticism. Less than a year after going public, LendingClub is the sixth-most bet against stock on the New York Stock Exchange.

‘Legitimate Need’

LendingClub chief executive officer Renaud Laplanche said he’s aware of the interest to bet against the market. Derivatives that give investors the ability to protect against losses on the loans the company arranges is just smart risk-management, he said.

Spokeswomen for Prosper and Social Finance declined to comment.

SLMX is still working on documentation for the derivatives, which are likely to take the form of credit-linked notes with total-return swaps, rather than the credit-default swaps some blame for worsening the financial crisis. The firm has teamed up with a broker-dealer, AK Capital LLC, to execute trades and hopes to make its first transaction as early as this year.

Rotman said another firm, PeerIQ, has discussed with him the possibility of creating contracts that would essentially zero in on loans arranged by LendingClub, the industry leader, which has facilitated $7.6 billion of loans since 2006. PeerIQ – – whose financial backers include John Mack, the former CEO of Morgan Stanley and Vikram Pandit, the former CEO of Citigroup Inc. — hasn’t publicly disclosed any plans; a spokesman for the firm declined to comment. Those men recently led a $6 million investment round for the company’s analytics business.

LendingClub’s chief executive officer Laplanche called PeerIQ a third-party partner, no different than other companies seeking to utilize the company’s public data.

“It is a perfectly legitimate need from many of our investors, especially large ones,” Laplanche said.

AU$ Movements Before RBA Rate Releases Were “Normal” – ASIC

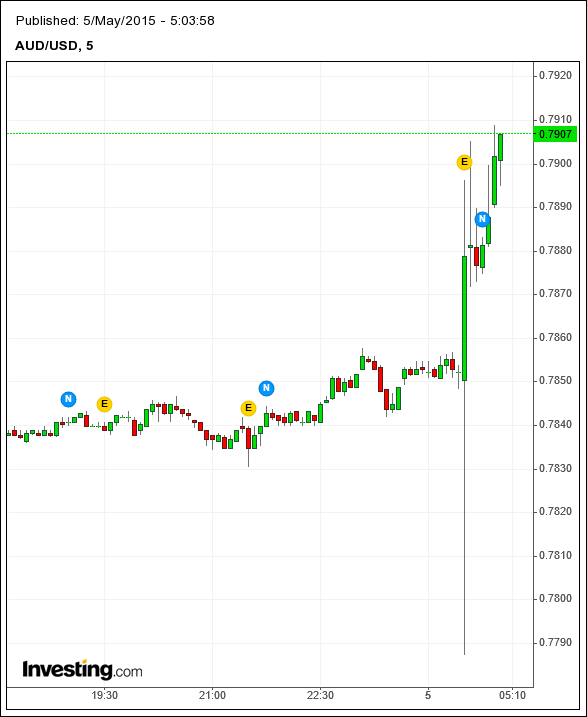
ASIC today released an update on their investigations into AU$ trading movements around the time of recent RBA target rate announcements. Whilst their investigations are ongoing, ASIC says the movements are related to liquidity positions and computer based trading, and do not indicate cases of market misconduct.

ASIC today provided an update on its investigation into the movements in the Australian dollar shortly before the Reserve Bank’s monetary policy decisions for February, March and April 2015.

The enquiry is investigating trading in the dollar in the minute prior to the RBA’s interest rate decision statement at 2.30pm.

ASIC has made extensive enquiries into the management of the information flow regarding the RBA’s interest rate decision prior to the announcement of this decision.

ASIC’s current focus is on reviewing the trading behaviour of a number of foreign exchange markets and platforms including interest rate futures markets and CFD platforms providing foreign exchange markets. Notices to produce trading information have been sent to many financial institutions and platform providers to understand the basis of the trading on these markets at the point in time of interest.

ASIC’s enquiries are ongoing as to the cause of the swings in the currency markets. Preliminary findings reveal moves in the Australian Dollar ahead of the announcement to be as a result of normal market operations in an environment of lower liquidity immediately ahead of the RBA announcement. The reduction in liquidity providers is a usual occurrence prior to announcement in all markets. Much of the trading reviewed to date was linked to position unwinds by automated trading accounts linked to risk management logic and not misconduct.

In particular, ASIC has observed liquidity being withdrawn from the market at the same moment as participants already positioned were considering their risk exposure too large ahead of the announcement and reducing their position. This lack of liquidity distorted the execution logic in the algorithms of some participant systems. This, along with a fall in trading volumes leading up to the release of key market data, means trades may have had a more pronounced impact on the price than they otherwise would.

Length of Zero Interest Rate Policy Reflects Diminished Fundamentals – Moody’s

According to Moody’s, recently markets discovered that there was only a limited speculative demand for 10-year European government bonds yielding less than 1%. Unless forced to do so by an investment mandate, it’s highly unlikely that many long-term investors had been loading up on European government debt yielding less than 1%. Despite their latest climb, European government bond yields remained low compared to what otherwise might be inferred from fundamental drivers excluding European Central Bank (ECB) demand. ECB purchases have been substantial and are scheduled to be so. For example, the ECB still intends to purchase another one trillion euro of European bonds by the autumn of 2016.

Over the past week, the 10-year German government bond yield rose by 22 bp to 0.38%. In near lock step fashion, the 10-year US Treasury yield increased by 19 bp to 2.10%. The unexpected rise by Treasury bond yields helped to trigger an accompanying 0.9% drop by the market value of US common stock.

We still hold that the forthcoming upswing by US bond yields will more closely resemble a mild rise, as opposed to a jarring lift-off. Though financial markets are likely to overreact to the first convincing hint of a higher fed funds rate, the record shows that the market value of US common stock does not peak until several years after the initial rate hike. Yes, payrolls are growing, but the quality of new jobs may be lacking, according to the subpar growth of employee compensation and below-trend income expectations. Thus, the reaction of household expenditures, including home sales, to the expansion of payrolls and still extraordinarily low mortgage yields falls considerably short of what occurred during previous business cycle upturns. In turn, the upside for Treasury bond yields is limited. The 10-year US Treasury yield is likely to spend 2015’s final quarter in a range that is no greater than 2.25% to 2.50%.

When the federal funds rate target was first lowered to its current range of 0.00% to 0.25% in December 2008, nobody dared to predict that this record low target would hold well into 2015. Few, if any, appreciated the extent to which the drivers of expenditures growth had been weakened not only by a diminution of business and household credit quality, but also by heightened global competition and an aging population. Three overlapping and unprecedented episodes of quantitative easing have made the length of the nearly 6.5year stay by the Fed’s zero interest rate policy all the more remarkable. Neither the Fed’s $3.8 trillion net purchase of bonds since mid-2008 nor roughly $800 billion of fiscal stimulus was able to spur expenditures by enough to allow for the removal of an ultra-low fed funds rate target.
In stark contrast, fed funds’ previous bottom of 1% in 2003-2004 lasted for only 12 months. And when fed funds troughed at the 3% during late 1992 into early 1994, its duration was slightly longer at 17 months. The US economy’s decidedly positive response to each earlier bottoming of fed funds helps to explain their much shorter durations.

Long-term growth slows markedly

Amazingly, despite humongous monetary stimulus, as well as considerable fiscal stimulus, the moving yearlong sum of real GDP has grown by only 2.2% annualized since the Great Recession ended in June 2009. For comparably measured serial comparisons, 23 quarters following the expiry of the three downturns prior to the Great Recession, the average annualized rates of real GDP growth were 2.9% as of Q3-2007, 3.4% as of Q4-1996, and 4.8% as of Q3-1988. The downshifting of the average annual rate of growth by the 23rd quarter of an upturn lends credibility to the secular deceleration argument. If there is any good news it may be that the prolonged deceleration of US economic growth may be bottoming out. That being said, Q1-2015’s lower than expected estimate of real GDP increases the likelihood that 2015 will be the 10th straight year for which the annual rate of US economic growth failed to reach 3%. Such a stretch lacks recent precedent.

US real GDP will probably average a 1.5% annualized increase during the 10-years-ended 2015. Previous 10year average annualized rates of real GDP growth averaged 3.4% as of 2005, 3.0% as of 1995, and 3.5% as of 1985. Beginning and concluding with the spans-ended 1957 through 2007, the 10-year average annualized rate of real GDP growth averaged 3.4%. Most baby boomers will not live long enough to observe another average annual growth rate of at least 3% over a 10-year span.

Corporate credit heeds the diminished efficacy of stimulus

The corporate credit market is well aware of how so much monetary and fiscal stimulus supplied so little lift to business activity. In turn, credit spreads are wider than otherwise given a benign default outlook, partly because of a loss of confidence in the ability of policy actions to quickly spur expenditures out of a macroeconomic slump. In the event an adverse shock rattles the US economy, just how effective would additional monetary stimulus be at reviving growth?

Moreover, a still elevated ratio of US government debt to GDP might delay the implementation of fiscal policy by a Congress that remains skeptical of the effectiveness of increased government spending and a Presidency that is adverse to tax cuts. Also, even if Washington were to agree on fiscal stimulus, foreign investors, who now hold 47% of outstanding US Treasury debt, may be unwilling to take on more obligations of the US government unless compensated in the form of higher US Treasury bond yields. In all likelihood, an accompanying rise by private-sector borrowing costs would reduce the lift supplied by fiscal stimulus.

RBNZ Bulletin Covers Capital Markets

The New Zealand Reserve Bank today published an article in the Reserve Bank Bulletin that describes New Zealand’s capital markets, and the role they play in the functioning of financial markets and the real economy. The article is quite comprehensive, and worth reading becasue it describes the financial instruments and market participants involved, and analyses a unique dataset to provide some detail on the size of both the bond and equity markets, which together comprise local capital markets. We summarise some of the discussion.

Capital markets are the part of the financial system that involve buying and selling long-term securities – both debt (bonds) and equity instruments. Capital markets are used to fund investment or to facilitate takeovers, and to provide risk mitigation (for example via derivatives) and diversification. There is no strict definition of ‘long-term’; Potter (1995) defines capital market instruments as having a maturity of greater than one year, and we retain this classification here, noting that capital market instruments may also have no maturity date (as in the case of perpetual bonds or equity). This article further classifies the domestic capital market as all resident entities issuing into the local economy in New Zealand dollars (NZD) . The article also touches on resident entities issuing bonds offshore, and non-resident entities issuing into New Zealand in NZD.New Zealand’s capital markets are an integral part of the domestic financial system. The previous Reserve Bank Bulletin articles describing New Zealand’s capital markets were published 20 years ago. The landscape has changed dramatically since then – local capital markets have grown substantially, although remain small compared with those in many other advanced economies.

The Reserve Bank has a wide-ranging interest in New Zealand’s capital markets. The Financial Stability Report (FSR), for example, reports on the soundness and efficiency of the financial system, including capital markets. Capital markets that function effectively are important for the way monetary policy affects the wider economy. The Reserve Bank’s prudential regulation of financial institutions can also influence the type and nature of capital market instruments that develop in the local market.

Section two of the article describes capital markets in general, and defines New Zealand’s capital markets in a global context. The instruments and players involved are explained. Section three discusses why capital markets are important for any economy, while section four highlights the Reserve Bank’s interest in capital markets. Section five describes New Zealand’s capital markets and uses a unique dataset to provide detail on the size of the non-government bond market in particular. Section six notes developments since the 2009 Capital Markets Taskforce review.

One interesting piece of data relates to bond issuance. The total amount of bonds outstanding in the local market (excluding Kauris) has more than doubled since 2007 in nominal terms, rising from just over $50 billion (30 percent of GDP) at the start of 2007 to $121 billion. More than two-thirds of this rise is due to an increase in central government debt, while nearly 20 percent of the increase represents bond issuance by banks. The increase in government bond issuance is linked to the shift from fiscal surpluses to deficits during the Global Financial Crisis (GFC), and further issuance following the Christchurch earthquakes.

New Zealand banks increased their issuance of long-term debt sharply in the immediate post-GFC period. This followed from a number of changes in the global environment, including the risk of a negative credit rating from international rating agencies stemming from a reliance on short-term funding, a lack of global liquidity, and a cessation of some wholesale funding markets during the depth of the GFC (increasing the risk of a failure to roll over upcoming funding needs). In addition, New Zealand registered banks are now required by the Reserve Bank to raise a greater proportion of funding that is likely to remain in place for at least one year, as part of the prudential liquidity policy introduced in 2009. The Reserve Bank’s prudential liquidity policy was implemented to reduce the risk posed to New Zealand’s banking system by an overreliance on short-term wholesale market funding.

RBNZ-1-May-2015 As at October 2014, the New Zealand (central) government sector had issued 61 percent of New Zealand’s bonds outstanding (figure 6). By comparison, the share of the local government sector was 8.5 percent, with 18.5 percent issued by banks or other financial institutions and 9 percent by non-financial corporates. SOEs comprise the remaining 3 percent. This breakdown has changed markedly since 2007; as previously noted, central government debt makes up a much larger share today, while the proportion of non-financial corporate bonds has fallen from 19 percent to its current level of 9 percent of the total. Although the nominal amount of bonds outstanding has increased for all sectors, nonfinancial corporate bonds have decreased as a share of GDP, falling from 5.7 percent to 4.5 percent currently (possibly reflecting weaker overall demand for business credit in the past five years). Note that figure 6 does not include bonds issued by New Zealand entities in offshore markets; if included, the share of government bonds would decrease.

RBNZ-2-May-2015Looking ahead, New Zealand’s equity and bond markets have grown in size and depth in recent years. Despite this, the size of New Zealand’s capital markets remains small and underdeveloped by international standards, while the banking system continues to dominate funding for New Zealand firms. On the one hand, the relatively small size of New Zealand’s capital markets might simply reflect the small size of the economy: some economies simply lack scale to support a flourishing capital market.

Laeven (2014) argues that, “in an increasingly globalised world, not every country needs to develop a fully-fledged physical capital market at home. The optimal balance between local capital market development and integration in global capital markets will depend on country circumstances, such as economic size and stage of  development” (p.19). As noted in this article, larger New Zealand corporates already have access to global markets – both public debt markets and private placements.

On the other hand, many believe that further development of both equity and bond markets in New Zealand would help to underpin economic growth (CMD Taskforce, 2009). Indeed, capital market activity over the past few years has been heavily influenced by a wide range of continuing regulatory and policy initiatives to support New Zealand’s equity and bond markets. Looking ahead, the growth of KiwiSaver scheme funds and the recent partial privatisation of SOEs could add further depth and liquidity to the domestic equity market, and in turn increase international interest and participation. In addition, the development of an alternative public growth market, introduced last year by the NZX, could help to encourage more SMEs to raise funds via public listing (by offering lower compliance costs). Other policy and regulatory initiatives including formalising crowd funding via crowd funding licences issued by the FMA, could further serve to reduce capital-raising costs for small firms. That said, most of the regulatory initiatives are very recent, and at this point, it is difficult to assess how much difference these changes will make over the longer term

A New Tax System for Managed Investment Trusts

The Treasury released an exposure draft today. The proposed new tax system for managed investment trusts (MITs) will modernise the tax rules for eligible MITs and increase certainty for both MITs and their investors. The new rules will enhance the international competitiveness of Australian managed funds and promote the greater export of Australia’s funds management expertise.

The exposure draft legislation has been developed in close consultation with key stakeholders in the managed funds industry.

The key features of the new tax system for eligible MITs include:

  • an attribution model for determining member tax liabilities, which allows amounts to retain their tax character as they flow through a MIT to its members;
  • the ability to carry forward understatements and overstatements of taxable income, instead of re-issuing investor statements;
  • deemed fixed trust treatment under the income tax law;
  • upwards cost base adjustments to address double taxation; and
  • legislative certainty about the treatment of tax deferred distributions.

Bilateral Local Currency Swap Agreement with the People’s Bank of China

The Reserve Bank of Australia has signed a new bilateral local currency swap agreement with the People’s Bank of China (PBC). The agreement, which can be activated by either party, allows for the exchange of local currencies between the two central banks of up to A$40 billion or CNY 200 billion. It follows the initial swap agreement between the two central banks signed in 2012 and is for a further period of three years.

As with the initial agreement in 2012, the main purposes of this agreement are to support trade and investment between Australia and China, particularly in local-currency terms, and to strengthen bilateral financial cooperation. The agreement reflects the increasing opportunities available to settle trade between the two countries in Chinese renminbi (RMB) and to make RMB-denominated investments. Other recent initiatives between the two countries include the establishment of an official RMB clearing bank and the granting of a quota as part of the RMB Qualified Foreign Institutional Investor program in November 2014.

Backdoor Listing Up, Says ASIC

ASIC has today published the second report in its series on the regulation of corporate finance issues in Australia.

The report, which covers the period July to December 2014, provides companies and their advisers with insights into ASIC’s regulatory approach in the corporate finance sector and aims to assist them with their associated legal and compliance obligations.

ASIC is responsible for the regulation and oversight of corporate finance activity in Australia, with a particular focus on corporate transactions such as fundraising, takeovers, schemes of arrangement, share buy-backs, compulsory acquisitions, employee incentive schemes and financial reporting. The Corporations and Emerging Mining and Resources (EMR) teams are responsible for regulating disclosure and conduct by corporations in Australia in these areas.

In this period there was a 39% increase in the number of disclosure documents lodged with ASIC (compared to the period 1 January to 30 June 2014, and a slight increase in applications for relief from Ch 6D. The table below depicts the top 10 public fundraising transactions by value of the offer based on disclosure documents lodged with ASIC in this period. Hybrid securities make up a notable portion of these fundraisings.

ASIC-Top-TenWhen reviewing prospectuses in this period, among other things, ASIC responded to the following trends:

  1. financial information (including pro-forma financial information) that is not sufficiently complete or adequately reviewed by a third party such as an auditor;
  2. an increase in backdoor listing prospectuses;
  3. poor quality information about companies operating in an emerging market; and
  4. an increase in the number of listed investment companies seeking quotation.

Financial disclosures

Financial disclosures are of significant concern to ASIC, as they paint a picture of the history of the performance of the company and effectiveness of management. Financial information, both statutory and pro forma, is essential to informing investors about the past performance and future prospects of the company. Some of the concerns with the disclosure of financial information we identified include:

  1. pro-forma adjustments described as one-off events;
  2. a lack of prominent disclosure of material differences between statutory and pro-forma financial results; and
  3. multiples not being included for all forecast

Backdoor listings

In this period ASIC reviewed disclosure by 30 companies seeking admission to ASX by way of a backdoor listing—that is, a company seeking to access capital by selling their business into a company that is already listed on an Australian exchange.

Businesses offering web-based products and services or start-up technologies are the most common type of business currently seeking admission by way of backdoor listing. These often have unique businesses requiring technical explanation of a high proportion of intangible assets in their financial statements. With these characteristics it is difficult for investors to make an informed decision unless:

  1. considerable care is taken in explaining the business without the use of jargon; and
  2. a justification for the valuation of intangible assets is provided.

ASIC raised concerns with 22 (73%) of these offer documents, with concerns being addressed by way of supplementary disclosure. In six instances ASIC made interim stop orders in relation to backdoor listing prospectuses; two stop orders were revoked, one had a final stop order made and three prospectuses are still subject to those interim stop orders.

Other concerns identified in a number of backdoor listing prospectuses include:

  1. insufficient financial disclosure, including a lack of operating history, lack of audited financial information, and disclosure of information presented other than in accordance with accounting standards (non-IFRS financial information);
  2. insufficient disclosure of a company’s business model and use of proceeds;
  3. disclosure of directors’ history not consistent with our policy in disclosure of directors’ history not consistent with our policy in RG 228; and
  4. risk disclosure not adequate or appropriately tailored to a company’s circumstances.

Half of the businesses seeking a backdoor listing come from a foreign jurisdiction, with the majority of these from an emerging market. ASIC continues to consider the challenges facing these entities when reviewing a prospectus, and will raise concerns where we consider disclosure is inadequate or misleading.

With the slowdown in the mining sector ASIC expects backdoor listing activity to remain strong.

Listed investment company disclosure

In the last year ASIC  saw an increase in the number of initial public offerings of listed investment companies. These are entities that seek to make a return for investors through their investment activities rather than through operating a business. This raises a few disclosure concerns unique to listed investment company prospectuses.

Firstly, listed investment companies often have similar characteristics to a hedge fund, and may use complex strategies like leverage, short selling and derivatives. These can be quite challenging to explain, and ASIC is concerned that retail investors may struggle to understand how a company intends to make money—particularly when jargon is used excessively. If a listed investment company has similarities to a hedge fund, then it should make disclosure that is similar to that provided by a hedge fund.

Another feature of listed investment companies is that they can have an external manager that may be a related party. The fees charged by the external manager can have a material impact on investors’ returns and, where this is the case, the prospectus should give meaningful disclosure. For example, in some circumstances it may be more appropriate to include a worked example or explain the practical effect of a fee, rather than just cite a complex formula. Where a performance fee formula means that investors’ returns are capped at 10%, it is not sufficient to disclose the formula. The prospectus must clearly and prominently disclose that investors’ returns will not exceed 10%.

Finally, listed investment company prospectuses often seek to include disclosure setting out the past performance of other entities managed by their manager. Concerns about these disclosures are commonly raised by ASIC.

Treasury Consultation on Resolution Regime for Financial Market Infrastructure (FMI’s)

The Treasure today announced further consultation on a proposed resolution regime for financial markets infrastructure (FMI’s).   Australia was one of sixteen jurisdictions which has no administrative authority responsible for resolution of FMIs. FMIs are defined as multilateral systems used to clear, settle and record financial transactions. They are an essential element enabling financial markets to work smoothly.

  • Clearing is a post-trade and pre-settlement function performed by financial market participants to manage trades and associated exposures. Through the legal process of novation, a central counterparty (CCP) interposes itself between counterparties to transactions executed in the markets it serves, becoming principal to each transaction so as to ensure performance of obligations.
  • Settlement is the point at which the counterparty exposures associated with a transaction are eliminated. In securities markets, settlement is facilitated by securities settlement facilities (SSFs).
  • TRs are facilities that centrally collect and maintain records on over-the-counter (OTC) derivatives transactions and positions for the purpose of making those records available to regulators and, to an appropriate extent, the public.

Internationally, the Financial Stability Board (FSB), the Committee on Payments and Market Infrastructures (CPMI, formerly the Committee on Payment and Settlement Systems (CPSS)) and the International Organization of Securities Commissions (IOSCO) have progressed work on international guidance for FMI recovery and resolution. The FSB adopted the Key Attributes of Effective Resolution Regimes for Financial Institutions (the KAs) in October 2011, and the G20 Leaders endorsed these KAs in November 2011. The FSB subsequently added guidance for applying the KAs to FMIs (the FMI Annex to the KAs) in October 2014. Together, the KAs and the FMI Annex to the KAs identify the powers and limits of a resolution framework for financial institutions, including FMIs. CPMI and IOSCO also published guidance on the development of recovery plans for FMIs in October 2014. The guidance provided in these documents extends to CS facilities and TRs, but not financial markets. The FSB is monitoring jurisdictions’ progress in implementing the KAs, including in respect of FMIs, through a series of peer reviews. The first such review was published in April 2013 and noted that resolution regimes for FMIs were generally less developed than corresponding regimes for banks. Australia was one of sixteen jurisdictions identified in the report as having no administrative authority responsible for resolution of FMIs.

The Australian Government, acting on the advice of the Reserve Bank of Australia (RBA), the Australian Securities and Investments Commission (ASIC), the Australian Prudential Regulation Authority (APRA) (jointly, the Regulators) and the Australian Treasury — seeks stakeholder views on legislative proposals to establish a special resolution regime for clearing and settlement (CS) facilities and trade repositories (TRs), together referred to as financial market infrastructures (FMIs), consistent with international standards. Some of the legislative proposals in this paper relating to directions powers and international regulatory cooperation also extend to operators of domestically incorporated and licensed financial markets. Closing date for submissions is Friday, 27 March 2015.

Although robust risk management significantly reduces the likelihood of an FMI failure, the possibility of such failure is not entirely eliminated. With increasing dependence on centralised infrastructure, motivated in part by regulatory reforms, it is vital that the official sector clarifies how it would address a situation of FMI distress. The particular focus of this consultation paper is on resolution: actions taken by public authorities to either return an FMI to viability or facilitate its orderly wind-down. The associated concept of recovery refers to actions taken by a distressed FMI itself to return to viability. The powers proposed for the resolution authority in relation to FMIs are:

  • Statutory management. The power to appoint an individual, company or the resolution authority itself to temporarily administer a distressed FMI in a manner consistent with the objectives of the resolution regime. The statutory manager would assume the powers of the FMI’s board, including carrying out recovery measures and other actions in accordance with the FMI’s rulebook. The exercise of powers by the statutory manager would be overseen by the resolution authority.
  • Moratorium on payments to general creditors. The power to suspend an FMI’s payment obligations to general creditors. This would exclude payments made in relation to core FMI activities (such as margin payments and settlement of securities transactions).
  • Transfer of operations to a third-party or bridge institution. The power to compulsorily transfer all or part of an FMI’s operations to a willing third-party purchaser, or a temporary bridge institution established by public authorities. A transfer to the latter would be intended as an interim step towards a return to private sector ownership under new governance arrangements.
  • Temporary stay on early termination rights. The power to impose a temporary stay of up to 48 hours on termination rights (with respect to future obligations) that may be triggered solely by an FMI’s entry into resolution. It is also expected that FMIs would ensure that such termination rights were not included in their rules or contracts with critical third-party suppliers.

The powers available to the resolution authority have the potential to significantly impact participants and other stakeholders that have dealings with FMIs. The legislative proposals provide a right to compensation from the Commonwealth should participants or other stakeholders be left worse off in resolution than they would have been had the FMI entered general insolvency. The proposals also include an immunity from liability for the resolution authority, statutory manager and others acting in compliance with the directions of the resolution authority. It is envisaged that in some resolution scenarios, there could be a need to draw on public funds to provide temporary liquidity, to ensure the timely disbursement of operating expenses, or in some extreme cases to meet a small shortfall required to complete an FMI’s closeout processes. In each of these cases the Government would seek to recover any expenditure from participants and shareholders of the FMI.