Moody’s Cuts Aussie Bank Ratings Due To “Tail Risk” Concerns

From Zero Hedge.

Back in 2007, the ratings agencies were so woefully behind the eight ball in understanding and reporting the credit risks in the U.S. financial system that it was nearly impossible to tell from day to day whether they were really just that incompetent or if they were complicit in the biggest financial fraud in history.  Regardless of which you believe is more likely, they seem intent upon not making the same mistake again…at least not in Australia.

As The Sydney Morning Herald points out today, Moody’s has cut the long-term credit rating of Australia’s four biggest banks after pointing to surging home prices, rising household debt and sluggish wage growth as potential threats to the financial industry down under.  Australia & New Zealand Banking Group Ltd., Commonwealth Bank of Australia, National Australia Bank Ltd. and Westpac Banking Corp. were all downgraded to Aa3 from Aa2, Moody’s said in a statement released earlier today. Per The Sydney Morning Herald

“In Moody’s view, elevated risks within the household sector heighten the sensitivity of Australian banks’ credit profiles to an adverse shock, notwithstanding improvements in their capital and liquidity in recent years,” the statement said.

“In Moody’s assessment, risks associated with the housing market have risen sharply in recent years. Latent risks in the housing market have been rising in recent years, because significant house price appreciation in the core housing markets of Sydney and Melbourne has led to very high and rising household indebtedness,” the statement said.

“The rise in household indebtedness comes against the backdrop of low wage growth and structural changes in the labour market, which have led to rising levels of underemployment”.

“Whilst mortgage affordability for most borrowers remains good at current interest rates, the reduction in the savings rate, the rise in household leverage and the rising prevalence of interest-only and investment loans are all indicators of rising risks.”

Of course, as we’ve pointed out multiple times before, the Chinese money laundering operation…sorry, we meant Sydney “housing market”…puts the previous U.S. housing bubble to shame.

Of course, all of the banks that are now being downgraded are the same ones that assured us just a couple of months ago that Australian home prices were not in a “speculative bubble.” Testifying before a parliamentary committee, the chief executives of National Australia Bank, Westpac Banking and Commonwealth Bank of Australia all said that while they were worried about elements of the housing market, prices weren’t over-inflated.  Per Bloomberg

“I would draw the distinction between a speculative bubble in prices and prices beyond what fundamentals would justify,”Westpac’s Brian Hartzer told the committee in Canberra Wednesday. A bubble isn’t occurring in Sydney or Melbourne, where house prices have risen the most, he said.

“There are increasing risks, but I still believe the answer is no,” National Australia Bank’s Andrew Thorburn said when asked if houses in Sydney and Melbourne are overpriced.

Commonwealth Bank, the nation’s largest mortgage lender, is “lending at levels we are comfortable with” across Australia, Chief Executive Officer Ian Narev told the committee when he testified Tuesday.

Meanwhile, the ever-important “crane-index” helps to put some perspective around just how ‘bubbly’ the Australia market has become.

Australia

Of course, maybe Australia’s bankers are right and bubbly home prices are just the result of strong fundamentals.  Although, the last time a prominent banker made a similar prediction in the U.S. he turned out to be just a bit off the mark.  Ben Bernanke (July 2005):

“Well, unquestionably, housing prices are up quite a bit; I think it’s important to note that fundamentals are also very strong. We’ve got a growing economy, jobs, incomes. We’ve got very low mortgage rates. We’ve got demographics supporting housing growth. We’ve got restricted supply in some places. So it’s certainly understandable that prices would go up some. I don’t know whether prices are exactly where they should be, but I think it’s fair to say that much of what’s happened is supported by the strength of the economy.”

Oops!

Residential property prices rise 2.2 per cent

Residential property prices rose 2.2 per cent in the March quarter 2017, the fourth consecutive quarter of growth, according to figures released today by the Australian Bureau of Statistics (ABS).

Program Manager for Prices Branch, Marcel van Kints, said; “While residential property prices rose in most capital cities this quarter, Sydney and Melbourne continue to drive the national result.”

The price rises in Sydney (3.0 per cent) and Melbourne (3.1 per cent) were partially offset by falls in Perth (1.0 per cent) and Darwin (0.9 per cent).

Through the year growth in residential property prices reached 10.2 per cent in the March quarter 2017. Sydney recorded the largest through the year growth of all capital cities at 14.4 per cent, followed closely by Melbourne at 13.4 per cent.

The total value of Australia’s 9.9 million residential dwellings increased $163.1 billion to $6.6 trillion. The mean price of dwellings in Australia is now $669,700.

This ongoing rise may go counter to some recent data, although we note the CoreLogic data this week also shows rises in most centres, after recent softer data.

But of course the ABS data is prior to the recent regulatory interventions. As the HIA puts it:

“There is evidence that since March 2017 dwelling price growth has slowed following the introduction of additional restrictions by APRA and increased barriers to foreign investor participation imposed at federal and state level”.

So the next ABS series, due out in 3 months will be the one to watch.  Why do we need to wait so long for this data? The ABS is very slow to generate this particular series.


Auction Results 17 June 2017

The preliminary auction results for 17 June 2017 from Domain, show a national clearance rate of 71.3% with 1,041 sold, up from last week which was a long weekend, but lower than this time last year.

Sydney cleared 69.6% with 418 sold, compared with 72.2% with 654 sold this time last year. In Melbourne, 75.3% cleared with 549 sold compared with 69.2% with 654 sold this time last year. So some easing is visible.

Brisbane cleared 44% of 97 listed, Adelaide 80% of 72 listed and Canberra 55% of 53 listed.


Households Budgets Under Pressure – The Property Imperative Weekly 17 June 2017

Household financial pressures continue to build as the costs of energy rise, under employment lifts to a record and interest rates climb. Welcome to the Property Imperative weekly to 17th June 2017.

Power bills will soar by hundreds of dollars next month in east coast states, and experts blame policy uncertainty in Canberra. Two major retailers, Energy Australia and AGL, have announced they will hike prices substantially from July 1. A third, Origin Energy, is expected to follow soon. Energy Australia will increase power bills by almost 20 per cent, roughly $300 more a year, for households in South Australia and New South Wales. Gas prices will go up 9.3 per cent in NSW and 6.6 per cent in SA, adding between $50 and $80 to annual bills.

In this week’s economic news, whilst the headline unemployment rate remained at 5.7%, there are significant state variations. Unemployment remains above 7% in South Australian, and below 3.5% in the Northern Territory.

The really important, yet under-reported data related to underemployment, which is at its highest level since records began in the 1970s. The trend estimate of underemployment worsened from 8.7 per cent in December-February to 8.8 per cent in March-May, which means around 1.1 million Australian workers are crying out for more hours.

Pressure on interest rates are likely to continue, with the FED lifting the benchmark rate, and analysts are suggesting the FED funds rate is likely to normalise at 3.5% by 2020, and U.S. 10-year bond yields will rise back above 4%. It seems they were prepared to look through weak first quarter consumption and GDP and underlines concerns about US unemployment falling too far below its equilibrium rate.

But there is a knock of effect, in that the T10 bond yield is directly linked to the price of money on the international capital markets, and as Australian banks, especially the larger ones are reliant on international funding, this will put upward pressure on mortgages rates here.

So, putting all this together, we expect pressure on household budgets will continue to grow. We expect the number of households in mortgage stress to pass 800,000 quite soon. That’s getting close to a quarter of households.

Analysis of the latest Westpac and Melbourne Institute’s consumer sentiment index, which reported at 96.2 in June 2017, shows the “time to buy a dwelling index” which is a subset of the consumer sentiment index was at 90.9 points and is hovering around the lowest levels seen since the financial crisis.  Whilst Australians tend to be bullish on housing and its prospects, this data shows that sentiment towards housing has been consistently negative since February of this year.

Several more banks made changes to mortgage interest rates and underwriting standards.  For example, Bank West reduced the maximum LVR on interest only loans to 80% and some loan rates will rise between 4 and 34 basis points for both existing owner occupied and investor loans. On the other hand, the bank will reinstate applications from non-Bankwest customers for standalone refinance of P&I investor purpose loans and dropped the rate for some new P&I investment lending.

CBA changed its serviceability buffers to fall in line with the other majors. For those taking out a new mortgage who already have an existing CBA home loan, line of credit or business loan, the bank will assess the ability to pay through an interest rate buffer of 7.25% p.a. or the current interest rate plus 2.25% p.a. minus any existing rate concessions (whichever is higher). For customers with an existing owner occupied/investment, line of credit or business loan with an external financial institution, CBA will apply a service loading of 30% to the current repayment amount.

Teachers Mutual Bank increased home loan variable and fixed interest rates by 10 basis points or 0.10%, for new business. It has 174,000 members and more than $5.3 billion in assets.

We are also seeing some banks tweak their mortgage origination strategy, as they power up owner occupied mortgage lending through their branch networks, whilst slowing the volume of loans written through the broker channel, and interest only loans to investors in particular. In a recent The Adviser survey, brokers who had experienced channel conflict were asked which type of loan their clients had been approached by their bank to refinance. Almost 74 per cent of brokers said clients with owner-occupier mortgages had been targeted.

The Senate Inquiry into the Bank Tax heard from industry participants this week. On one hand the Customer Owned Banking Association – COBA –  the industry association for Australia’s customer owned banking institutions – mutual banks, credit unions and building societies said they welcomed the tax as it would help to rebalance competition in the Industry. They claim that the implicit Government guarantee, which the major banks enjoy, stacks the deck in terms of pricing.

On the other hand, the majors said that whilst they accept the tax will be imposed, the costs cannot be absorbed and will be passed on the customers, shareholders and staff members. They said the levy should be temporary, and should be extended to include foreign banks operating in Australia to level the playing field.

So what started as a cash grab by the Treasurer has morphed into a significant discussion about banking competition and funding. But the bottom line is, bank customers will pay.

Research released this week suggested that far from being the ‘bad guys’, property investors actually keep the Australian economy afloat. They found that federal, state and local governments collect about $50 billion in property taxes every year – with property investors paying substantially higher rates than owner occupiers. Every year property investors pay $8 billion in stamp duty, $7 billion in land tax, $130 million in council taxes, as well as tax on $7.5 billion of net rental gains. Property investors also declared gross profits of $50 billion on property sales in 2015, according to estimates, which would have attracted billions more in taxation revenue.

Our latest survey data indicates that forward demand for property is easing, driven by concerns about future interest rate rises, tighter bank lending rules and rising costs of living. This is confirmed by lower clearance rates at auction over the long weekend, and further indications are emerging that home prices are easing.

The net effect of these changes will be to apply a drag anchor to economic growth. Just how severe this braking effect will be remains to be seen, but I think we can safely say we are on a falling trajectory. What property investors choose to do suddenly becomes very important.

That’s the Property Imperative for this week. Check back next time for the latest update. Thanks for watching.


Bendigo Changes Homesafe Income Accounting

Bendigo Bank announced they have made a change to the treatment of Homesafe for cash earnings purposes to exclude any unrealised income or losses and associated funding costs. This will not change the statutory earnings report, when the full year results on released on 14th August.

Realised earnings from completed contracts will still be included, but the mark-to-market element will now be excluded. Interesting timing given the fact that home price growth looks to be stalling! This will probably reduce the volatility of earning going forward. But Bendigo had a 6% long run home price growth assumption.

The net effect will be a reduction in cash earnings.  This change will remove any unrealised income or losses from cash earnings for the years ended 30 June 2016 and 30 June 2017 and future years’ results.


The Great Rotation – The Property Imperative Weekly 3rd June

The great rotation is well underway as investors vote with their feet whilst first time buyers are getting greater incentives to buy into the market at its peak. Welcome to the Property Imperative Weekly for 3rd June 2017.

In this weeks review we look at changes to mortgage interest rates, new first time buyer incentives and new findings from our core market model, freshly updated to end of May.

We saw a litany of rate hikes during the week, and other changes to lending conditions. On Monday NAB reduced the maximum LVR for interest only loans from 95% to 80% for both owner occupied and investor purchasers.  They also reduced the LVR for construction loans to 90%.

On Tuesday, AMP bank lifted its variable interest rate for owner occupied loans by 28 basis points and the bank also hiked fixed rates for owner-occupied and investment interest-only loans by 20 basis points. They dropped the maximum loan-to-value ratio for interest-only loans from 90 per cent to 80 per cent. On the other hand, fixed rates for owner-occupied principal and interest loans have decreased by 10 basis points.

On the same day Westpac reduced the LVR for new and existing interest only loans to 80%, across the board including both owner occupied and investment loans. They also said they would no longer accept new standalone refinance applications from external providers. But they waived the switching fees for borrowers who wanted to shift from interest only to principal and interest loans.

On Wednesday NAB offered new white label principal and interest mortgages through its Advantedge wholesale funder, with a maximum LVR of 80%, including at 4.24% loans to residential investors.

On Thursday, Teachers Mutual brought out a new hybrid combination mortgage, which limits the amount of the loan which can be interest only.  They also increased the interest only loan rate by 40 basis points.

And on Friday, Bank West, the CBA subsidiary announced a new LVR band at 95% plus, with a mortgage rate of 5.29%, up by three quarters of a percent. Other lending will be capped at 95% LVR.

So mortgage rates continue to rise, especially for interest only loans, and investors; and underwriting standards continue to tighten.  Many households will see their repayments rise, again, despite no change in the RBA cash rate, so adding to their financial stress.

This week we got the April lending data from the RBA and APRA. The Reserve Bank said housing lending rose 0.5% in the month, or 6.5% over the past year to $1.66 trillion dollars. Within this, owner occupied loans rose 0.55% whilst investment loans grew 0.36%, and another $1.1 billion were reclassified by the banks, making a total of $52 billion which is nearly 10% of the investment loan book. This ongoing switching should be concerning the regulators because it means that either the bank data is just wrong, or borrowers are deciding to switch an investment loan to an owner occupied loan to get a lower rate, but we wonder what checks are being done when this occurs.

The proportion of lending to productive business fell again, so housing lending is still dominating the scene to the detriment of the broader economy and sustainable long term growth.

APRA showed that the banks lifted their investor loans by $2.1 billion in April though all the majors are well below the 10% speed limit. The quarterly property exposures showed a fall in higher LVR lending, but interest only loans still well above the 30% threshold APRA set. But weirdly APRA warned that we should not use these statistics to access the impact of their latest moves, because the reported data is based on approved loans, whereas their measure is on funded loans. So plenty of wriggle room and more fog around the data.

Talking of wriggling, Wayne Byres gave evidence to the Senate Economics Legislation Committee and under sustained questioning said alarm bells were ringing on home prices and that we had entered a high risk phase.  It is worth watching the video of the session, which is linked on the DFA Blog.  The regulators continue to be coy about the issue, which by the way is confronting many other countries too. The truth is the financialisation of property is the root cause of the property bubbles around the world, and it will be very hard to tame. Australia is not the only country with a bubble.

Amid all this mayhem, and with bank stocks under pressure relative to the rest of the market, New South Wales released their housing affordability plan. NSW has perpetuated the “quick fix” approach to housing affordability, alongside taxing foreign investors harder and making changes to planning. The removal of stamp duty concessions to property investors may slow that sector, but the fundamental issue is that supply is not the problem many claim it to be.

First time buyers are potentially able to get up to $34,360, but we think this will just push prices higher. The new arrangements start 1 July, so we expect a slow June. With the enhanced incentives in Victoria and Queensland also coming on stream, we are expecting a pick-up in first time buyer demand as investor appetite slows. Our latest surveys show this rotating trend, and we will publish the detailed finding over the next few days. But already we see some investors are selling, to lock in capital growth, and some first time buyers have renewed their search to buy, on the back of the new incentives, and greater supply.

Meantime there was further evidence that property prices are indeed drifting lower . According to CoreLogic’s Home Value Index they fell in Sydney and Melbourne over the month of May, by 1.3% and 1.7% respectively.  It is becoming increasingly clear the momentum is easing, so it now is a question of how far it eases down, and whether prices go sideways, or fall significantly.

We expect mortgage rates to continue to rise. ANZ said their new APRA risk weight for mortgages was now 28.5%, which was at the top end of expectations.  But whilst this is higher than the sub-20 lows, it is still significantly lower than the regional banks capital weights, and even allowing for the bank tax, they remain at a capital disadvantage.  We think APRA will lift capital weights further down the track, and when we take account of expected US rate rises also, mortgage rates will continue to climb. This feeds into, and reinforces the potential slide in prices. Whilst first time buyers may take up some of the slack, we think the market dynamic is morphing into something rather ugly.

And that’s the latest Property Imperative Weekly. Check back next week for the latest installment.

Australia isn’t the only country caught in a housing bubble

Property bubbles have been created by a combination of ultra-low interest rates, easy lending, rapid population growth, and an openness to foreign investment. Underlying it all is the financialisation of property.

From The NewDaily.

It’s only natural for Australians to be obsessed with our own property market woes, but there is a whole world of bubbles out there waiting to be popped.

We chatter endlessly about prices in Sydney and Melbourne, which is unfair to the other capital cities. But it’s understandable, as 57 per cent of the nation lives in Victoria and New South Wales, according to Australia’s statistics bureau.

And we’re right to be concerned. Only this week, Citigroup chief economist Willem Buiter said Australia is in the midst of a “spectacular housing bubble”. He joined a great host of experts worried that our two main property markets have been running way too hot.

The numbers back him up. CoreLogic, one of our most widely cited property pricers, says Australian houses now cost 7.2 times the yearly income of a household, up from 4.2 times income 15 years ago.

Between the global financial crisis and February 2017, median dwelling prices almost doubled (+99.4 per cent) in Sydney, bringing them to $850,000, and in Melbourne (+85 per cent to $640,000), according to CoreLogic.

But we should not delude ourselves that a housing crisis is a uniquely Australian phenomenon. Cries of “Bubble!” are ringing out across the globe.

Sweden’s central bank boss Stefan Ingves this week issued a warning about sky-rocketing household debt and soaring property prices. Sound familiar?

In Switzerland, the cities of Zurich, Zug, Lucerne, Basel, Lausanne and Lugano face similar risks.

Then there’s Ottawa, Vancouver and Toronto in Canada – an economy comparable in size and composition to our own. As it has for Australia, the International Monetary Fund has told the Canadian government to intervene or risk an economic crash.

The International Monetary Fund (IMF) has issued similar warnings for Denmark, which is battling soaring prices in the capital of Copenhagen.

Most important of all is China. Prices rose 22.1 per cent in Beijing, 21.1 per cent in Shanghai and 13.5 per cent in Shenzen between March 2016 and March 2017, CNBC reported.

The warnings are familiar. “If young people lose hope, the economy will suffer, as housing is a necessity,” Renmin University president Wu Xiaoqiu said recently.

The difference is, if the Chinese economy crashes because of a housing market correction, it will echo throughout the world.

Hong Kong is fighting bubbles, too. Reports on its property market are full of “handsome gains” and an impending “burst“.

Closer to home is Auckland in New Zealand, where prices have also doubled since the GFC.

Despite Brexit, the mother country is hurting, too. There are periodic predictions that London will “finally burst” after years of rampant price growth.

So what’s going on? The consensus is that these bubbles have been created by a combination of ultra-low interest rates, easy lending, rapid population growth, and an openness to foreign investment.

Saul Eslake, a renowned Australian economist, told The New Daily there are “common factors” across these affected nations, including immigration. But he cautioned against shutting the borders.

“It’s wrong, it’s factually incorrect to deny that immigration has contributed to rising house prices. It has contributed to it. But I would argue that to respond to it by, as Tony Abbott among others has advocated, cutting immigration would be the wrong approach.”

Dr Ashton De Silva, a property market expert at RMIT University, also blamed demographic change across the globe.

However, Dr De Silva said each country’s unique factors should not be ignored.

“The fact that it’s happening the world over is important to note because there are many countries going through a very similar cycle, such as China,” he said.

“However, whilst we can take this overarching view, we need to be mindful that there is a very important local story going on. And that story is not always consistent.”

If Australia wants to beat its bubble, perhaps it should look to Singapore.

It was fighting rampant prices too until the government intervened and did two things: boosted supply by building a whole bunch of new apartment buildings, and dampened demand by hiking stamp duty and cracking down on foreign buyers.

Sydney and Melbourne Home Price Slide

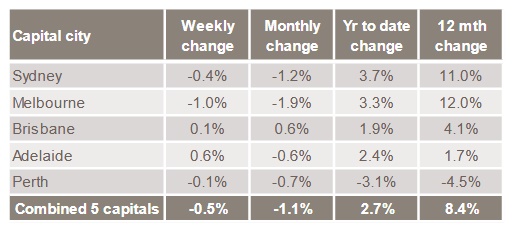
Latest data from CoreLogic shows a continued slide in the major markets  this month. Brisbane (inc. Gold Coast) are the only positive markets.

Still too soon to know whether this is significant, (there were changes made to their index last year which may impact the results), but the annual changes are still strong in the two largest markets.


The Property Imperative Weekly – May 20th 2017

The latest edition of our weekly roundup of property, finance and economics review is available. We discuss the latest economic news, recent developments in the bank tax debate and the latest mortgage pricing and volume data.

Watch the video or read the transcript.

This week, the latest updates from the ABS showed that the trend unemployment rate stuck at 5.8%, thanks to a large rise in part-time employment. In fact, employment was up by a very strong 37,400 in April after increasing by a massive 60,000 in March but the total hours worked was reported to have fallen by 0.3% in April and was down by 0.1% over the past two months. This may be because of changes in the ABS sampling. Many commentators suggest the true position in worse, but we do know that unemployment was above 7% in South Australia, and the number of older people seeking work also rose.

The latest wages data, showed that the seasonally adjusted Wage Price Index rose 0.5 per cent in the March quarter 2017 and 1.9 per cent over the year, according to ABS figures. This makes a bit of a joke  of the strong wages growth rates predicated in the recent budget.

The seasonally adjusted, Wage Price Index has recorded quarterly wages growth in the range of 0.4 to 0.6 per cent for the last 12 quarters. However, private sector wages rose 1.8 per cent whilst public sector wages grew 2.4 per cent, so public servants are doing better than the rest of the population.

The pincer movement of higher inflation and lower wage growth now means that average wages are falling in real terms, especially for employees in the private sector.  Not good for those with mortgages as rates rise flow though. This aligns with our Mortgage Stress data.

There was further heated debate about the Bank levy, with the Treasurer saying on ABC Insiders that the impost was a permanent measure and linked to the strong profits and competitive advantage the big four have thanks to the “too-big-to-fail” implicit guarantee from the government. He again said the costs of the tax should not be passed on to customers.

On the other hand, the banks put their own slant on the issue, saying that the costs would be passed on, and the levy was bad policy. Ex Treasury Boss Ken Henry, now the Chairman of NAB, suggested there should be an inquiry into the proposed tax and said it looked like something from the eighties, before all the free market reform.

The banks made submissions to the Treasury complaining about the short timeframes, and seeking a delay in implementation.  ANZ suggested a delay till September 2017 to allow sufficient time for design of the legislation and also recommended the tax should be applied to the domestic liabilities of all banks operating in Australia with global liabilities above $100 billion. They concluded “There is no ‘magic pudding’. The cost of any new tax is ultimately borne by shareholders, borrowers, depositors, and employees”.

But the real debate should be framed by the excess profits the big banks make, and the unequal position the big four have thanks to the implicit government guarantee, meaning they can out compete regional and smaller lenders. In fact, the value of this subsidy is significantly higher than the 6 basis points being imposed. These are the very high stakes in play, and the outcome will significantly impact the future shape of banking in Australia.  In fact, you could argue the big four receive the largest subsidies of any industry in the country – way more than, for example, the entire car industry.

In addition, the Australian Bankers Association is caught trying to represent the interest of the big four, and other regional players, including some who have supported the tax on the basis of it helping to level the competitive landscape. The ABA issued a statement to say there was no division, but there clearly is. Not pretty. Some have suggested the smaller players should create their own separate lobby group.

The latest lending data from the ABS showed that the mix of lending is still too biased towards unproductive home lending, at the expense of lending for commercial purposes. Overall trend finance flow in trend terms rose 1.3% to $70 billion, up $691 million. The total value of owner occupied housing commitments excluding alterations and additions rose 0.1% in trend terms, to $20.1 billion, up $26 million. Within the fixed commercial lending category, lending for investment housing fell 0.3%, down $44 million to $13.2 billion, whilst lending for other commercial purposes fell 2%, down $416 million to $20.3 billion. 39% of fixed commercial lending was for investment housing and this continues to climb.  Most of the investment in housing was in Sydney and Melbourne.

The more detailed housing finance data showed that the number of owner occupied first time buyers rose in March by 20.5% to 7,946 in original terms, a rise of 1,350.  In original terms, the number of first home buyer commitments as a percentage of total owner occupied housing finance commitments rose to 13.6% in March 2017 from 13.3% in February 2017.

The DFA surveys saw a small rise in first time buyers going to the investment sector for their first property purchase. Total first time buyers were up 12.3% to 12,756, still well below their peak from 2011 when they comprised more than 30% of all transactions. Many are being priced out or cannot get finance.

Lenders continued to tighten their underwriting standards for interest only loans, with CBA, for example, ending discounts, fee rebates and dropping the LVR to 80%, having in recent months imposed no less than three rate rises on the sector. ANZ tightened their lending parameters too, with the maximum interest only period reduced from 10 years to five years, tightening LVRs and imposing other restrictions.

Overall we think the supply of investor loans will reduce, and that smaller lenders and non-banks will not be able to meet the gap, so we are expecting loan growth to slow further, and the price of loans to rise again.

We also saw auction clearances stronger last weekend, so this confirms our survey results, that households still have an appetite for property, despite tighter lending conditions. Recent stock market falls and greater market volatility will play into the mix now, so we think there will be a tussle between demand for property, especially for investment purposes and supply of finance.

Brokers may well get caught in the cross-fire, and the recent UBS report suggesting that brokers are over-paid for what they do, will not help.  Others have argued UBS got their sums wrong, and denounced the report as “ridiculous”.

It is still too soon to know whether home price growth is really likely to turn, but the strong demand still evident in Sydney and Melbourne suggests momentum will continue for as long as credit is available at a reasonable price. So I would not write off the market yet!

And that’s it from the Property Imperative Weekly this time. Check back for next week’s summary.

Government out of touch on housing policies ahead of budget: poll

From The Conversation.

Australians are concerned about housing affordability, so much so that 45.4% say they would be willing to see the value of their home stop growing to improve the situation, only 31.8% of those polled wouldn’t. An ANU poll shows 51.7% of Australians are also in favour of removing tax concessions like negative gearing.

The poll surveyed 2,513 people (representative of the population) and found 63.6% were willing to see an increase in supply of public housing. Only 32.3% are opposed to relaxing planning restrictions.

With these numbers in mind, it is perhaps surprising that state and federal governments have done so little of any substance in housing policy for decades, if anything they’ve contributed to the problem rather than improved the situation.

Potential policy changes that many believe will improve housing affordability, including removing or reducing tax incentives such as the capital gains tax discount or removing supply impediments, have all been considered too politically difficult by the current government.

The government has justified this by playing to the fear that the value of people’s home may decline or that more liberal planning arrangements may mean that new buildings may spoil the look and feel of local neighbourhoods.

The latest ANUpoll shows Australians are very concerned that future generations may be locked out of home ownership. Three quarters believe home ownership is part of the Australian way of life.

In terms of their own investments we found that nearly 68% of homeowners cite emotional security, stability and belonging as a reason for becoming a homeowner. In terms of security factors, 51% cite financial security, 42% refer to “renting is dead money” and 41% cite security of tenure and being able to “bang nails in the wall”.

Of those families who have an investment property (17% in this poll) the primary motivation for the investment was a “secure place to store money” (27.4%) closely followed by rental income (24.3%). Only 11.9% cited negative gearing as the primary motivator and 13.7% were motivated primarily by the capital gains discount.

Housing remains easily the most popular investment vehicle, with 30% saying their preferred investment for spare cash would be an investment property, followed by 18.5% preferring to upgrade their own home. Only 12.6% preferred shares as an investment.

In spite of recent talk of a housing bubble the general population is not particularly concerned with immediate price drops, with 85% expecting house prices to rise over the coming five years. Only 5.4% expect prices to fall and just 1.7% expect prices to decrease a lot.

If interest rates were to increase by 2 percentage points, 6.4% of mortgage holders expected to be in “a lot” of financial difficulty and 16.7% in “quite a bit”. Only 27.9% would be in no difficulty. While financial difficulty does not mean default, in mortgage markets it may not take a large share of loans to default to cause financial problems for an economy.

As pointed out earlier negative gearing was the least cited reason for property investment which suggests removing the incentive would at least not make a dramatic difference to the level of housing investment in Australia.

The ANUpoll shows that the public are concerned about housing affordability and where policy is directed at improving affordability they are likely to be supportive. The policy options, be they demand side – reducing tax incentives, or supply side – building more dwellings and/or relaxing planning restrictions, are available, but greater political nerve may be required to undertake such options.

Author: Ben Phillips, Associate professor, Centre for Social Research and Methods (CSRM), Australian National University