Mortgage Tightening – The Property Imperative Weekly 30 Sept 2017

Mortgage Lending is slowing and banks are tightening their underwriting standards still further, so what does this tell us about the trajectory of home prices, and the risks currently in the system?

Welcome to the Property Imperative weekly to 30th September 2017. Watch the video, or read the transcript.

We start our review of the week’s finance and property news with the latest lending data from the regulators.

According to the RBA, overall housing credit rose 0.5% in August, and 6.6% for the year. Personal credit fell again, down 0.2%, and 1.1% on a 12-month basis. Business credit also rose 0.5%, or 4.5% on annual basis. Owner occupied lending was up $17.5 billion (0.68%) and investment lending was up $0.8 billion (0.14%). Credit for housing (owner occupied and investor) still grew as a proportion of all lending. The RBA said the switching between owner-occupier and investment lending is now $58 billion from July 2015, of which $1.7 billion occurred last month. These changes are incorporated in their growth rates.

On the other hand, data on the banks from APRA tells a different story. Overall the value of their mortgage portfolio fell 0.11% to $1.57 trillion. Within that owner occupied lending rose 0.1% to $1.02 trillion while investment lending fell 0.54% to $550 billion. As a result, the proportion of loans for investment purposes fell to 34.9%.

This explains all the discounts and special offers we have been tracking in the past few weeks, as banks become more desperate to grow their books in a falling market. Portfolio movements across the banks were quite marked, with Westpac and NAB growing their investment lending, while CBA and ANZ cutting theirs, but this may include loans switched between category. Remember that if banks are able to switch loans to owner occupied categories, they create more capacity to lend for investment purposes.  Putting the two data-sets together, we also conclude that the non-bank sector is also taking up some of the slack.

Our mortgage stress data got a good run this week, with the AFR featuring our analysis of Affluent Stress. More than 30,000 households in the nation’s wealthiest suburbs are facing financial stress, with hundreds risking default over the next 12 months because of soaring debts and static incomes. This includes blue ribbon post codes like Brighton and Glen Iris in Victoria, Mosman and Vaucluse in NSW and Nedlands and Claremont in WA.

The RBA is worrying about household debt, from a financial stability perspective, according to Assistant Governor Michele Bullock.  She said households have really high debt – mainly mortgages, as a result of low interest rates and rising house prices, and especially interest only loans. “High levels of debt does leave households vulnerable to shocks.” She said. The debt to income ratio is rising (150%), but for some it is much higher. We will release our September Stress update this coming week.

Debt continues to remain an issue. For example, new data from the Australian Financial Security Authority shows that in 2016–17, the most common non-business related causes of debtors entering personal insolvencies was the excessive use of credit (8,870 debtors), followed by unemployment or loss of income (8,035 debtors) and then domestic discord or relationship breakdown (3,222 debtors). However, employment related issues figured first in WA and SA.

It is also worth saying the Bank of England has now signalled that the UK cash rate will rise, and this follows recent statements from the FED in the same vein. It is increasingly clear these moves to lift rates will raise international funding costs to banks and put more pressure on the RBA to follow suit.

Meantime, lenders continue to tighten their underwriting standards.

ANZ announced that it will be implementing new restrictions on some loans for residential apartments, units and flats in Brisbane and Perth. Now there will be a maximum 80 per cent loan-to-value ratio for owner-occupier and investment loans for all apartments in certain inner-city post codes. We think these changes reflect concerns about elevated risks, due to oversupply and price falls. ANZ’s policy changes apply to all apartments in affected postcodes, including off-the-plan and non-standard small residential properties valued at less than $3 million. Granny flats though are excluded.

More generally, ANZ also issued a Customer Interview Guide with specific which topics brokers should discuss with home and investment loan borrowers. “We expect brokers to use a customer interview guide (CIG) to record customer conversations as a minimum moving forward,” noted ANZ “while it is not required to submit the CIG with the application, it should be made available when requested as a part of the qualitative file reviews.”

CBA launched an interest-only simulator to help brokers show customers the differences between IO and P&I repayments and a new compulsory Customer Acknowledgement form to be submitted with all home loan applications that have interest-only payments to ensure that IO payments meet customer needs. CBA said that brokers must complete the simulator for all customers who are considering IO payments irrespective of whether the customer chooses to proceed with them. These requirements will be mandatory for all brokers and will become effective on Monday, 9 October.

Suncorp announced it is introducing new pricing methodology for interest only home lending. Variable interest rates on existing owner-occupier interest only rates will increase by 0.10% p.a and variable interest rates on all investor interest only rates will increase 0.38% p.a., effective 1 November, 2017.

But what about property demand and supply?

The ABS said Australia’s population grew by 1.6% during the year ended 31 March 2017. Natural increase and Net Overseas contributed 36.6% and 59.6% respectively. In fact, all states and territories recorded positive population growth in the year ended 31 March 2017, but Victoria recorded the highest growth rate at 2.4%. and The Northern Territory recorded the lowest growth rate at 0.1%. Significantly, Victoria, the state with the highest growth rate is currently seeing the strongest auction clearance rates, strong demand, and home price growth. This is not a surprise, given the high migration and this may put a floor on potential property price falls.

On the other hand, we also see an imbalance between those seeking to Trade up and those looking to Trade down, according to our research. Those trading up are driven by expectations of greater capital growth (42%), for more space (27%), life-style change (14%) and job change (11%). Those seeking to trade down are driven by the desire to release capital for retirement (37%), to move to a place which is more convenient (either location, or for easier maintenance) (31%), or a desire to switch to, or invest in an investment property (18%).  In the past we saw a relative balance between those seeking to trade up and those seeking to trade down, but this is now changing.

Intention to transact, highlights that relatively more down traders are expecting to transact in the next year, compared with up traders. Given that there around 1.2 million Down Traders and around 800,000 Up Traders, we think there will be more seeking to sell, than buyers able to buy. As a result, this will provide a further drag on future price growth, especially in the middle and upper segments of the markets, where first time buyers are less likely to transact. This simple demand/supply curve provides another reason why prices may soon pass their peaks. Up Traders have more reason to delay, while Down Traders are seeking to extract capital, and as a result they have more of a burning platform.

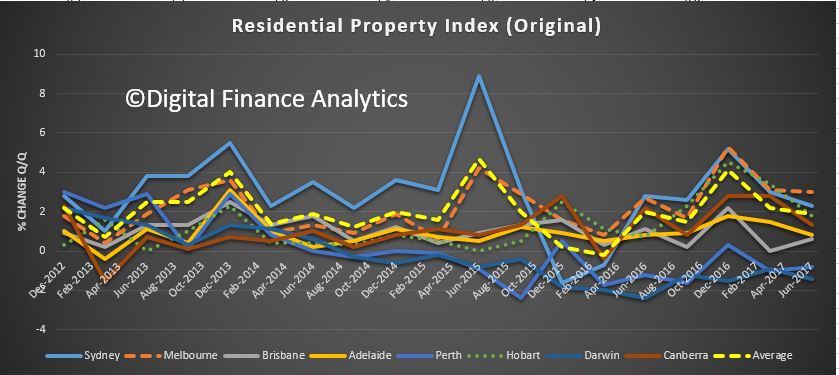
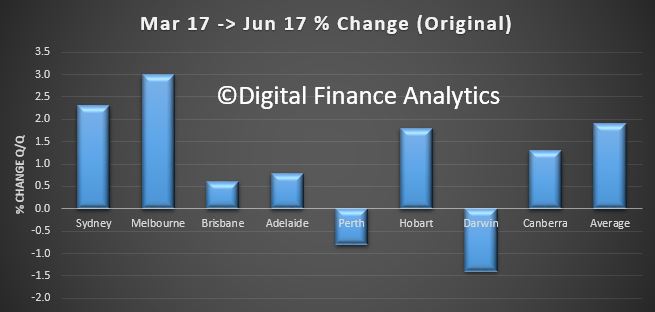
Finally, auction clearance rates were still quite firm, despite the fact that property price growth continues to ease and time on market indicators suggest a shift in the supply and demand drivers, especially in Sydney.

So, overall, banks are on one hand still wanting to grow their home loan portfolios (as it remains the main profit driver), but lending momentum is slowing, and underwriting standards are being tightened further, at a time when home price growth is slowing.

This leaves many households with loans now outside current lending criteria, households who are already feeling the pain of low income growth as costs rise. More households are falling into mortgage stress, and this will put further downward pressure on prices and demand.

So we think the risks in the mortgage market are extending further, and the problem is that recent moves to ease momentum have come too late to assist those with large loans relative to income. As a result, when rates rise, as they will, the pain will only increase further.

And that’s the Property Imperative weekly to 30th September 2017.

Going Up? – The Property Imperative Weekly – 23 Sep 2017

We look at another massive week in property and finance, examine the arguments around mortgage rate rises, and consider which households are more likely to buy in the current market.

Welcome to the Property Imperative weekly to 23rd September 2017, our summary of the key events from the past week. Watch the video, or read the transcript.

We start with mortgage arrears. Moody’s said the number of Australian residential mortgages that are more than 30 days in arrears has shot up to a five year high with a 30+ delinquency rate of 1.62% in May this year and with record high rates in Western Australia, the Northern Territory and South Australia. Arrears were also up in Queensland and the Australian Capital Territory while levels decreased in New South Wales, Victoria and Tasmania.

Ratings agency Standard & Poor’s (S&P) Global Ratings also recorded an increase in the number of delinquent housing loans underlying Australian prime residential mortgage-backed securities (RMBS). This rate rose from 1.15% in June to 1.17% in July. Delinquent loans underlying the prime RMBS at the major banks made up almost half of all outstanding loans and increased from 1.08% to 1.11% from June to July. For the regional banks, this level rose from 2.30% to 2.35%.

Fitch says 30+ days arrears were 3 basis points higher compared with last year despite Australia’s improved economic environment and lower standard variable interest rates.  However, default rates on Retail Mortgage Back Securities was 1.17%, 4 basis points better than the previous quarter.  They made the point that losses experienced after the sale of collateral property remained extremely low, with lenders’ mortgage insurance payments and/or excess spread sufficient to cover principal shortfalls in all transactions during the quarter. So, banks are protected in this environment, even if households are not.

Much of the debate this week centred on how well the economy is doing, and what this means for interest rates. Globally, the Fed is maintaining its tightening stance, with the removal of some stimulus and further lifts in their benchmark rate soon. The financial markets reacted by lifting bond yields, and if this continues the cost of overseas funding will rise, making out of cycle mortgage rate hikes more likely here.

The RBA was pretty positive about the outlook for the global economy, as well as conditions locally.  Governor Philip Lowe said to quote “The Next Chapter Is Coming”. In short, the global economy is on the up, central banks are beginning to remove stimulus, and locally, wage growth is low, despite reasonable employment rates. Household debt is extended, but in the current low rates mostly manageable, but the medium term risks are higher.  Business conditions are improving. He then discussed the growth path from here, including the impact of higher debt on household balance sheets. He said we will need to deal with the higher level of household debt and higher housing prices, especially in a world of more normal interest rates. In this environment, a small shock could turn into a more serious correction as households seek to repair their balance sheets.

I debated the trajectory of future interest rates, and the impact on households with Paul Bloxham the Chief Economist HSBC on ABC’s The Business. In essence, will the RBA be able to wait until income growth recovers, thus protecting household balance sheets, or will they move sooner as global rates rise, and put households, some of whom are already under pressure, into more financial stress?

The Government announced late on Friday night (!) before the school holidays, a consultation on the formation of a new entity to help address housing affordability –  The National Housing Finance and Investment Corporation or NHFIC.  It also includes, a $1 billion National Housing Infrastructure Facility (NHIF) which will use tailored financing to partner with local governments in funding infrastructure to unlock new housing supply; and an affordable housing bond aggregator to drive efficiencies and cost savings in the provision of affordable housing by community housing providers.

Actually, this simply extends the “Financialisation of Property” by extending the current market led mechanisms, on the assumption that more is better. Financialisation is, as the recent UN report said:

… structural changes in housing and financial markets and global investment whereby housing is treated as a commodity, a means of accumulating wealth and often as security for financial instruments that are traded and sold on global markets.

So, we are not so sure about these proposals.  Also, we are not convinced housing supply problems have really created the sky-high prices and affordability issues at all.  And, by the way, the UK, on which much of this thinking is based, still has precisely the same issues as we do, too much debt, too high prices, flat incomes, etc. Anyhow, the Treasury consultation is open for a month.

More lenders dropped their mortgage rates to attract new business, including enticing property investors. For example, Virgin Money decreased the principal and interest investment rates by between 5 and 10 basis points, for loans with an LVR of 80% or below.  Westpac cut its two-year fixed rate for owner-occupiers paying principal and interest by 11 basis points to 4.08 per cent (standalone rate) or 5.16 per cent comparison.

Net, net, demand is weakening and the Great Property Rotation is in hand. Lenders are tightening their underwriting standards further. This week NAB said it would apply a loan to income test to interest-only and principal and interest loans.  The new ratio, which aims to determine the “customer’s indebtedness to the loan amount” takes the total limit of the loan and divides it by the customer’s total gross annual income (as disclosed in the application). Ratios greater than eight will be declined, according to the new policy. This is still generous, when you consider the LTI guidance from the Bank of England is 4.5 times. But good to see Loan to Income ratios being brought to bear – as they are by far the best risk metrics, better than loan to value, or debt servicing ratios.

Our latest surveys showed that more first time buyers are looking to purchase now. We see that 27% want to buy to capture future capital growth, the same proportion seeking a place to live! 13% are seeking tax advantage and 8% greater security of tenure. But the most significant change is in access to the First Home Owner Grants (8%), thanks to recent initiatives in NSW and VIC, as well as running programmes across the country. The largest barriers are high home prices (44%), availability of finance (19% – and a growing barrier thanks to tighter underwriting standards), interest rate rises (9%) and costs of living (6%). Finding a place to buy is still an issue, but slightly less so now (18%).

On the other hand, Property Investors, who have been responsible for much of the buoyant tone in the eastern states are less bullish.  For example, in 2015, 77% of portfolio investors were intending to transact, today this is down to 57%, and the trend is down. Solo investors are down from a high of 49% to 31%, and again is trending lower. Turning to the barriers which investors face, the difficulty in getting finance is on the rise (29%), along with concerns about rate rises (12%). Other factors, such as RBA warnings (3%), budget changes (1%) only registered a little but concerns about increased regulation rose (7%). Around one third though already hold investment property (33%) and so will not be buying more in the next year. So, net demand is weakening.

CBA was the latest major bank to jettison lines of business, as banks all seek to return to their core banking business, by announcing the sale of 100% of its life insurance businesses in Australia (“CommInsure Life”) and New Zealand (“Sovereign”) to AIA Group for $3.8 billion. We have been watching the expansion and contraction cycle for many years, as banks sought first to increase their share of wallet by acquiring wealth and insurance businesses, then found that bankassurance, as the model was called, was difficult to manage and less profitable than expected, as well as being capital intensive. Hence the recent sales –  and expect more ahead. We think considerable shareholder value has been destroyed in the process, especially if you also overlay international expansion and then contraction. Now all the Banks are focussing on their “core business” aka mortgages – but at a time when growth here is on the turn. The moves will release capital, and thanks to weaker competition across the local markets, they can boost returns, but at the expense of their customers.

The Productivity Commission Inquiry into Banking Competition is well in hand, with submissions released this week from the Customer Owned Banking Association. They said that we don’t have sustainable banking competition at the moment. A lack of competition can contribute to inappropriate conduct by firms, and insufficient choice, limited access and poor quality products for consumers. The current regulatory framework over time has entrenched the dominant position of the largest banks. Promoting a more competitive banking market does not require any dilution of financial safety or financial system stability. They also showed that borrowers could get better rates from Customer Owned Lenders, compared with the big players. So shop around.

So back to property. The ABS Property Price Index to June 2017 show considerable variations across the states, with Melbourne leading the charge, and Perth and Darwin languishing. Annually, residential property prices rose in Sydney (+13.8%), Melbourne (+13.8%), Hobart (+12.4%), Canberra (+7.9%), Adelaide (+5.0%) and Brisbane (+3.0%) and fell in Darwin (-4.9%) and Perth (-3.1%). The total value of residential dwellings in Australia was $6.7 trillion at the end of the June quarter 2017, rising $146 billion over the quarter.

Auction clearance rates are still quite strong, if off their highs, but we expect loan and transaction volumes to continue to drift lower as we head for summer.

Putting all the available data together we think home prices in the eastern states will still be higher at the end of the year, but as rates rise from this point, price momentum will ease further, that is unless income growth really does start lifting. The current 6% plus growth in mortgage lending, when incomes and inflation are around 2% is a recipe for disaster down the track. Despite all the jawboning about future growth prospects we think the debt burden is going to be a significant drag, and the risks remain elevated.

And that’s the Property Imperative Weekly to 23th September.

U.S. Home Prices Climb to Pre-Crisis Levels

Home prices in the United States have now climbed to levels last seen a decade ago, though unlike 10 years prior, much of the country’s growth is now sustainable, according to Fitch Ratings in its latest quarterly U.S. RMBS sustainable home price report.

Home prices grew at nearly a 5% annualized rate last quarter and are 36% higher nationally since reaching their low in 2012. As a result they are now slightly above peak levels reached in 2006 – 2007. The difference this time around compared to a decade ago rests with several other notable factors aside from the much talked about low mortgage rates and falling unemployment.

“The U.S. population has increased by more than 30 million people and personal income per capita has increased by more than 30% since 2006,” said Managing Director Grant Bailey. “Both the significantly higher population and income levels provide much greater support for the price levels today.”

That said, growth remains somewhat disjointed in some regions of the US. “Prices in major metro areas of Texas are now more than 50% higher than they were in 2006, while prices in New York, Philadelphia and Washington DC are still 4% – 10% below 2006 levels,” said Bailey. “Elsewhere, home prices in major cities throughout Florida remain more than 15% below 2006 levels.”

The overheated home price pockets remain largely in the Western United States (Texas, Portland, Phoenix and Las Vegas), which Fitch lists at more than 10% overvalued.

Government Consults on National Housing Finance and Investment Corporation

The Government, late on Friday night (!) before the school holidays, has issued a consultation on the formation of a new entity to help address housing affordability. The National Housing Finance and Investment Corporation is central to the Government’s plan for housing affordability.

Actually, this simply extends the “Financialisation of Property” by extending the current market led mechanisms, on the assumption that more is better. Financialisation is, as the recent UN report said:

… structural changes in housing and financial markets and global investment whereby housing is treated as a commodity, a means of accumulating wealth and often as security for financial instruments that are traded and sold on global markets.

So, we are not so sure.  Also, we are not convinced housing supply problems have really created the sky-high prices and affordability issues at all.  And, by the way, the UK, on which much of this thinking is based, still has precisely the same issues as we do, too much debt, too high prices, flat incomes, etc.

Anyhow, the Treasury consultation is open for a month.  We will take a look at the three elements to the proposal:

  • The National Housing Finance and Investment Corporation (NHFIC) – a new corporate Commonwealth entity dedicated to improving housing affordability;
  • A $1 billion National Housing Infrastructure Facility (NHIF) which will use tailored financing to partner with local governments in funding infrastructure to unlock new housing supply; and
  • An affordable housing bond aggregator to drive efficiencies and cost savings in the provision of affordable housing by community housing providers.

They argue that Australians’ ability to access secure and affordable housing is under pressure and that housing supply has not kept up with demand, particularly in our major metropolitan areas, contributing to sustained strong growth in housing prices. This is impacting the ability of Australians to purchase their first home or find affordable rental accommodation.

The average time taken to save a 20 per cent deposit on a house in Sydney has grown from five to eight years in the past decade, while the time taken to save a similar deposit in Melbourne has grown from four to six years over the same period. Half of all low-income rental households in Australia’s capital cities spend more than 30 per cent of their household income on housing costs. Meanwhile, across Australia, community housing providers (CHPs) currently provide 80,000 dwellings to low-income households at sub-market rates, and around 40,000 Australians are currently on waiting lists for community housing and an additional 148,000 are on public housing waiting lists.

The National Housing Finance and Investment Corporation is central to the Government’s plan for housing affordability

In the 2017–18 Budget, the Government announced a comprehensive housing affordability plan to improve outcomes across the housing continuum, focused on three key pillars: boosting the supply of housing and encouraging a more responsive housing market, including by unlocking Commonwealth land; creating the right financial incentives to improve housing outcomes for first-home buyers and low-to-middle-income Australians, including through the Government’s First Home Super Saver scheme; and improving outcomes in social housing and addressing homelessness, including through tax incentives to boost investment in affordable housing.

The Government’s plan includes establishing:

  1. the National Housing Finance and Investment Corporation (NHFIC) — a new corporate Commonwealth entity dedicated to improving housing affordability;
  2. a $1 billion National Housing Infrastructure Facility (NHIF) which will use tailored financing to partner with local governments (LGs) in funding infrastructure to unlock new housing supply; and
  3. an affordable housing bond aggregator to drive efficiencies and cost savings in CHP’s provision of affordable housing.

These measures are important but can only go so far in improving housing affordability. As noted by the Affordable Housing Working Group (AHWG), further reforms to increase the supply of housing more broadly have the capacity to improve housing affordability and alleviate some of the pressure on the community housing sector. To this end, they would be complemented by the development of a new National Housing and Homelessness Agreement with an increased focus on addressing housing affordability.

The Government’s objectives for the NHFIC reflect its priorities to improve affordable housing outcomes for Australians. The NHFIC intends to grow the community housing sector, and increase and accelerate the supply of housing where it is needed most.

Governance of the National Housing Finance and Investment Corporation

Entity structure – The NHFIC is expected to be established through legislation as a corporate Commonwealth entity. It will be a body corporate that has a separate legal personality from the Commonwealth, but will be subject to an investment mandate prescribed by the Treasurer that reflects the Government’s objective of improving housing outcomes. It is currently envisaged that both the NHIF and the affordable housing bond aggregator functions would be established as separate business lines within the single corporate entity. The final structure of the NHFIC will be determined in accordance with the Commonwealth Governance Structures Policy administered by the Department of Finance. The Governance Structures Policy provides an overarching framework to ascertain fit-for-purpose governance structures for all entities established by the Government. The NHFIC Board may also engage third-party providers with the requisite expertise to provide treasury, loan administration and other back-office support for its bond aggregator and/or NHIF business lines.

NHFIC Board

The Government intends to appoint an independent, skills-based Board to govern the NHFIC. Board members are expected to be selected by the Government on the basis of expertise in finance, law, government, housing, infrastructure and/or public policy. The Board will be responsible for the entity’s corporate governance, overseeing its affairs and operations. This includes establishing a corporate governance strategy, defining the entity’s risk appetite, monitoring performance and making decisions on capital usage. The Board will be responsible for ensuring that investment decisions made for the NHIF and the bond aggregator comply with the NHFIC investment mandate. The Board will also ensure that the NHFIC is governed according to best-practice corporate governance principles for financial institutions, including compliance with the Public Governance, Performance and Accountability Act 2013 (PGPA Act).

The affordable housing bond aggregator

The NHFIC will also operate an affordable housing bond aggregator designed to provide cheaper and longer-term finance to CHPs. CHPs are an important part of the Australian housing system. They provide accommodation services for social housing, managing public housing on behalf of state and territory governments. They also own their own stock of housing, which they offer to eligible tenants at below market rents. CHP tenants range from people on very low incomes with rents set at a proportion of their income (generally 25 to 30 per cent) to tenants on low to moderate incomes with rents set below the relevant market rates (usually set at 75 to 80 per cent of market rents).

Many CHPs (over 300) are registered either under the National Regulatory System for Community Housing (NRSCH) or other state and territory regulatory regimes (which is the case in Victoria and Western Australia).

Although the community housing sector has grown over recent years, it remains relatively small at around 80,000 properties (less than 1 per cent of all residential dwellings) in 2016. This is compared to more than 2.8 million properties (around 10 per cent of all residential dwellings) in the United Kingdom in 2015. There are substantial barriers to the community housing sector achieving the scale and capability necessary to meet current and future demand for affordable rental accommodation. These include the fragmentation of the sector, its limited financial capability (including the degree of financial sophistication), and the funding gap — the inability of sub-market rental revenues to cover the costs of providing affordable housing — which constrains the extent of services that CHPs can offer.

Bond aggregator model

The bond aggregator aims to assist in addressing the financing challenge faced by the CHP sector. It improves efficiency and scale by aggregating the lending requirements of multiple CHPs and financing those requirements by issuing bonds to institutional investors. The bond aggregator will act as an intermediary between CHPs and wholesale bond markets, raising funds on behalf of CHPs at potentially lower cost and over a longer term than traditional bank finance (which generally offer three to five-year loan terms). This structure will provide CHPs with a more efficient source of funds, reduce the refinancing risk faced by CHPs and will reduce their borrowing costs. This should enable CHPs to invest more in providing social and affordable rental housing.

However, the bond aggregator alone will not close the funding gap experienced by CHPs. This will require ongoing support from all levels of government. In their respective reports, the AHWG15 and Ernst and Young (EY) both highlight the important role of the bond aggregator, while noting that it is only a partial solution to closing the funding gap for CHPs.

Key findings of the EY report

Analysis undertaken by EY for the Affordable Housing Implementation Taskforce in 2017 found that an affordable housing bond aggregator is a viable prospect in the Australian context and recommended a number of design features. EY found that a bond aggregator could potentially provide longer tenor and lower cost finance to CHPs. The interest savings could be in the order of 0.9 to 1.4 percentage points for 10-year debt (depending on the level of Government support).

Furthermore, EY estimated that the CHP sector will need to access around $1.4 billion of debt over the next five years, which should provide the necessary demand and scale needed to support affordable housing bond issuances.

Property Price Rises; It Depends

The latest ABS data on Residential Property Prices to Jun 2017 are out. They show considerable variations across the states, with Melbourne leading the charge, and Perth and Darwin languishing.

The price index for residential properties for the weighted average of the eight capital cities rose 1.9% in the June quarter 2017. The index rose 10.2% through the year to the June quarter 2017.

The capital city residential property price indexes rose in Sydney (+2.3%), Melbourne (+3.0%), Brisbane (+0.6%), Adelaide (+0.8%), Canberra (+1.3%) and Hobart (+1.8%) and fell in Perth (-0.8%) and Darwin (-1.4%).

Annually, residential property prices rose in Sydney (+13.8%), Melbourne (+13.8%), Hobart (+12.4%), Canberra (+7.9%), Adelaide (+5.0%) and Brisbane (+3.0%) and fell in Darwin (-4.9%) and Perth (-3.1%).

The total value of residential dwellings in Australia was $6,726,783.5m at the end of the June quarter 2017, rising $145,868.5m over the quarter.

The mean price of residential dwellings rose $12,100 to $679,100 and the number of residential dwellings rose by 40,000 to 9,906,100 in the June quarter 2017.


Will Global Interest Rates Fall Further?

Mark Carney, Governor of the Bank of England gave a speech “[De]Globalisation and inflation“.  One passage in particular is highly significant. He discussed the impact of globalisation on inflation, and suggests that there are likely to be further downward pressure on real world interest rates, partly thanks to changing demographics and the relative pools of global investment and global savings. The net result is more investors looking for returns, compared with investment pools – which explains the bidding up of asset prices (including property and shares) while returns to investors continue to fall. The point is, this is structural – and wont change anytime soon. Indeed, he suggests real world interest rates could go lower, with the flow on to inflation.

For the past thirty years, a number of profound forces in the world economy has pushed down on the level of world real interest rates by as much as 450 basis points. These forces include the lower relative price of capital (in part as a consequence of the de-materialising of investment), higher costs of financial intermediation (due to financial reforms), lower public investment and greater private deleveraging. Two other factors – demographics and the distribution of income – merit particular attention.

Bank research estimates that the increased retirement savings as a result of global population ageing and longer life expectancy have lowered the global real interest rate by around 140 basis points since 1990 and they could lead to a further 35 basis point fall by 2025. The crucial point is that these effects should persist after the demographic trends have stabilised because the stock, not the flow, of savings is what matters.


By changing the distribution of income, the global integration of labour markets may also lower global R*. The changes in relative wages in advanced economies have shifted income towards skilled workers, who have a relatively higher propensity to save. Rising incomes in emerging market economies may be reinforcing that effect as saving rates are structurally higher in emerging market economies, reflecting a variety of factors including different social safety regimes.

The high mobility of capital across borders means that returns to capital will move closely together across countries, with any marked divergences arbitraged.

As a consequence, global factors are the main drivers of domestic long-run real rates at both high and low frequencies. For example, Bank of England analysis suggests that about 75% of the movement in UK long-run equilibrium rates is driven by global factors. Estimates by economists at the Federal Reserve deliver similar results.


Global factors also influence domestic financial conditions and therefore the effective stance relative to the shorter-term equilibrium rate of monetary policy, r*.

The presence of borrowers and lenders operating in multiple currencies and in multiple countries creates multiple channels through which developments in financial conditions can be transmitted across countries. For example, changes in sentiment and risk aversion can lead to international co-movement in term premia, affecting collateral valuations and so borrowing conditions.

Work by researchers at the Bank of England, building on analysis by the IMF, shows that a single global factor accounts for more than 40% of the variation in domestic financial conditions across advanced economies. For the UK, which hosts the world’s leading global financial centre, the relationship is much tighter, at 70%.

Highlighting the openness of the UK economy and financial system, a third of the business-cycle variation in the UK policy rate can be attributed to shocks that originate abroad.

One important channel of global spillovers is of course monetary policy. In coming years, it is reasonable to expect global term premia to rise as net asset purchases could shift significantly from the situation during the past four years when all net issuance within the G4 was effectively absorbed.

An affordable housing own goal for Scott Morrison

From The New Daily.

There was considerable shock on Friday when Treasurer Scott Morrison announced legislation that could block billions of dollars of new housing supply – bizarrely enough, in the name of ‘affordable housing’.

Property developers are aghast at Mr Morrison’s draft legislation, because although they see it as giving a small leg-up to the community housing sector, they think it will block literally billions of dollars in investment in mainstream rental dwellings.

Both measures relate to an established way of bringing together large pools of money from institutions or wealthy individuals as ‘managed investment trusts’ (MITs).

Mr Morrison’s draft law is offering MITs a 60 per cent capital gains tax discount for investing in developments run by recognised ‘community housing providers’, rather than the normal 50 per cent discount.

But at the same time the legislation bans MITs from investing in all other residential developments.

The reason that has shocked property developers is that they have been anticipating for some time that MITs would play a major role in the emerging ‘build-to-rent’ housing market.

Two types of build-to-rent

There is some confusion around the term ‘build-to-rent’ at present, because it is being used to describe two quite different kinds of housing, both of which are booming in the UK and US.

The first is a straightforward commercial proposition. A developer might build a 100-dwelling development – be it townhouses, low-rise apartments, or high-rise flats – but instead of selling off each home to speculators or owner-occupiers, it retains ownership and rents them out directly.

The second variation is similar, but involves government subsidies and the input of community housing providers, to keep rents low.

That model, being championed by the likes of shadow housing minister Doug Cameron, would connect large investors such as local super funds or overseas pension funds, with long-term investments that provide secure, good-quality rental properties to lower-income Australians.

So when you read the term ‘build-to-let’, have a look at who is using it – it could mean fancy apartments with swimming pools, gyms or other communal facilities, or just decent housing that cash-strapped people can afford.

A fatal contradiction

What’s so surprising about Mr Morrison’s two new measures, is that they appear to work against each other.

One is trying to push rents down for low-income groups squeezed out of the mainstream market, but the other looks to crimp supply in the mainstream market and thereby push rents up.

That would be a big mistake, because both kinds of new dwellings are needed as our increasingly dysfunctional capital cities look for ways to ‘retro-fit’ sprawling suburbs with higher-density housing.

For many years now I have complained that the housing market didn’t have to get to this point – negative gearing and the capital gains tax breaks that have helped push home ownership out of reach of many Australians should have been reined in years ago.

But they were not, and the market, and the economy more generally, has become dangerously unbalanced by the housing credit bubble that those tax breaks created.

If that imbalance is successfully unwound – by wages catching up to house prices – it will be a small miracle, but it will also take a long time.

In the meantime, increasing housing supply in the right areas of our capital cities is a good way to keep a lid on prices, albeit rents rather then purchase prices – though an abundance of good rental properties can lower those, too.

That is what Mr Morrison’s draft legislation is jeopardising.

Labor, as you might expect, has slammed the ban on MIT investments, which shadow treasurer Chris Bowen says “has completely ambushed the property and construction sector”.

Much rarer, is for the Treasurer to be at odds with the Property Council – the lobby group he worked for between 1989 and 1995.

But it has also been scathing of the change.

It said on Friday: “The answer to Australia’s housing problem is more supply. Build to rent has the potential to harness new investment that could deliver tens of thousands of new homes and provide a greater diversity of choice for renters.

“… the unintended consequence of the draft legislation is to completely close down the capacity for Managed Investment Trusts (MITs) to invest in build to rental accommodation. This risks stalling build-to-rent before it starts.”

Given that kind of opposition, it’s hard to see the MIT investment ban becoming law – or if it did, the government that put such a ban in place ever living it down.

Liar Loans and Household Finances – Property Imperative Weekly 16th Sept 2017

Risks in the property sector continue to rise, as we look at new data on household finances, the competitive landscape in banking and liar loans. Welcome to the Property Imperative to 16th September 2017.

We start our weekly digest looking at the latest data on the state of household finances. Watch the video, or read the transcript.

The Centre for Social Impact, in partnership with NAB released Financial Resilience in Australia 2016. This shows that while people are more financially aware, savings are shrinking and economic vulnerability is on the rise. In 2016, 2.4 million adults were financially vulnerable and there was a significant decrease in the proportion who were financially secure (35.7% to 31.2%). People were more likely to report having no access to any form of credit in 2016 (25.6%) compared to 2015 (20.2%) and no form of insurance (11.8% in 2016 compared to 8.7% in 2015). A higher proportion of people reported having access to credit through fringe providers in 2016 (5.4%) compared to 2015 (1.7%).

The ABS published their Survey of Household Income and Wealth. More than half the money Australian households spend on goods and services per week goes on basics – on average, $846 out of $1,425 spent. Housing costs have accelerated significantly. The data shows that more households now have a mortgage, while fewer are mortgage free. Rental rates remain reasonably stable, despite a rise in private landlords.

We published our Household Finance Confidence Index for August, which uses data from our 52,000 household surveys and Core Market Model to examine trends over time. Overall, households scored 98.6, compared with 99.3 last month, and this continues the drift below the neutral measure of 100. Younger households are overall less confident about their financial status, whilst those in the 50-60 year age bands are most confident. This is directly linked to the financial assets held, including property and other investments, and relative incomes. For the first time in more than a year, households in Victoria are more confident than those in NSW, while there was little relative change across the other states. One of the main reasons for the change is state of the Investment Property sector, where we see a significant fall in the number of households intending to purchase in NSW, and more intending to sell. One significant observation is the rising number of investors selling in Sydney to lock in capital growth, and seeking to buy in regional areas or interstate. Adelaide is a particular area of interest.

There was more mixed economic news this week, with the trend unemployment rate in Australia remaining at 5.6 per cent in August and the labour force participation rate rising to 65.2 per cent, the highest it has been since April 2012. However, the quarterly trend underemployment rate remained steady at 8.7 per cent over the quarter, but still at a historical high, for the third consecutive quarter. Full-time employment grew by a further 22,000 in August and part-time employment increased by 6,000.

The RBA published a discussion paper The Property Ladder after the Financial Crisis: The First Step is a Stretch but Those Who Make It Are Doing OK”. Good on the RBA for looking at this important topic. But we do have some concerns about the relevance of their approach. They highlight the rise of those renting, and attribute this largely to rising home prices. As a piece of research, it is interesting, but as it stops in 2014, does not tell us that much about the current state of play! A few points to note. First, the RBA paper uses HILDA data to 2014, so it cannot take account of more recent developments in the market – since then, incomes have been compressed, mortgage rates have been cut, and home prices have risen strongly in most states, so the paper may be of academic interest, but it may not represent the current state of play.   Very recently, First Time Buyers appear to be more active. More first time buyers are getting help from parent, and their loan to income ratios are extended, according to our own research. Also, they had to impute those who are first time buyers from the data, as HILDA does not identify them specifically.  Tricky!

ANZ has updated its national housing price forecast. They think nationwide prices will finish the year 5.8% higher, though prices are now 9.7% higher than a year ago. They attribute much of the slow-down in home price growth to retreating property investors. They also think Melbourne will be more resilient than Sydney.

Banks have been putting more attractor rates into the market to chase low risk mortgage loan growth this week.  CBA advised brokers that the bank is offering a $1,250 rebate for “new external refinance investment and owner-occupied principal and interest home loans” and some rate cuts.  ANZ increased its fixed rate two-year investor loans (with principal and interest repayments) by 31 basis points to 4.34 per cent p.a., while its two-year fixed resident investor loan with an interest-only repayment structure fell by 10 basis points to 4.64 per cent p.a. Suncorp also reduced fixed rates on its two and three-year investment home package plus loans by 20 and 30 basis points, respectively. The new rate for both is 4.29 per cent p.a., provided that the loan is for more than $150,000 and the loan to value ratio (LVR) is less than 90 per cent. MyState Bank has announced a decrease in its two-year fixed home loan rates for new, owner-occupied home loans with an LVR equal to or below 80%, effective immediately. Data from AFG highlights that the majors are reasserting their grip on the mortgage market – so much for macroprudential.

A UBS Report on “liar loans” grabbed the headlines. It is based on an online survey of 907 individuals who had taken out mortgages in the last 12 months and claimed 1/3 of mortgage applications (around $500 billion) were not entirely accurate. Understating living costs was the most significant misrepresentation, plus overstating income, especially loans via brokers. ANZ was singled out by UBS for an alleged high proportion of incorrect loans. Of course the industry rejected the analysis, but we have been watching the continued switching between owner occupied and investor loans – $1.4 billion last month, and more than $56 billion – 10% of the investor loan book over the past few months. This has, we think been driven by the lower interest rates on offer for owner occupied loans, compared with investor loans. But, we wondered if there was “flexibility with the truth” being exercised to get these cheaper loans. So UBS may have a point.  They conclude “while household debt levels, elevated house prices and subdued income growth are well known, these finding suggest mortgagors are more stretched than the banks believe, implying losses in a downturn could be larger than the banks anticipate”. Exactly.

The Treasury released their Affordable Housing draft legislation, which proposes an additional 10% Capital Gains Tax (CGT) benefit for investors who provide affordable housing via a recognised community housing entity. It also allows investment for affordable housing to be made via Managed Investment Trusts (MIT). The focus is to extend market mechanisms to get investors to put money into schemes designed to provide more rental accommodation via community housing projects. Whilst the aims are laudable, and the Government can say they are “Addressing Affordable Housing”, the impact we think will be limited.

APRA’s submission to the Productive Commissions review on Competition in the Australian Financial System review discusses the trade-off between financial stability and competition. They compared the banks’ cost income ratios in Australia with overseas, and suggests we have more efficient banks here – but they fail to compare relative net income ratios and overall returns – which are higher here thanks to a weaker competitive environment. They conclude that whilst some competition is good, too much risks financial stability.

The House of Representatives Standing Committee on Economics heard from the regulators this week. The focus was the banks’ out of cycle mortgage rate price hikes. Some of the banks have attributed the rise in rates to the regulatory changes but are they profiteering from the announcement? ASIC said the issue was whether the public justification for the interest rate rise was actually inaccurate and perhaps false and misleading, and therefore in breach of the ASIC Act. ASIC is currently “looking at this issue” and will be working with the ACCC, which has been given a specific brief by Treasury to investigate the factors that have contributed to the recent interest rate setting.

APRA was asked if lenders’ back book IO repricing practices were “actually opportunistic changes” that had effectively used the APRA speed limits as excuses to garner profit. Deflecting the question, APRA said it would wait to see what came out of inquiries by the ACCC and ASIC, but it was not to blame for any rate hikes, saying “a direct assertion that we made them put up interest rates is clearly not true”.

We think at very least the banks were given an alibi for their rate hikes, which have certainly improved margins significantly.

Finally, the ABS Data on Lending Finance to end July highlighted the rise in commercial lending, other than for investment home investment, was up 2%, while lending for property investment fell as a proportion of all lending, and of lending for residential housing. This included significant falls in NSW, further evidence property investors may be changing their tune.

So, finally some green shoots of business investment perhaps. We really need this to come on strong to drive the growth we need to stimulate wages. The upswing is there, but quite small, so we need to watch the trajectory over the next few months.  Overall lending grew 0.64% in the month, (which would be 7.8% on an annualised basis), way stronger than wages or cpi. So household debt will continue to rise, relative to income, so risks in the property sector continue to grow.

And that’s the Property Imperative to 16th September 2017. If you found this useful, do subscribe to get future updates and thanks for watching.

The ANZ has upped its national housing price forecasts

From Business Insider Australia.

ANZ Bank analysts have increased their forecasts for property price growth in Australia.

“Given Melbourne’s recent resilience, we have nudged our 2017 price forecasts higher, and now expect nationwide prices will finish the year 5.8% higher,” write economists Daniel Gradwell and Joanne Masters.

However, they see further evidence that the housing market is cooling.

“Weaker auction results point toward slow price growth through the rest of 2017, while tighter borrowing conditions and higher interest rates for investors are also likely to weigh on price growth in 2018,” they say.

At the national level, dwelling price growth has slowed over the past three months.

Prices are now 9.7% higher than a year ago, down from the peak of 11.4% in May.

Here are the ANZ’s forecasts:

Source: ANZ Bank

“Much of this slowdown appears to be caused by a retreating investor presence in the market, in line with recent regulatory changes,” they say.

APRA’s further crackdown aimed at investor borrowing, particularly those with interest-only loans, has seen the investor share of total borrowing steadily decline.

“In turn, price growth has slowed across most capital cities and regional areas and across detached houses and the unit/apartment market,” say Gradwell and Masters.

“Having said that, the Melbourne market has recently been more resilient than the Sydney market, perhaps reflecting an element of catch-up after Sydney outperformed in previous years.”

The economists note there is no suggestion that prices will fall outright only that price growth will slow.

“Melbourne and Sydney will continue to be the main drivers of this growth, in line with their expanding populations,” they write.

“Strong additions to supply are expected to keep a lid on Brisbane’s prices, while Perth and Darwin are likely to have another year of weakness, as their mining boom adjustment winds up.”

Rates Lower For Longer – The Property Imperative Weekly – 02 Sept 2017

New data out this week gives an updated read on the state of the property and finance market. We consider the evidence. Welcome to the Property Imperative Weekly to 2nd September 2017.

Starting overseas, we saw lower than expected job growth in the USA, and also lower than expected inflation. Overall, the momentum in the US economy still appears fragile, and this has led to the view that the Fed will hold interest rates lower for longer. As a result, the stock market has been stronger, whilst forward indicators of future interest rates are lower. In fact, half of the jump caused by the Trump Effect last November has been given back. In Europe, the ECB said there would be no tapering until later, again suggesting lower rates for longer.

This change in the international rate dynamics is relevant to the local market, because it means that international funding costs will be lower than expected, and so banks have the capacity to offer attractor rates without killing their margins.  The larger players still have around one third of their funding from overseas sources and so are directly connected to these international developments.

Westpac for example decreased rates on its Fixed Rate Home and Investment Property Loans with IO repayments by as much as 30 basis points. This sets the new fixed rates for owner occupiers between 4.59% p.a. and 4.99% p.a. while rates for investors lie between 4.79% p.a. and 5.19% p.a. They also brought in a two-year introductory offer on its Flexi First Option Home and Investment Property Loan for new borrowers. After two years, the loan will roll over to the base rate which may be more than 70 basis points higher. This may create risks down the track.

Mozo the mortgage comparison site said that twenty-three lenders have dropped their home loan rates since 1 July, showing that competition for good-quality borrowers is hotting up in the lead up to spring, with lenders offering lower interest rates, fee waivers, or lower deposits for favoured customers. Mozo’s research found the most competitive variable rate in the market for a $300,000 owner-occupier loan is 3.44 per cent, which is 120 basis points lower than the average Big 4 bank variable rate.  Borrowers should shop around.

Elsewhere, Heritage Bank, Australia’s largest customer-owned bank, said it had temporarily stopped accepting new applications for investment home loans, to ensure they comply with regulatory limitations on growth. They have experienced a sharp increase in the proportion of investment lending in their new approvals recently, partly due to the actions other lenders in the investor market have taken to slow their growth.

APRA’s monthly data for July revealed a significant slowing in the momentum of mortgage lending.  Bank’s mortgage portfolios grew by 0.4% in July to $1.58 trillion, the slowest rate for several months. This, on an annualised basis would still be twice the rate of inflation. Investment loans now comprise 35.08% of the portfolio, down a little, but still a significant market segment.

Owner occupied loans grew 0.5% to $1.02 trillion while investment loans hardly grew at all to $552.7 billion, the slowest growth in investment loans for several years. So the brakes are being applied in response to the regulators, although individual lenders are showing different outcomes.

The ABA released a report showing that Less than one third of those surveyed had high levels of trust in the banking industry. This is below the international benchmark. There are significant differences in attitude between those who have higher levels of trust, and those who do not. Those with low trust scores believed the banks were drive by profit, not focussed on customer needs and had terms and conditions which are not transparent.

APRA also released their Quarterly ADI Real Estate and Performance reports to June 2017.  Overall, major banks are highly leveraged, and more profitable. Net profit across the sector, after tax was $34.2 billion for the year ending 30 June 2017, an increase of $6.5 billion (23.5 per cent) on 2016. Provision were lower, with impaired facilities and past due items at 0.88 per cent at 30 June 2017, a decrease from 0.94 per cent at 30 June 2016. The return on equity was 12.0 per cent for the year ending 30 June 2017, compared to 10.3 per cent for the year ending 30 June 2016. Looking at the four major banks, where the bulk of assets reside, we see that the ratio of share capital to assets is just 5.4%, this despite a rise in tier 1 capital and CET1. This is explained by the greater exposure to housing loans where capital ratios are still very generous, one reason why the banks love home lending. Thus the big four remain highly leveraged.

The APRA Real Estate data shows ADIs’ residential mortgage books stood at $1.54 trillion as at 30 June 2017, an increase of $105.2 billion (7.3 per cent) on 30 June 2016. Owner-occupied loans were $1,006.2 billion (65.3 per cent), an increase of $75.8 billion (8.1 per cent) from 30 June 2016; and investor loans were $535.7 billion (34.7 per cent), an increase of $29.4 billion (5.8 per cent) from 30 June 2016. Whilst APRA use a different and private measure of interest only loans, their data showed a significant fall this quarter, although the proportion of new IO loans is still above their 30% threshold.  High LVR lending was down again, although there was a rise in loans approved outside standard approval criteria. Loans originated via brokers remained strong, with 70% of loans to foreign banks via this channel, whilst the major banks were at 48%.

Separately the RBA released their credit aggregates for July. Overall credit rose by 0.5% in the month, or 5.3% annualised. Within that housing lending grew at 0.5% (annualised 6.6% – well above inflation), other Personal credit fell again, down 0.1% (annualised -1.4%) and business credit rose 0.5% (annualised 4.2%). Home lending reached a new high at $1.689 trillion. Within that owner occupied lending rose $7 billion to $1.10 trillion (up 0.48%) and investor lending rose just $0.09 billion or 0.15% to $583 billion.  Investor mortgages, as a proportion of all mortgages fell slightly. A further $1.4 billion of loan reclassification between investment and owner occupied loans occurred in July 2017, in total $56 billion has been switched, so the trend continues.

Building Approvals for July rose 0.7% according to the ABS, in trend terms, approvals for private sector houses rose 1.0 per cent in July, whilst approvals for multi-unit projects continues to slide. This may well adversely hit the GDP figures out soon.  New home sales also declined in July according to the HIA. Sales volumes declined by 3.7 per cent during July 2017 compared with June 2017. Sales for the first seven months of this year are 4.6 per cent lower than in the same period of 2016.

The debate about mortgage broker commissions continues, with a joint submission from four consumer groups to Treasury arguing that brokers don’t always obtain better priced loans for clients than the banks and they don’t always offer a diverse range of loan options.  They suggested that given the trust consumers place in brokers, they should all be held to a higher standard than arranging a ‘not unsuitable’ loan for their customers. They should be required to act in the best interests of their customers. Most industry players argue for minor tweaks or retaining the current structure, arguing that first time buyers may be hit, and that the current commissions do not degrade the quality of advice. CBA apologised to Brokers this week. Ian Narev, the outgoing chief executive officer of the Commonwealth Bank, has apologised to brokers for some of the “uncertainties” it has caused. He said the bank was very committed to the broker channel, as the Aussie transaction shows.  He acknowledged that while the bank has “never shied away” from wanting to do its own business through its branches and direct channels, using a broker was “good for customers”.

CBA was of course in the news for all the wrong reasons, with APRA saying it would look at the culture of the Bank, following the money laundering claims. The investigation will be run by an independent panel, appointed by APRA for six months after which the regulator will receive a final report, to be made public. Of note is their perspective that capital security is not sufficient to guarantee the long term security of the financial system, – culture and accountability are critical too. Of course the big question will be – is CBA an outlier?  Does this also provide more weight to calls for a broader Royal Commission? The bank may also face big penalties if international regulators are forced to act over its breaches of rules around money laundering and terrorism financing. Moody’s says this is credit negative and could damage the bank’s reputation as well as compel it to incur costs and use resources to address any mandated remedial actions

CoreLogic’s revised home price index for August report a 0.1% rise across the capital cities, while regional values fell 0.2%. This was the lowest rolling quarterly gain since June last year. Sydney’s rolling 3-month gain was just 0.3%, with a 13% annual rise. Melbourne was 1.9% in the quarter with 12.7% over the year and Hobart led the pack at 13.6%. Perth and Darwin continue to fall. So the question now is, will the spring surge in sales, and lower mortgage rates support prices, or will we see a fall in the next few months?  Auction clearances remain quite strong.

It is worth saying that the strong growth in Australian home prices is nothing unusual as the latest data from the Bank For International Settlements shows.  Hong Kong has the strongest growth, and New Zealand and Canada are both well ahead of Australia.  We track quite closely with the USA. Spain sits at the bottom of the selected series. The year on year change shows that Australian residential prices are accelerating, whilst the macroprudential measures deployed in New Zealand is slowing growth there. Iceland, Canada and Hong Kong are all accelerating.

So, standing back we see demand for property remaining strong, even if supply of new property is on the slide. Banks are still willing to lend, but are more selective, meaning that some borrowers will find it hard to get a loan, while others will be greeted with open arms and discounts. Banks have the benefits of falling international funding costs and the war chests created by regulator inspired hikes in investor and interest only loans. So we think home prices will continue to find support, and lending will continue to grow overall, even if the mix changes. In addition, we have revised down our expectation of future mortgage rate rises, leading to an estimated fall in the number of defaults, despite the fact that more households are in mortgage stress. We published our updated figures for August on Monday, so look out for that.

And that’s the Property Imperative Weekly to 2nd September 2017. If you found this useful, do subscribe to get future updates and check back for our latest news and analysis on the finance and property market. Thanks for watching.