Inequality Rules – The Property Imperative Weekly 8th July 2017

The Reserve Bank held the cash rate, more banks hiked mortgage interest rates, household debt rose again and our latest research showed that more than 800,000 households across Australia are experiencing mortgage stress. Welcome to the latest edition of the Property Imperative Weekly.

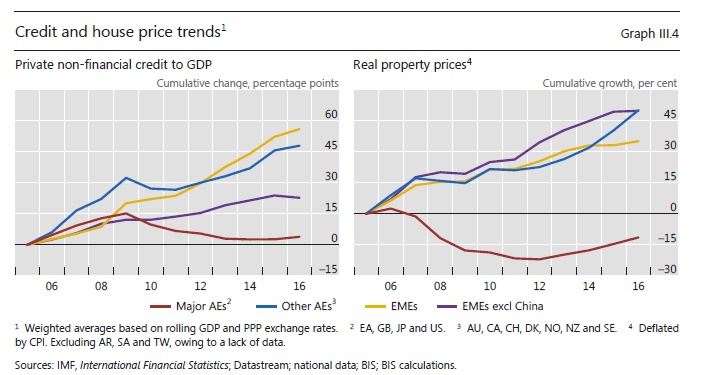
HSBC said the housing bubble fears were overblown. At a national level, a key reason for rising housing prices has been housing under-supply, Chief Economist Paul Bloxham wrote in a research note on Thursday and suggested that a significant fall in Australian housing prices, as occurred in the U.S. and Spain during the global financial crisis, is unlikely.

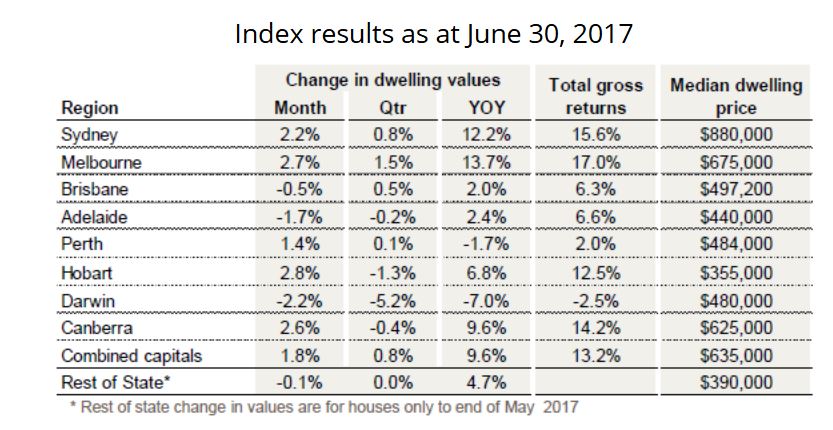
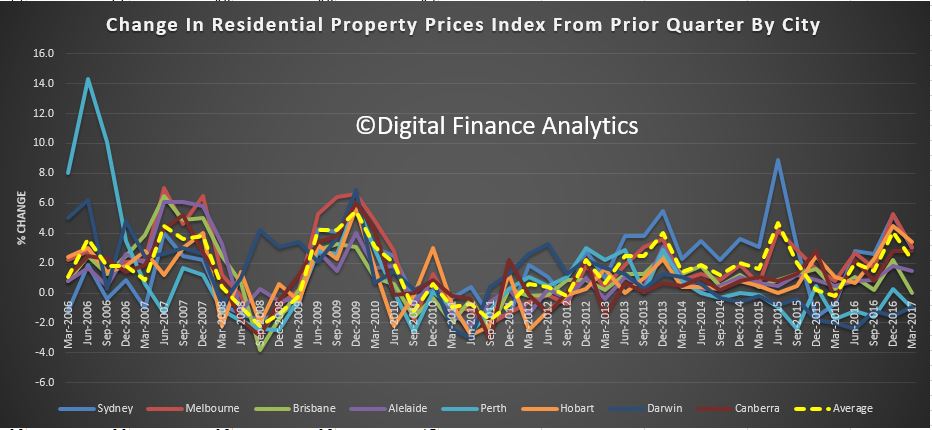
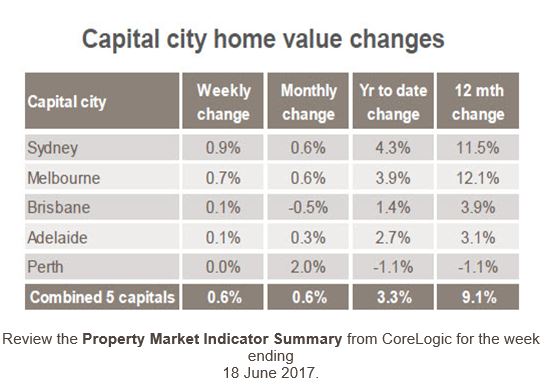
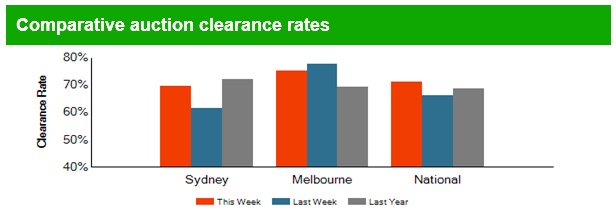
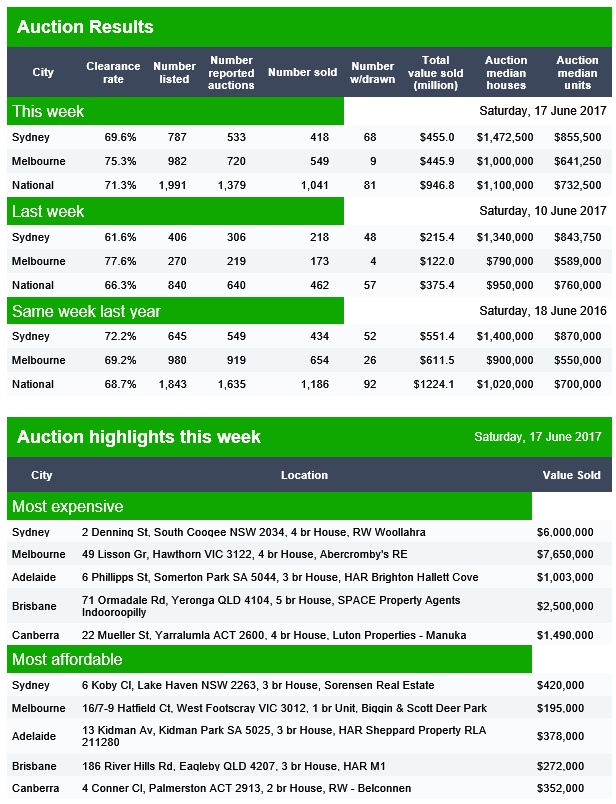
But data from CoreLogic showed whilst  home prices rose in the last quarter, whilst auction volumes fell, and housing affordability deteriorated. The national price to income ratio was recorded at 7.3 compared to 7.2 a year earlier, and 6.1 a decade ago. It would have taken 1.5 years of gross annual household income for a deposit nationally at the end of the March compared to 1.4 years a year earlier and 1.2 years a decade ago. The discounted variable mortgage rate for owner occupiers was 4.55% and an average mortgage required 38.9% of a household’s income.

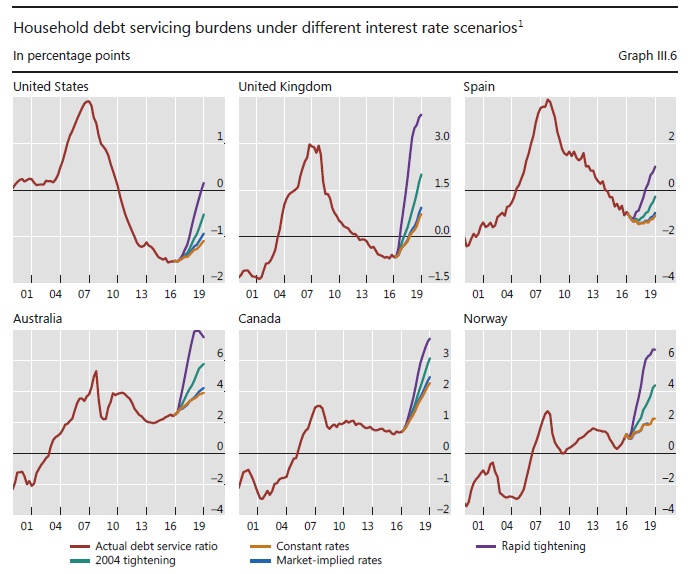
New data from the RBA showed that the household debt to income rose to a high of 190.4. Households are more in debt than they have ever been, and the main question has to be, can it all be repaid down the track, before mortgage interest rates rise so high that more get into difficulty.

Our June mortgage stress results  showed that across the nation, more than 810,000 households are estimated to be now in mortgage stress up from 794,000 last month, with 29,000 of these in severe stress. This equates to 25.4% of households, up from 24.8% last month. We also estimate that nearly 55,000 households risk default in the next 12 months. The main drivers are rising mortgage rates and living costs whilst real incomes continue to fall and underemployment is on the rise.  This is a deadly combination and is touching households across the country, not just in the mortgage belts.

We analyse household cash flow based on real incomes, outgoings and mortgage repayments. Households are “stressed” when income does not cover ongoing costs, rather than identifying a set proportion of income, (such as 30%) going on the mortgage. Stressed households are less likely to spend at the shops, which acts as a drag anchor on future growth. The number of households impacted are economically significant, especially as household debt continues to climb to new record levels.

Census data shows that Home ownership has continued to fall among younger Australians. Only 36 per cent of people aged 25-29 said they owned their home outright or with a mortgage – likely the lowest level since at least the 1960s. Home ownership for the next age group, 30-34, also declined, to 49 per cent, which is likely another record low.

Overall inequality in Australia is rising, between those who have property and those who do not. Australia has prominent examples of economic policies that disproportionately benefit the upper-middle class, such as the capital gains tax discount and superannuation tax incentives. We also have a geographically concentrated income distribution, with the rich living in neighbourhoods with other rich people. The poor are also more likely to live in close proximity to people who share their disadvantage.

There were major changes to mortgage rates and underwriting standards this week, with many following the herd by lifting rates for interest only borrowers, especially investors whilst making small downward movements in principal and interest loan rates, especially at lower LVRs.

NAB will start automatically rejecting customers who want to borrow a high multiple of their income and only pay interest on their home loan, amid concerns over the growing risks created by rising household indebtedness.     While NAB already calculates loan-to-income ratios when assessing loans, it has not previously used the metric to determine whether a customer gets a loan, and such a blanket approach is unusual in the industry.

We have maintained for some time that LTI is an important measure. It should be use more widely in Australia, as it is a better indicator of risk than LVR (especially in a rising market).

Several more banks tweaked their mortgage rates this week. Virgin Money for example increased its variable and fixed rates for new owner occupied loans for LVRs of over 90% by 35 basis points or 0.35%, and increased its standard variable rates for owner occupied and investment interest online loans by 25 basis points.

Auswide Bank announced an increase to their reference rates for investment home loans and lines of credit of 25 basis points from 11 July 2017 will result in a new standard variable rate (SVR) of 6.10%. They blamed funding pressures and regulatory limits on investment and interest only lending.

ING Direct  changed their reference rates, for owner-occupier borrowers, the principal and interest rates will decrease by 5 basis points. But for owner-occupier borrowers, interest-only rates will increase by 20 basis points and investor borrowers on interest-only loans will cop a 35 basis point rise. They are also encouraging borrowers to switch to principal and interest repayment loans.

Bendigo Bank lifted variable interest rates by 30 basis points for existing owner occupied interest only customers and 40 basis points for existing investment interest only customers. They also lifted business loans with new business interest only variable rates up by 40 to 80 basis points and fixed interest only rates increasing by 10 to 40 basis points.  On the other hand, new Business Investment P&I variable rates will decrease by 15 basis points and fixed P&I interest rates decreased by 30 basis points.

The RBA held the official cash rate at 1.5 per cent for the tenth time on Tuesday. It hasn’t moved since a 25 basis point cut in August 2016. But Analysis shows that the gap between the RBA rate and the standard rate banks quote to mortgage borrowers is around the widest in 20 years. The Banks did not pass on the full benefit of the RBA’s record-low rates in order to offset costs and prop up profits. Last year there was a massive race to the bottom in terms of discounts to try to gain volume and share. Many banks dented their margins in the process. But now they’ve now got the perfect cover, thanks to APRA’s regulatory intervention, and so we expect to see mortgage rates continuing to grind higher, particularly for investors and anyone on interest-only. This will simply lead to more mortgage stress down the track whilst the banks rebuild their profit margins. Another example of inequality.

And that’s the Property Imperative to the 8th July. Check back again next week

Housing affordability deteriorated further over the March 2017 quarter

From Core Logic.

With dwelling values rising at a faster pace than household incomes, housing affordability has worsened over the first quarter of 2017.  CoreLogic measures housing affordability across four measures and three of these four measures have seen affordability deteriorate over the quarter.

The four affordability measures that CoreLogic calculate are:

  1. Dwelling price to household income ratio – essentially how many years of gross annual household income are required to purchase a property outright
  2. Years to save a deposit – how many years of gross annual household income are required for a 20% deposit
  3. Serviceability – calculating mortgage repayments on an 80% loan to value ratio (LVR) mortgage utilising the standard variable mortgage rate and a 25 year mortgage, what proportion of gross annual household income is required to service a mortgage
  4. Dwelling rent to household income – the proportion of gross annual household income required to pay the rent

The measures we look at utilise median household incomes which have been modeled by the Australian National University (ANU).

As at March 2017, the national price to income ratio was recorded at 7.3 compared to 7.2 a year earlier, 6.4 five years earlier and 6.1 a decade ago.  Looking at houses and units, the ratios were recorded at 7.4 and 6.7 respectively at March 2017.

It would have taken 1.5 years of gross annual household income for a deposit nationally at the end of the March 2017 quarter.  This is compared to 1.4 years a year earlier, 1.3 years five years ago and 1.2 years a decade ago.  If saving for a house it would take 1.5 years of the median household income for a deposit compared to 1.3 years of income for a unit.

The calculation of the proportion of household income required to service a mortgage is very sensitive to mortgage rates.  At the end of March 2017, the discounted variable mortgage rate for owner occupiers was 4.55% and a mortgage required 38.9% of a household’s income.  A year earlier mortgage rates were 4.85% and the mortgage used 39.6% of the household income.  Five years ago, mortgage rates were 6.7% and a decade ago they were 7.45% and households required 42.2% and 42.8% of their household income respectively to service a mortgage.  Further to this you can see that the proportion of household income required to service a mortgage peaked at 51.0% in June 2008 when mortgage rates were 8.85%.  Houses currently require 39.39% of a household’s income to service a mortgage compared to units requiring 36.0%.

The final affordability measure looks at the alternative to taking out a mortgage, renting, looking at the rent to income ratio.  The rent to income ratio has been more stable compared with measures related to purchasing a home or servicing a mortgage, as it is more limited by growth in household incomes.  In March 2017, the ratio was recorded at 29.6% compared to 30.4% a year earlier, 29.1% five years earlier and 25.8% a decade ago.  At the end of March 2017 the ratio was recorded at 29.6% for houses and units.

The above table highlights each of the four housing affordability measures across the Greater Capital City Statistical Areas (GCCSA) regions as at March 2017.  Capital cities are generally more expensive across all measures than regional markets despite household incomes generally being higher in capital cities.  Sydney is the least affordable housing market across most measures.  Sydney’s price to income ratio is significantly higher than all other regions analysed.  Furthermore, the serviceability calculation shows that despite mortgage rates being at close to historic low levels, a Sydney property owner is utilising 45% of their household income to service their mortgage.

This data provides a snapshot of how housing affordability is tracking across the country, and it highlights how in Sydney and Melbourne in particular it is deteriorating as dwelling values have risen over recent years. Another important point to note is that lower mortgage rates make servicing debt easier however, it doesn’t make it easier to overcome the deposit hurdle, particularly given fairly sluggish household income growth over recent years.  The data also suggests that servicing a mortgage remains more expensive than paying for rental accommodation although the gap has narrowed as interest rates have fallen.

It is important to look at a range of housing affordability measures and analyse them over time to get a true understanding of the housing affordability challenges.  Over recent years affordability on a price to income and saving for a deposit basis has deteriorated in Sydney and Melbourne however it is relatively unchanged or slightly improved in most other capital cities.  On the other hand, as mortgage rates have fallen servicing a mortgage has required a lower proportion of household income which in turn has allowed some owners to reinvest or increase their spending elsewhere.

How to tell when the housing market is slowing

From The Conversation.

Looking at data, there is no evidence to support the notion that house prices have peaked or are on the cusp of a downward trend.

House prices in Australian capital cities rose slightly in June after falling in May. But house price indexes only show what’s happening in the market over a short time frame. Housing markets are volatile and you could just be looking at a seasonal blip.

Looking at the market fundamentals, there are no signs of a housing market slowdown. These indicators include economic and population growth, the unemployment rate, new housing construction, and auction clearance rates. They give us an idea both of the overall demand in the market, as well as the ability to pay for housing.

As economic and population growth increase, for example, there is both more money to spend as well as more people in need of housing. The rate of new housing construction tells us what will happen to housing supply, and the percentage of housing successfully sold at auctions gives us an idea of where we are in the house price cycle.

Market fundamentals and key indicators

As you can see in the chart below, economic growth has been relatively strong in both New South Wales and Victoria. Growth in Gross State Product for both states was 2.6% in 2014-15, and even stronger in 2015-16; this was higher than the GDP growth rate of Australia overall.

This suggests that the local economies of both Melbourne and Sydney are performing better than the overall Australian economy. And a strong economy feeds into more demand for housing.

The next thing to look at is the unemployment rate. A low unemployment rate means that fewer people are under pressure to sell their houses or default on their mortgages. This means the chance of sharp price correction in the housing market is lower when the unemployment rate is low.

Again, the unemployment rate in both New South Wales and Victoria is relatively low, around 4.8% in NSW and 6% in Victoria, compared with other states. Unemployment is almost 7% in South Australia, for example.

The auction clearance rate shows the percentage of housing that was successfully sold out of all the auctions that took place. The clearance rate roughly tracks housing prices – a high rate will normally be observed when house prices are high, and the reverse is also true. For example, the auction clearance rate was around 36-50% in Sydney in 2008.

Although the auction clearance rates in Melbourne and Sydney have dropped in recent months, they are still around 70%. This is comparable with the same period last year, giving no indication of a sudden movement in house prices one way or the other.

The next indicator is the proportion of vacant properties in the housing supply, also known as the vacancy rate. This is used as a gauge of whether there is too much or too little supply of housing in the market. Normally, a housing market is cooling if there are many vacant properties.

The vacancy rate has remained stable in Sydney and Melbourne recently, within a range of 1.7-2.2%. This suggests that there is little evidence of an oversupply of housing, and that housing demand is strong in both markets.

Sydney and Melbourne show signs of strong population growth. This is true not just now, but over the past 6 years. As we can see in the following graph, both cities have recorded growth rates ranging between 13,000 and 43,000 people per quarter.

The strong population growth rate reflects that the fundamental demand for housing in both cities are high. Although more new dwellings have been completed in recent years, the levels are far below population growth. This suggests that there is still more demand than supply in the housing markets in Sydney and Melbourne.

The discrepancy between May’s decline in capital city house prices, and the other indicators that show no slow down in demand, illustrate the problem. These other indicators give you a better idea of overall demand for housing, which is what drives prices over the longer term.

Based on the prices alone, it is too early to tell whether the housing markets in Sydney and Melbourne are slowing or if they are on a downward trend. And the other indicators of the wider economy show us that housing demand is strong. It is only when this changes that you will know that house prices are slowing.

Author: Chyi Lin Lee, Associate Professor of Property, Western Sydney University

Capital City Dwelling Values Rise 0.8% Over June Quarter

From CoreLogic.

The CoreLogic Home Value Index recorded a recovery from the 1.1% fall in May, with a 1.8% rise in capital city dwelling values over the month of June.  According to CoreLogic head of research Tim Lawless, “This stronger month-on-month reading can be partially explained by the seasonality in the monthly growth rates.  Adjusting for this effect suggests an easing trend in housing value growth has persisted through the second quarter of 2017.”

The June quarter results showed that capital city dwelling values were 0.8% higher across the combined capitals index; the slowest quarterly rate of growth since December 2015 when the combined capitals index fell by 1.4%.

Index results as at June 30, 2017

Mr Lawless said, “This trend towards lower capital gains across the combined capitals index is mostly attributable to softer conditions across the Sydney housing market, where quarter-on-quarter growth was recorded at 0.8% over the June quarter; down from 5.0% over the March quarter.  In contrast, the quarterly trend in Melbourne has been more resilient, with growth easing from 4.2% over the March quarter to 1.5% over the three months ending June.”

Weaker auction results are further evidence of slowing housing market conditions.

For Sydney, Mr Lawless said the more pronounced slowdown is supported by weaker auction clearance rates which have been tracking in the high 60% range across the city over the last three weeks of June, while in Melbourne, clearance rates have moderated but remained above 70%. He said, “Both markets experienced auction clearance rates consistently in the high 70% to low 80% range over the March quarter.”

Slower housing market conditions also reflected in the annual pace of capital gains.

Across the combined capitals, the annual pace of capital gains has eased from 12.9% three months ago to 9.6% at the end of June 2017.  Sydney’s annual growth rate has slowed to 12.2% over the twelve months ending June 2017, down from a recent high of 18.9% three months ago.  Melbourne’s annual growth rate is now the highest of any capital city, surpassing Sydney’s annual rate of growth despite easing from 15.9% three months ago, to 13.7% over the twelve months ending June 2017.

Outside of Sydney and Melbourne, housing market conditions remain diverse.

Brisbane now has the third highest quarterly pace of capital gains with dwelling values 0.5% higher over the June quarter.  Brisbane’s growth is entirely attributable to a 0.8% rise in house values which offset a 2.4% fall in unit values over the quarter.  Dwelling values slipped lower across the remaining capital cities, except Perth, which posted virtually flat growth conditions (+0.1%) over the June quarter.

The Problem With High Household Debt

The Bank for International Settlements has published their 87th Annual Report, to March 2017.  They say there are encouraging signs of economic recovery, but point to risks from high household debt and over-reliance on monetary policy.  They call for a rebalancing of policy towards structural reform.

They underscore the risks which result from over investment in housing, and excessive credit and make the point that in Australia, Canada, Sweden and Switzerland, household debt rose by 2–3 percentage points in 2016, to 86–128% of GDP. True growth comes from productive economic investment, not ever more housing debt, which becomes a real problem should interest rates rise.

They say that high levels of debt servicing will have a dampening impact on future economic growth.

It is well recognised that household borrowing is an important aspect of financial inclusion and can play useful economic roles, including smoothing consumption over time. At the same time, rapid household credit growth has featured prominently in financial cycle booms and busts. For one, household debt – or debt more generally – outpacing GDP growth over prolonged periods is a robust early warning indicator of financial stress.

The adverse effects of excessive credit growth can also be magnified by the economy’s supply side response. For example, banks’ stronger willingness to extend mortgages may feed an unsustainable housing boom and overinvestment in the construction sector, which may crowd out investment opportunities in higher-productivity sectors. Credit booms tend to go hand in hand with a misallocation of resources – most notably towards the construction sector – and a slowdown in productivity growth, with long-lasting adverse effects on the real economy.

Additional risks to consumption arise from elevated levels of household debt, in particular given the prospect of higher interest rates. Recent evidence from a sample of advanced economies suggests that increasing household debt in relation to GDP has boosted consumption in the short term, but this has tended to be followed by sub-par medium-term macroeconomic performance.

It is possible to assess the effect of higher interest rates on debt service burdens through illustrative simulations. These capture the dynamic relationships between the two components of the DSR (the credit-to-income ratio and the nominal interest rate on debt), real residential property prices, real GDP and the three month money market interest rate. Crisis-hit countries, where households have deleveraged post-crisis, appear relatively resilient to rising interest rates. In most cases  considered, debt service burdens remain close to long-run averages even in a scenario in which short-term interest rates increase rapidly to end-2007 levels. By contrast, in countries that experienced rapid rises in household debt over recent years, DSRs are already above their historical average and would be pushed up further by higher interest rates.

The shift to solitary living is massively inflating property prices

From The New Daily.

Australians increasingly choose to live alone, and this huge demographic shift is going to push up prices and sprawl our cities further into the fringe unless we accept higher density living.

According to the Victorian government, by 2025 up to 51 per cent of Melbourne households will be ‘no child households’.

‘No child households’ are those that are pre-child, post-child or have no intention of ever having children.

The numbers are similar for all of Australia’s major cities, although slightly lower in Sydney as it attracts a slightly higher percentage of families.

Worst still, the fastest growing segment of the Australian housing market is the single person household. Single person households may reach 44 per cent of all major city households by 2035.

What does this mean for communities and for housing prices?

According to the Grattan Institute, 84 per cent of Melbourne’s housing stock is made up of detached or semi-detached family homes. Only 16 per cent of the housing stock is aimed at non-family residences.

By 2025, 51 per cent of our population could be in non-family units with only 16 per cent of our housing stock aimed at this demographic.

There will be a shortage of non-family medium and higher density living with people forced to bid for family homes leaving bedrooms empty. Fewer people will live in each housing unit, putting massive upward pressure on housing prices.

As the average number of people per household shrinks we will need more residences for the same amount of population. If we do not radically increase density then these new houses will continue to be built on our urban-fringed farm land.

It is not just me calling for a re-think on planning demographics. Reserve Bank governor Philip Lowe, speaking in Brisbane earlier this year, identified “the choices we have made as a society regarding where and how we live … urban planning and transport” as significant impacting factors on property prices.

Property, like all markets, is impacted by changes to both supply and demand. While demand can be impacted by a range of economic factors, supply is restricted by planning rules and the availability of land, as well as economic factors.

Some people think all will be okay with housing supply as they think Australia’s housing density has increased. But this is not true. Whilst the last decade has seen an uptick in density, a longer-term view tells a very different story.

Inner city suburbs, prior to ‘gentrification’, used to house one, two and sometimes three families per house. Now days the inner city houses often have just one, two or three people.

Melbourne, for example, has seen a huge drop in its density from 20.3 people per hectare in 1960 to around 14.9 people per hectare today.

This change in demographics means that, even if our population stays the same, our cities don’t grow ‘up’ then they must grow ‘out’.

This decreasing density is eating up farmland on the urban fringe and putting huge strain on infrastructure spending as the cost per person per kilometre of infrastructure sky rockets.

It is dangerous and will continue even if the population remained exactly the same – let alone if we continue to grow our it.

As single person households age and get ill, will we see more horror stories of people falling ill or dying at home and remaining undiscovered for days or weeks as ‘friends’ wonder why they have not been online?

With decreasing family sizes, growing numbers of childless households and growing numbers of single person households, our housing supply is becoming more out of sync with our housing demand.

The result will be increased pressure on housing prices.

Sydney and Melbourne property prices look set to fall

From Business Insider.

Sydney house prices have another year or so of rises before the bubble shrinks.

Median housing prices in Sydney are overvalued by 14% and in Melbourne by 8%, but will decline gradually rather than sharply over the next few years, according to analysis by KPMG Economics predicts.

Sydney median prices are forecast to peak at $980,000 in 2019, up from $880,000 from June 2016, and then gradually roll back to between $930,000 and $950,000 by the end of the 2021 financial year.

However, Melbourne prices are expected to peak next year, pause for year or two, and then start to grow again.

The median prices in Melbourne are expected to rise to between $720,000 to $740,000, from about $650,000 in 2016, by the end of 2019. After plateauing, they will then regain momentum to be between $775,000 and $825,000 by the end of 2021.

“Our forecasts show Sydney will experience a greater adjustment than Melbourne in the next few years, but this is likely to be gradual rather than a collapse in the median dwelling price,” says Brendan Rynne, KPMG chief economist.

“Whether or not the current Sydney and Melbourne housing prices constitute a ‘bubble’ is a matter for debate, but we estimate that short-term factors have pushed median dwelling prices above their long-term ‘equilibrium’ prices by about 14% and 8% respectively.

“But it should be remembered that this has happened before in Australia and prices have returned to equilibrium without the sort of crash we have returned to equilibrium without the sort of crash we have seen in other countries after the GFC.

“We expect the same again to happen here now. We anticipate a cooling in price growth, and from next year prices will start to gradually come down. While prices are high now, they are still within known boundaries by historic standards.”

Here’s how KPMG sees Sydney and Melbourne house prices moving:

Source: KPMG

KPMG’s report, Housing affordability: What is driving house prices in Sydney and Melbourne?, argues that Sydney house prices have become more volatile since the GFC even though there has not been the same volatility in supply, demand and costs.

It also finds there is a long-term relationship between house prices and variables including working population levels, stock of dwellings, rate of borrowing by property investors, and the adoption of stronger prudential controls by the regulator APRA.

The banks have been winding back their interest only offerings favoured by property investors, increasing rates, while offering better deals on principal and interest mortgages.

Anecdotal evidence suggests demand by Chinese investors for Australian residential property may have softened in recent months due a combination of factors, including the adoption of differential stamp duty in some states, and vacant property taxes for foreign buyers.

“Investors both here and overseas have been the key driver behind the housing price boom and policymakers are now addressing this,” says Rynne.

Moody’s Cuts Aussie Bank Ratings Due To “Tail Risk” Concerns

From Zero Hedge.

Back in 2007, the ratings agencies were so woefully behind the eight ball in understanding and reporting the credit risks in the U.S. financial system that it was nearly impossible to tell from day to day whether they were really just that incompetent or if they were complicit in the biggest financial fraud in history.  Regardless of which you believe is more likely, they seem intent upon not making the same mistake again…at least not in Australia.

As The Sydney Morning Herald points out today, Moody’s has cut the long-term credit rating of Australia’s four biggest banks after pointing to surging home prices, rising household debt and sluggish wage growth as potential threats to the financial industry down under.  Australia & New Zealand Banking Group Ltd., Commonwealth Bank of Australia, National Australia Bank Ltd. and Westpac Banking Corp. were all downgraded to Aa3 from Aa2, Moody’s said in a statement released earlier today. Per The Sydney Morning Herald

“In Moody’s view, elevated risks within the household sector heighten the sensitivity of Australian banks’ credit profiles to an adverse shock, notwithstanding improvements in their capital and liquidity in recent years,” the statement said.

“In Moody’s assessment, risks associated with the housing market have risen sharply in recent years. Latent risks in the housing market have been rising in recent years, because significant house price appreciation in the core housing markets of Sydney and Melbourne has led to very high and rising household indebtedness,” the statement said.

“The rise in household indebtedness comes against the backdrop of low wage growth and structural changes in the labour market, which have led to rising levels of underemployment”.

“Whilst mortgage affordability for most borrowers remains good at current interest rates, the reduction in the savings rate, the rise in household leverage and the rising prevalence of interest-only and investment loans are all indicators of rising risks.”

Of course, as we’ve pointed out multiple times before, the Chinese money laundering operation…sorry, we meant Sydney “housing market”…puts the previous U.S. housing bubble to shame.

Of course, all of the banks that are now being downgraded are the same ones that assured us just a couple of months ago that Australian home prices were not in a “speculative bubble.” Testifying before a parliamentary committee, the chief executives of National Australia Bank, Westpac Banking and Commonwealth Bank of Australia all said that while they were worried about elements of the housing market, prices weren’t over-inflated.  Per Bloomberg

“I would draw the distinction between a speculative bubble in prices and prices beyond what fundamentals would justify,”Westpac’s Brian Hartzer told the committee in Canberra Wednesday. A bubble isn’t occurring in Sydney or Melbourne, where house prices have risen the most, he said.

“There are increasing risks, but I still believe the answer is no,” National Australia Bank’s Andrew Thorburn said when asked if houses in Sydney and Melbourne are overpriced.

Commonwealth Bank, the nation’s largest mortgage lender, is “lending at levels we are comfortable with” across Australia, Chief Executive Officer Ian Narev told the committee when he testified Tuesday.

Meanwhile, the ever-important “crane-index” helps to put some perspective around just how ‘bubbly’ the Australia market has become.

Australia

Of course, maybe Australia’s bankers are right and bubbly home prices are just the result of strong fundamentals.  Although, the last time a prominent banker made a similar prediction in the U.S. he turned out to be just a bit off the mark.  Ben Bernanke (July 2005):

“Well, unquestionably, housing prices are up quite a bit; I think it’s important to note that fundamentals are also very strong. We’ve got a growing economy, jobs, incomes. We’ve got very low mortgage rates. We’ve got demographics supporting housing growth. We’ve got restricted supply in some places. So it’s certainly understandable that prices would go up some. I don’t know whether prices are exactly where they should be, but I think it’s fair to say that much of what’s happened is supported by the strength of the economy.”

Oops!

Residential property prices rise 2.2 per cent

Residential property prices rose 2.2 per cent in the March quarter 2017, the fourth consecutive quarter of growth, according to figures released today by the Australian Bureau of Statistics (ABS).

Program Manager for Prices Branch, Marcel van Kints, said; “While residential property prices rose in most capital cities this quarter, Sydney and Melbourne continue to drive the national result.”

The price rises in Sydney (3.0 per cent) and Melbourne (3.1 per cent) were partially offset by falls in Perth (1.0 per cent) and Darwin (0.9 per cent).

Through the year growth in residential property prices reached 10.2 per cent in the March quarter 2017. Sydney recorded the largest through the year growth of all capital cities at 14.4 per cent, followed closely by Melbourne at 13.4 per cent.

The total value of Australia’s 9.9 million residential dwellings increased $163.1 billion to $6.6 trillion. The mean price of dwellings in Australia is now $669,700.

This ongoing rise may go counter to some recent data, although we note the CoreLogic data this week also shows rises in most centres, after recent softer data.

But of course the ABS data is prior to the recent regulatory interventions. As the HIA puts it:

“There is evidence that since March 2017 dwelling price growth has slowed following the introduction of additional restrictions by APRA and increased barriers to foreign investor participation imposed at federal and state level”.

So the next ABS series, due out in 3 months will be the one to watch.  Why do we need to wait so long for this data? The ABS is very slow to generate this particular series.


Auction Results 17 June 2017

The preliminary auction results for 17 June 2017 from Domain, show a national clearance rate of 71.3% with 1,041 sold, up from last week which was a long weekend, but lower than this time last year.

Sydney cleared 69.6% with 418 sold, compared with 72.2% with 654 sold this time last year. In Melbourne, 75.3% cleared with 549 sold compared with 69.2% with 654 sold this time last year. So some easing is visible.

Brisbane cleared 44% of 97 listed, Adelaide 80% of 72 listed and Canberra 55% of 53 listed.