Rates on hold, but housing affordability remains ‘hotly debated’

From The Real Estate Conversation.

The Reserve Bank has left interest rates at historic lows as economic conditions improve, but the property industry says other measures are required to improve housing affordability.

The Reserve Bank of Australia left interest rates on hold at its first meeting of 2017, with rates held at a record low of 1.50 per cent.

Governor Philip Lowe noted in his statement that growth in China was stronger in the second half of 2016, that global business and consumer confidence is improving, and that global inflation is rising. He also said recent rises in commodity prices are increasing Australia’s national income.

Lowe said the RBA expects Australian economic growth in the final quarter of 2016 to firm, and re-affirmed the RBA is forecasting growth to pick up to “around 3% over the next couple years”. Lowe said Australian inflation is heading back towards the target range.

In his November 2016 statement, Lowe said cutting rates further may not be in the “public interest” if it further increased household debt.

Real Estate Institute of New South Wales President John Cunningham said the central bank’s decision was no surprise, but said he expects housing affordability to be “hotly debated” this year.

“An emphasis will again be placed on first homebuyers and there will be much debate this year on ways to improve their plight,” he said.

“A review of stamp duty is urgently required and should focus on first homebuyers and older Australians,” said Cunningham.

The RBA cut interest rates twice in 2016, first in May and then in August. However, banks are independently increasing interest rates for investors as increased global economic uncertainty raises their borrowing costs.

Laing+Simmons managing director and REINSW president-elect Leanne Pilkington echoed Cunningham’s sentiment, saying rate cuts are not the answer to improving housing affordability. Further rate cuts are not required in the current housing cycle, she said.

“Obtaining housing finance at attractive terms is already possible for those with the means,” said Pilkington.

“It’s those without the means – stuck in the rental cycle or unable to accumulate a suitable deposit – that face the greatest challenge in the market,” Pilkington said.

“Further rate cuts are not a solution to the problem. Between government and the industry, we need to table some alternative solutions to help people buy their first home,” she said.

“From a housing industry perspective,” said Pilkington, “rates are already low and have been for some time, so that piece of the affordability puzzle is in place.”

Like Cunningham, Pilkington believes changes to stamp duty are necessary to address housing affordability problems. “It’s through other avenues like stamp duty reform that improvements in affordability need to be addressed,” she said.

Pilkington also said making downsizing more viable for older Australians, introducing a Government-backed savings scheme to help people save for a deposit, and minimising the cost of mortgage insurance could all alleviate housing affordability problems in Australia.

The Property Council of Australia welcomed the statement by Lowe on interest rates, saying it was a sober assessment of housing markets.

The governor’s statement said “conditions in the housing market vary considerably around the country”.

Ken Morrison, chief executive of the Property Council of Australia, said the statement confirms the current situation of “prudent lending practices and the best environment for renters in a generation with consistent low rental growth.”

“The deterioration in housing affordability is a serious problem in a number of our major cities, but is not an Australia-wide problem,” said Morrison.

1300 HomeLoan managing director John Kolenda said the RBA will remain on the sidelines until uncertainty about the economic impact of US president Trump becomes clearer.

“The RBA will stay on the sidelines and assess the impact on the global economy although our domestic economy appears stable with no need to adjust interest rates,” said Kolenda.

Kolenda said while the RBA’s cash rate is unlikely to change in the short term, confusion could arise from varying mortgage rates, and reinforced his recommendation to use a mortgage broker.

The Deadly Embrace Of Housing

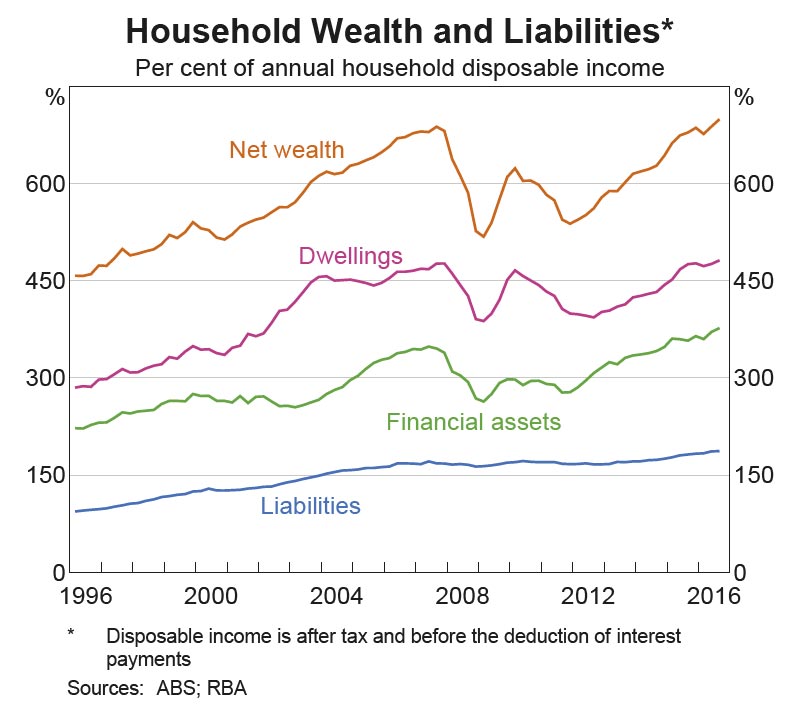
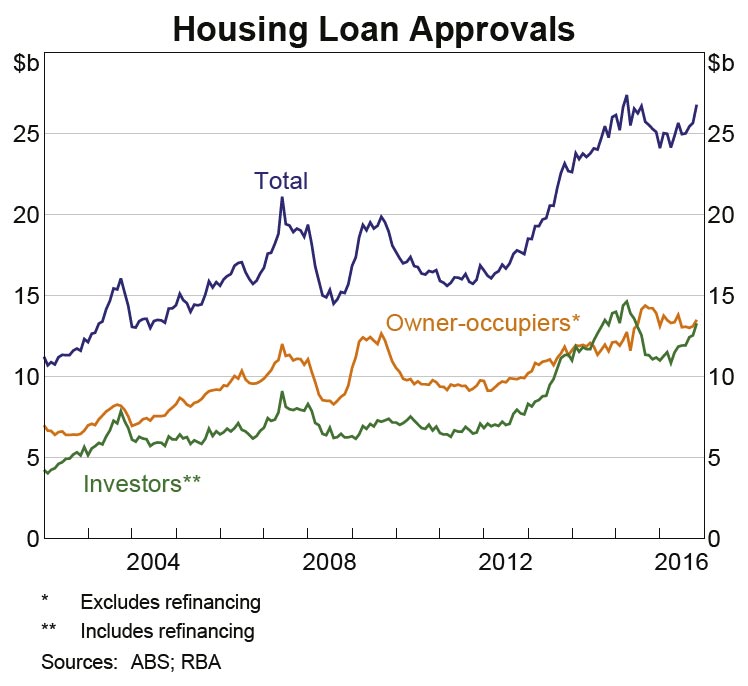
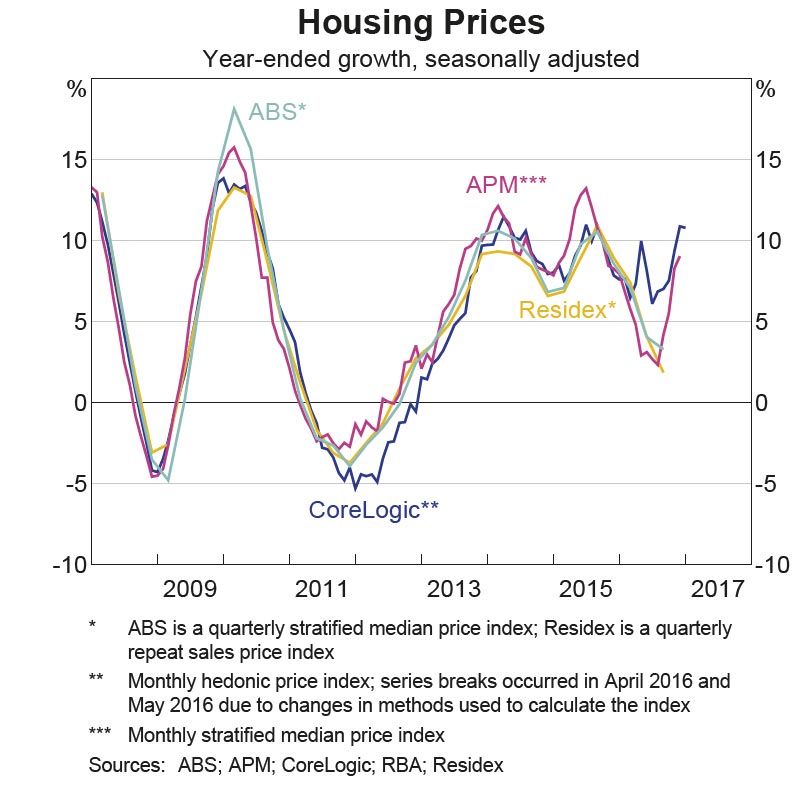
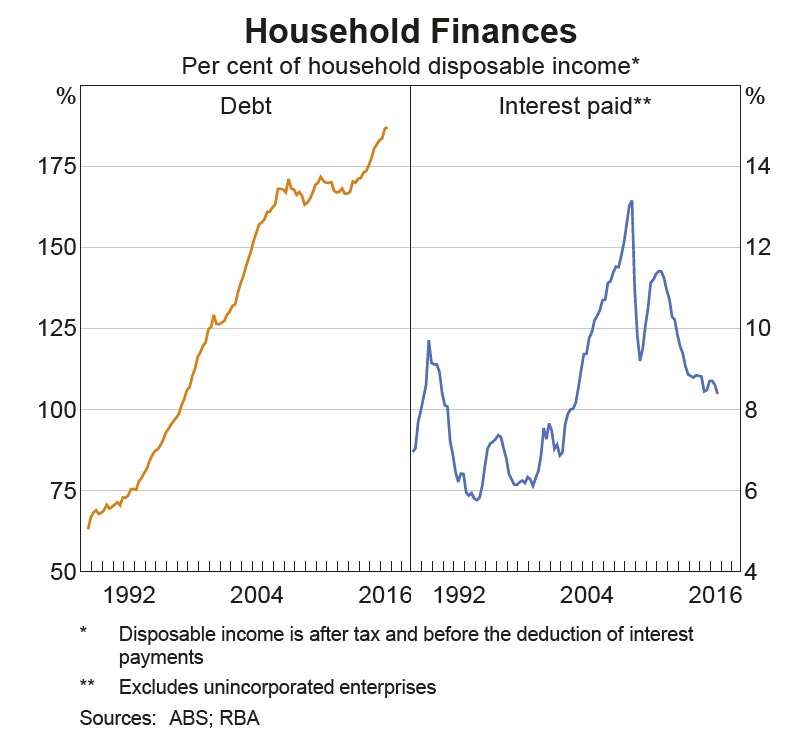
The latest RBA Chart pack, out today, with data to early February 2017 really highlights the critical role housing plays in household finances. If the home price growth music were to stop, things would get tricky.

Overall net wealth continues to lift, supported by rising dwelling prices, (and fully priced financial assets).

Everyone seems to benefit from high home prices.

Investment loan flow is now as large as owner occupied flow, as investors continue to bet on housing for future growth, in a low interest rate environment.

House prices continue to rise following slower growth earlier in the year.

Household debt continues to grow, whilst ultra-low interest rates make interest repayments manageable – though of course there are mortgage rate rises in the works.


Is Local Unemployment Related to Local Housing Prices?

From The St. Louis FED.

The U.S. national labor market has recovered from the effects of the 2007-2009 recession; however despite the national labor market recovery, significant regional variation remains. Recent economic research highlights links between regional labor and housing markets. In their article, “ The Recent Evolution of Local U.S. Labor Markets, ” Authors Maximiliano Dvorkin and Hannah Shell examined the recession and recovery by reviewing the correlation between county-level unemployment rates and changes in housing prices.

National unemployment reached a pre-recession low in December 2007; by October 2009 the unemployment rate in most counties increased between 4 and 20 percentage points. The authors found that areas with higher unemployment rates before the recession experienced larger increases in unemployment during the recession, and those areas with lower unemployment rates before the recession experienced smaller upticks in unemployment during the recession.

The authors theorized that one reason for the disparity in unemployment rate increases could be related to the housing supply. Specifically, the unemployment rates in Arizona, New Mexico, Nevada and Utah remained above their pre-recession levels; these are also areas where housing prices dropped significantly.

When they examined the percent change in county house prices with the change in the county unemployment rate, the results showed a strong negative correlation, meaning that counties with larger decreases in housing prices experienced larger increases in the unemployment rate, perhaps because larger house price declines during downturns are leading to larger declines in local consumption spending that further depress the local economy.

Since 2008 only four capital cities have recorded real growth in home values

More nice, if sobering analysis from CoreLogic.

With the Australian Bureau of Statistics releasing the Consumer Price Index for the December 2016 quarter recently, using the CoreLogic Home Value Index we can adjust changes in dwelling values for the effects of inflation.  The value of looking at inflation-adjusted or ‘real’ home value changes is that it highlights whether housing values are moving higher or lower relative to other costs across the economy.

Combined capital city dwelling values increased by 10.9% throughout 2016 while headline inflation increased by a much lower 1.5%.   When adjusted for inflation, value growth is lower across all cities (as you’d expect) with values having fallen over the year in both Perth and Darwin.

In 2008 home values fell by 6.1% between the end of the March and December quarters.  In real terms, capital city dwelling values fell by a larger -8.3% over the same period.  Both in nominal and real terms values started to rise once again from the end of 2008.  This recovery in growth was fueled by generous grants to first home buyers and the stimulus of extremely low interest rates.  Over the eight years from December 2008 to December 2016 only Sydney and Melbourne have recorded real dwelling value growth in excess of 12%.  Outside of Sydney and Melbourne, Darwin (2.6%) and Canberra (11.7%) are the only two cities that have recorded a real increase in values.  In Brisbane (-2.3%), Adelaide (-2.6%), Perth (-9.0%) and Hobart (-8.6%) real home values are lower than they were eight years ago.

The chart above shows the real change in individual capital city home values from their previous market peak.  The chart shows that in only Sydney and Melbourne are real values above their previous peak.  In Sydney, values are 37.8% higher than their March 2004 previous peak.  Real Melbourne home values are 19.4% higher than their September 2010 peak.  In Brisbane, real home values peaked over the March 2008 quarter and at the end of 2016 they were still 9.1% lower than they were at that time.  Adelaide home values were 5.3% lower in December 2016 than they were at the time of their real value peak in June 2010.  Perth home values peaked in real terms all the way back in September 2007 and at the end of 2016 they were still -18.5% lower in real terms.  Real dwelling values peaked in December 2007 in Hobart and at the end of 2016 were still -14.3% lower.  Following their peak over the September 2010 quarter, Darwin dwelling values are currently -19.8% lower in real terms.  Finally in Canberra, real dwelling values are -1.4% lower than their June 2010 peak.

Although most people tend to not look at the world in inflation-adjusted terms, it is important to consider housing costs from this aspect from time-to-time.  It highlights that although the cost of housing at times escalates quickly (particularly so in Sydney and Melbourne at the moment) in real terms the growth may not be substantial. It is undeniable that Sydney home values have risen rapidly over recent years however, consider that since their previous March 2004 peak, they have only increased at a rate of 2.5%pa.  This is largely due to the fact that values fell in real terms between March 2004 and March 2014.

With inflation remaining low and values continue to rise we would anticipate that in real terms values are likely to continue to rise across most of the capital cities throughout 2017

What interest rates will mean for your mortgage choices

From The Conversation.

For many of us, our home is the single most important investment we will make in our lifetime and mortgage payments can take up a huge chunk of our income. As politics and economics seem to deliver nothing but uncertainty, how should home owners or first-time buyers react?

Things still look tight for household budgets. One recent survey showed that the average mortgage payment for a three bedroom house in the UK is about £965 per month, more than half the average take-home wage.

That is with interest rates at historic lows. And they are staying put. The nine members of the Bank of England’s Monetary Policy Committee have decided to keep the official interest rate in the UK, the Base Rate, at that ultra low level of 0.25%.

The fortified walls of the Bank of England on Threadneedle Street. Robert King/Flickr, CC BY

In various guises, this rate has been around since 1694. It is the rate at which high-street banks borrow from the central bank and its function in the economy is simple but effective. If banks can borrow money cheaply from the Bank of England then they tend to pass it on cheaply to us, the public. When their borrowing gets expensive, so does ours.

The Base Rate is only an overnight interest rate but it starts a domino effect with more long-term interest rates. If it is raised then the whole economy is soon paying more to borrow money.

But if that’s not happening now, what about when the MPC meets again on March 16?

Up, up and away

Let’s start with the bad news for those paying a mortgage or seeking one. Interest rates, and consequently our payments, will definitely increase in the future. The graph below shows the history of the Base Rate since 1970. With a historical average of more than 6% and years when the Base Rate stayed consistently over 12% to combat the spiralling inflation of the time, it becomes evident that a rate of 0.25% is abnormally low.

Bank of England, Author provided

The good news for home owners and house hunters is that interest rates could well stay low for a few more years. And all the signs are that when rates do rise, it will be in small increments of 0.25% or 0.50% every few months. A key aim of the Bank of England is not to surprise markets and to be as predictable as possible, particularly at a time when stability and certainty are rare commodities.

Most people will remember why we ended up with such low rates. In the response to the global financial crisis of 2008, central banks sought to make it cheaper for people to borrow money. A low interest rate makes it easier for consumers to afford not just mortgages but also cars, appliances or nights at the pub. Companies profit from our spending and get access to cheap money that helps them expand or stay afloat.

Debt as a driver. Thomas Hawk/Flickr, CC BY-NC

So, if they are so good for the economy, why do interest rates have to go up again? Mainstream economic theory views very low interest rates as harmful in the longer-term. They are a disincentive to healthy saving rates and when the economy is at full-throttle, they act as a boost to inflation which in turn erodes people’s real incomes. They also distort investment decisions and, particularly dangerously for the UK, add fuel to investment bubbles.

Market forces

Brexit and the rise of Donald Trump in the US, the two great causes of uncertainty these days, will probably save us some money, at least in the short to medium term. Brexit brings with it the prospect that businesses will lose full access to an EU market of 450m affluent Europeans. In a climate like this, it would be a foolhardy Bank of England which chose to make money more expensive in the UK.

Trump, meanwhile, is known to favour a cheap dollar and low interest rates in the US in an effort to make exports more competitive. The Bank of England, as ever, will keep a close eye on its US counterpart, and will likely avoid increasing UK interest rates for fear of pushing the pound higher and blocking out much needed investment from the US.

So how can you use this information?

First of all, I’d avoid taking a mortgage or any loan that I could only barely afford as rates will eventually rise. For those that already have a mortgage, most commentary on the real-estate market will advocate for a fixed-term mortgage but that is not necessarily a good idea. The most popular fixed-term products offered by high street banks are usually for a period of two years.

The trouble here is that you will normally pay a fee and a higher interest rate as the cost for fixing, during which time rates are unlikely to rise anyway. And so only fixed mortgages of five years or more start making sense – and you would still pay fees and a relatively higher interest rate for a couple of years before you started to benefit.

A good idea would be to make small but regular overpayments into your mortgage, and request that these payments are used to reduce your monthly instalments (rather than to bring closer the year that the loan will be repaid in full). So when the interest rate does increase in the future, the outstanding amount it will apply to will be reduced. Flexible mortgages typically accept unlimited overpayments and even the fixed deals usually allow overpayments of up to 10% each year.

Banks are not particularly happy with the overpayment approach. It reduces their profits and de-stabilises their portfolio a little. But reluctant banks are usually a sign that this might just be a good deal for you.

Over 300,000 Borrowing Households Have Little Or No Housing Equity

According to Roy Morgan, whilst there was a decline in mortgage holders with no real equity in their homes, over 300,000 still at risk. The results show why house prices are important, and why any fall is a problem.

In the 12 months to October 2016, the latest Roy Morgan Research data has identified 6.9% (302,000) of Australian mortgage holders as having little or no real equity in their home. This is based on the fact that the value of their home is only equal to or less than the amount they still owe, placing them at considerable risk if they have to sell or prices decline. Although this is an improvement on the same time in2015 (345,000), it remains a major concern.

Apart from the ability to keep up with mortgage repayments (ie mortgage stress), another critical factor in assessing financial risk for mortgage holders and banks is to compare the value of their property with the amount outstanding on their loan. The purpose of this is to establish the level of equity (if any) that householders have in their home as this generally accounts for the major component of their assets.

Mortgage holders in WA and SA at increased risk

As of October 2016, 10.4% of mortgage holders in WA (54,000) had little or no equity in their home, the highest in Australia and 2.1% points higher than the same period in 2015. SA was the only other state to show a worsening result over the last 12 months, up by 1.8% points to 8.0% (27,000).

Value of home is less or equal to amount owing

Source: Roy Morgan Research Single Source: Mortgage holders 12 months to October 2015 (n=11,249); 12 months to October 2016 (n=10,655).
Of all the states and two largest cities included in this analysis, Sydney has the lowest proportion of mortgage holders with little or no equity in their home: just 3.9% (33,000), down 1.1% points in the last year. This improvement is due to home prices increasing faster than in most other areas of Australia and outpacing the growth in the average amount owing on mortgages. Tasmania is the second-best performer with 4.7% (5,000) of mortgage holders facing equity risk, followed by NSW with 5.1% (73,000), Victoria with 6.0% (65,000), Melbourne with 6.1% (50,000) and Queensland with 7.2% (63,000).

Mortgage gearing or risk lowest in Sydney and Melbourne

The average loan outstanding as a proportion of the average home value (the loan-to-value ratio or LVR) is an important market metric when assessing overall risk in the mortgage market.

The lowest overall mortgage gearing is in Sydney (28.9%) and Melbourne (32.4%), due mainly to the very rapid growth in average property values.

Average home-loan balance as proportion of average home value


Source: Roy Morgan Research Single Source: Mortgage holders 12 months to October 2015 (n=11,249); 12 months to October 2016 (n=10,655).

All states other than Victoria and NSW have much higher gearing levels due to negative or marginal increases in property prices. The worst performer is Queensland with a LVR of 44.0%, followed by SA and Tasmania (both on 42.3%) and WA (41.4%).

Lower-value homes face more equity risk in all states

The mortgage holders with little or no equity in their homes have much lower average house values ($457,000) compared to all mortgage holders ($688,000).

Mortgage holders with home value less or equal to amount owing vs all mortgage holders

Source: Roy Morgan Research Single Source; Mortgage holders 12 months to October 2016 (n=10,655).
Across all states and the two major cities, the value of homes owned by mortgage holders is much higher than the value of homes owned by mortgage holders with no real equity in their home. In Sydney for example, the average value of homes with a mortgage is $1.1m, compared to the much lower average of $762,000 for mortgage holders with no real equity. In Melbourne the figures are $795,000 for the average value of a home with a mortgage, well above the $523,000 for those with no equity in their home.

Norman Morris, Industry Communications Director, Roy Morgan Research says:

“Despite some improvement over the last twelve months, there are still over 300,000 home borrowers who have no real equity in their homes. This represents a considerable risk to these households and their banks, particularly if home values fall or households are hit by unemployment. With some early signs that home loan rates are rising, the problem is likely to worsen as repayments increase and home values may decline, which has the potential to lower equity levels even further.

“Due to the strong growth in house prices in Sydney and Melbourne over recent years, mortgage holders in those areas have high levels of equity but are still dependent on a strong labour market and low interest rates to maintain their strong position.

“There are a number of potential reasons that some borrowers are not gaining equity in their homes despite a generally strong property market. These include being in areas with declining values, apartments in Sydney and Melbourne losing value, borrowing more than the real value of the property, falling behind in mortgage payments, and increased borrowing for renovations that haven’t been reflected in increased property values.

“The slowdown in WA’s mining sector is seeing the highest proportion of mortgage holders faced with little or no equity in their homes, and this position has deteriorated further over the last twelve months.

“It is clear that borrowers in lower-value homes are among the most likely to be faced with the problem of low equity levels. Higher-value properties with a mortgage appear to be in a much less risky position because they are likely to have had their loan longer and may have had a far larger deposit, particularly if they traded up.

“Although the majority of Australians with a mortgage have considerable equity in their home, there is always speculation that the rapid growth in house prices must soon come to an end and when it does, so will the growth in home equity”.

Social Impact Investing

The Treasury has release a discussion paper to explore ways the Australian Government can develop the social impact investing market. It is potentially linked to the question of housing affordability.

The Treasurer’s media release said:

There are currently over 180,000 people on social housing wait lists across Australia. The number of social housing dwellings would need to grow by almost 50 per cent in order to accommodate this number of people.

We need to create an investment environment to make a meaningful increase to the available stock of affordable housing, one where the involvement of private investment can contribute to increasing supply as demand grows.

One of the challenges faced by all countries developing affordable housing is access to longer-term, low-cost finance. Access to capital is a critical issue for the affordable housing sector and the ability to leverage private sector investment is required to boost the supply of affordable housing.

While in the UK, I am meeting with leading institutions and entities that have been developing more innovative forms of investment. This includes institutions involved with the £1 billion “build to rent” policy that leverages public spending to encourage large private investors into providing more affordable housing.

This week, I visited the Lendlease Elephant Park site in London, UK. The visit provided an opportunity to view first-hand the affordable housing being offered by the project.

The UK Government has been successfully implementing innovative forms of finance to provide additional sources of funding for social infrastructure, including affordable housing.

The Elephant Park project in London offers 25 per cent affordable housing. Half of the 550 affordable homes will be available as a mix of affordable and social rent, with the other half available under shared ownership. The L&Q Group will take ownership and manage the affordable housing to be built at Elephant Park by Lendlease.

Housing affordability is an important issue for Australia. The Turnbull Government is continually looking at ways to improve supply in the area of affordable housing.

At present, the Commonwealth and state and territory governments combined are spending over $10 billion a year on housing, but it is failing to improve outcomes, particularly for those with low-moderate incomes.

The discussion paper proposes that the Australian Government could primarily support social impact investing by creating an enabling environment for private sector-led social impact investing and by funding (or co-funding with State and Territory Governments) investments which generate savings or avoided future costs to fund reforms and deliver better outcomes for Australians.

Taking a social impact investment approach provides the Australian Government with an opportunity to fund ‘what works’ and reinvest spending that would otherwise not achieve beneficial outcomes.

In many policy areas relevant to social impact investing, the Australian Government is a funder or regulator. For example, the Australian Government has funded social impact investments in the Indo-Pacific region as part of a move towards innovative financing across the whole Australian aid program. The Australian Government is also responsible for financial market regulation, including the regulatory settings that affect social impact investing.

State and Territory Governments are leading on social impact investing, consistent with their responsibility for the delivery of many services which could be delivered through social impact investing, including justice, homelessness and out of home care services. The discussion paper also seeks views on areas where the Australian Government has direct policy responsibility.

The Australian Government could form partnerships with other levels of government to develop social impact investments. Such partnerships could involve sharing data critical to determining the outcomes of interventions. The split of roles and responsibilities between the Commonwealth, State and Territory and local governments shapes the role each level of government could effectively play in developing the social impact investing market.

Two reports have recommended the Government consider moving towards a social impact investment model for funding some social services. The 2015 review of Australia’s welfare system, A New System for Better Employment and Social Outcomes (known as the McClure Report), recommended that the Government consider expanding outcomes based social impact investment models to target financial investments towards addressing social problems.

In 2014, the final report of the Financial System Inquiry recommended that the Australian Government ‘explore ways to facilitate development of the impact investment market and encourage innovation in funding social service delivery’. As part of the Australian Government’s response to the Financial System Inquiry, the Australian Government agreed to prepare a discussion paper to explore ways to facilitate the development of the social impact investment market in Australia.

Social impact investments are investments made with the intention of generating measurable social and/or environmental outcomes in addition to a financial return. Social impact investing is an emerging, outcomes based approach that brings together governments, service providers, investors and communities to tackle a range of social issues.

This discussion paper seeks comments on issues that are relevant to the role of the Australian Government in developing the social impact investing market in Australia.

This discussion paper invites consultation on the Australian Government’s role in developing the social impact investing market. We encourage participants from the community, charitable and private sectors, State and Territory Governments and the public to consider the issues set out in this paper and make a submission.

There are three key components for consultation in this discussion paper:

1. The role the Australian Government should play in the social impact investing market. This discussion paper proposes that the Australian Government could primarily support social impact investing by (i) creating an enabling environment and (ii) by funding (or co-funding with State and Territory Governments) investments which would likely achieve savings to fund the intervention and deliver better outcomes for Australians.

2. The principles for social impact investing have been developed by looking internationally and at the State and Territory level to identify the key principles for effective social impact investments. The principles have also been informed by the Australian Government’s experience in this field to date and consultation with stakeholders. We seek feedback on these principles from interested parties before they are finalised. Once the consultation closes, we will create a revised version of the principles that takes into account submissions.

3. This discussion paper also outlines potential regulatory barriers to the growth of the social impact investment market identified by stakeholders and research on the sector. It seeks views on potential ways that the Australian Government can act to address these barriers, with the aim of facilitating social impact investing.

The submission is open until 27 February 2017.

Housing Affordability Takes Another Dive

The latest Housing Industry Association (HIA) Affordability Report shows how further gains in dwelling prices have caused housing affordability to deteriorate sharply during the December 2016 quarter.

Affordability worsened in six of the eight capital cities during the December 2016 quarter. The biggest deterioration was in Melbourne (-11.6 per cent), followed by Canberra (-10.7 per cent) and Sydney (-7.3 per cent). Affordability has also become more difficult in Darwin (-3.8 per cent), Brisbane (-2.9 per cent) and Adelaide (-2.3 per cent) during the December 2016 quarter. Only Perth (+2.1 per cent) and Hobart (+1.2 per cent) saw affordability improve during the quarter.

Based on the HIA Affordability Index scores for December 2016, affordability conditions are the most challenging in Sydney (54.7), followed by Melbourne (66.0), Canberra (76.6), Brisbane (85.3) and Darwin (85.3). By some margin, Hobart (117.8) is the most affordable capital city. Perth (96.6) is the second most affordable capital, followed by Adelaide (93.0).

“During the December 2016 quarter, housing affordability across Australia worsened by some 7.3 per cent due to the recent uplift in dwelling prices,” explained HIA Senior Economist, Shane Garrett.

“However, Perth experienced a further improvement in affordability and today’s report also shows how home purchase remains particularly accessible in markets like Tasmania, regional South Australia, regional Western Australia and regional parts of the Northern Territory,” added Shane Garrett.

“Nationally, housing affordability has managed to move in the wrong direction in many major cities despite the fact that interest rates are at very low levels. The sluggish pace of earnings growth in the economy has been an impediment to better affordability,” Shane Garrett pointed out.

“Achieving sustained improvements in affordability requires stepping back and looking at the big picture.

Housing affordability is front and centre in everyone’s mind once more. Whilst there is no single solution, there are some key policy levers that governments could use to provide some relief,” concluded Shane Garrett.


Foreign Property Buyers On The Rise

According to the latest NAB Quarterly Australian Residential Property Survey, Q4 2016, foreign buyers increased their market share in both new and established housing markets for the first time since late-2015.

In Q4, foreign buyers accounted for 10.9% of all new property purchases (10.2% in Q3) – the highest level since Q1’16. In established housing markets, their share rose to 7.6% (6.4% in Q3) – the highest level since Q4 2015.

In new property markets, foreign buyers were noticeably more prevalent in VIC, where their market share of sales rose to 19.3% (15.0% in Q3).

In WA, their market share grew to 9.3% (6.6% in Q4). Interestingly, the share of foreign buyers in WA has been climbing steadily since Q2’16, suggesting foreign buyers may be seeing greater value as local prices fall.

Foreign buyer levels were however broadly unchanged in NSW at 8.1% (8.0% in Q3) and fell in QLD to 9.2% (10.5% in Q3) to its lowest level since mid-2014.

In established housing markets, the share of foreign buyers increased to 10.8% in VIC (8.5% in Q3) – its highest level in over a year – and 8.4% in NSW (7.2% in Q3). Foreign buyers were also a little more active in WA (5.4% vs. 5.2% in Q3), but were less prominent in QLD, where their market share fell to just 5.0% (5.7% in Q3) – the lowest since mid-2012.

Around 55% of all property purchases made by foreign buyers in Q4 were for apartments, 30% houses and 15% land for re-development.

But these ratios varied quite a lot by state. In VIC, around 47% of sales were for apartments, compared to around 59% in NSW and QLD and 52% in WA. In contrast, around 33% of foreign purchases in WA and 32% in VIC consisted of houses, compared to 27% in NSW and 31% in QLD. Just over 1 in 5 (21%) properties purchased by foreign buyers in VIC were for dwellings/land for re-development purposes, compared to just 11-15% in all other states.

By price point, around 30% of apartments purchased by foreigners were valued at less than $500,000, and 45% were valued at $500,000-$1 million. Around 16% were for apartments worth $1-2 million, 7% for properties worth $2-1 million and 3% for apartments over $5 million.

Around 41% of apartments sales in QLD and 42% in WA were for properties under $500,000, compared to just 20% in NSW and 30% in VIC. Property sales in the $500,000-$1 million range varied from 47% in NSW t0 40% in VIC.

At the prestige end of the market, around 11% of property sales in NSW and VIC were over $2 million, compared to just 6% in QLD and WA.

The proportion of Australian homes selling at a loss is rising, particularly for units

From Business Insider.

Residential property prices skyrocketed in Sydney and Melbourne last year.

They jumped by more than 10%, taking the increase in the median property price in both cities from 2009 to over 80%, according to data released by CoreLogic.

Enormous gains in anyone’s language, delivering some equally enormous profits to owners for simply holding property.

That fact is underlined by the latest “Pain and Gain” report from CoreLogic, a snapshot on the proportion of properties that sold for a higher price than which they were previously bought for during a particular quarter.

In the September quarter last year, only 2.3% of all properties sold in Sydney, and 4.9% in Melbourne, were done so at a loss, well below the national average of 9.4%.

And, as this table from CoreLogic shows, the proportion of loss-making sales for houses were well below those for units during the quarter, with the exception being Sydney.

Source: CoreLogic

“Across the combined capital cities, the report shows that houses were almost half as likely to be resold at a loss compared to units over the September 2016 quarter, with the figures recorded at 5.6% and 10.2% respectively,” said CoreLogic.

With most properties selling for a higher price than what they were bought for, CoreLogic said that $A17.0 billion in realised profits were recorded during the quarter, dwarfing the $A477.9 million figure seen for loss-making sales.

Put another way, the average gain for a profitable sale was $A262,672 during the quarter. In comparison, the average loss was just $A71,529 over the same period.

While the proportion of loss-making sales in Sydney and Melbourne remain at historically low levels, from a national perspective, CoreLogic says the proportion of loss-making resales for both houses and apartments have trended higher over the past year.

This chart from CoreLogic shows the national percentage of loss-making house and unit transactions going back to 1998.

Source: CoreLogic

And while loss-making sales in Sydney and Melbourne remain low from a historical perspective, that was offset by a noticeable lift in those capitals most aligned to the mining sector.

“Although the occurrence of losses rose over the quarter, in most cites the instances of homes reselling at a loss is low with the exceptions being Perth where almost two out of every five dwellings resold at a loss and Darwin where approximately three out of every 10 resales was at a loss over the quarter,” said Cameron Kusher, head of research at CoreLogic.

Here’s the historic trend in loss-making sales in Sydney, Melbourne, Brisbane and Adelaide.

Source: CoreLogic

And for Perth, Hobart, Darwin and Canberra.

Source: CoreLogic

While loss-making sales in Perth and Darwin remain well above the national average, there’s tentative evidence to suggest that the price cycle in both these capitals is now close to bottoming, suggesting that the proportion of properties being sold for less than what they were bought for may begin to decline in the quarters ahead.

We’ll get further clarification on that front later this week when CoreLogic releases its monthly capital city home value index for January.