Politicians and the powerful property lobby continue to argue that building more houses is the solution to Australia’s chronic affordability problems.
But a “supply-side solution” – as propounded by NSW Premier Gladys Berejiklian as well as Prime Minister Malcolm Turnbull and Treasurer Scott Morrison – will only work if affordability is just a supply-side problem. Evidence suggests this is not the case. In fact, our analysis shows that Australia is almost a world leader in rates of new housing production.
How Australia compares
One way to assess Australia’s supply performance is to compare it with other developed countries. The graph below compares the number of dwelling completions per 1,000 persons across 13 countries, for the years 2010 and 2015. On this measure, Australia’s new housing production is second only to South Korea’s.
Australia delivers two-thirds more homes per 1,000 persons than the US and four times more than the UK. When we measure supply as a proportion of existing stock, Australia again ranks second with a rate double that of the US.
OECD questionnaire on affordable and social housing; World Bank population growth and total population figures, Author provided
A slightly different approach takes into account population growth. This involves measuring dwelling completions per head of new population. Here Australia’s performance sits in the middle of the pack.
We are delivering just over 0.5 dwellings per head of new population compared to more than 2 in South Korea. This rate is, however, still ahead of the UK and comparable to the US. Again, that suggests inadequate supply is not the major cause of the affordability crisis.
OECD questionnaire on affordable and social housing, World Bank population growth and total population figures, Author provided
State comparisons of supply
At a national level, supply seems pretty healthy. But there are significant state variations. This might, on the surface, be used to explain different patterns of price growth.
The table below shows that New South Wales has produced fewer new homes per 1,000 people than Australia overall over a 30-year period. The difference was particularly marked between 2005 and 2015.
State comparisons of new housing supply.ABS building activity Australia cat. 8152; ABS Australian Demographic statistics Cat 3101, Author provided
However, higher supply output in the other states has certainly not created affordable markets. In NSW, the last two years have delivered significant supply growth yet prices have continued to rise just as fast. So why do prices rise with supply growth?
Demand drives supply
In a market-driven housing system, price stimulates new housing supply. In Australia new supply has responded relatively quickly to price rises (despite the continuous rhetoric from the property lobby about planning).
But there is always some lag due to the time it takes to secure necessary approvals and physically construct property. There is no such lag with demand meaning there is often a sustained mismatch between the two – positive or negative.
In a rising market, development becomes more profitable and land values rise, meaning greater returns for all concerned. Potential future capital gains stimulate investment activity. Price rises also allow owner-occupiers to trade up as the equity in their own dwelling increases.
In such circumstances, increased levels of housing supply do little to satiate demand created by population growth and the appetite of investors.
Western Australia has had an incredible level of housing completions over the last 30 years, as shown in the table, with 2014 and 2015 particularly strong. In the last 12 months, dwelling commencements have collapsed by more than 25%. Prices have been falling slowly for almost three years driven by the contraction in the resources sector and strong levels of new supply.
However, even under these conditions, WA housing affordability shows little sign of improving for those on low incomes. The market still cannot deliver housing for those at the bottom end of the market.
The housing market is simply unable to deliver housing that is affordable to those on lower (and, increasingly, moderate) incomes because there is a minimum cost of delivering housing that meets minimum community standards. This is made up of the land price, the physical construction costs of the dwelling, and the profit required for taking on the development risk.
This is why market intervention and subsidy are essential to deliver options for those on low incomes.
Targeted interventions are needed
Two strategies are needed to deliver affordable housing to the lower end of the market.
First, demand-side measures need to be better targeted to stimulate investment in new supply, particularly affordable rental housing, rather than simply fuelling demand.
Second, any government serious about improving affordability needs to put more resources into the community housing sector. This could be funded in two ways: partly by taxing the windfall gains from development and partly by reallocating existing demand-side subsidies.
The community housing sector can operate counter-cyclically. This means it can maintain housing supply even when house prices stagnate or fall – which is good for the economy.
Targeting supply to deliver housing for those on low incomes and reining in demand-side incentives that fuel prices will make some difference to affordability for those most affected.
There was some encouragement over the weekend. Scott Morrison discussed the rental market and social housing as part of the affordability solution. This was a welcome change from trotting out the tired old supply arguments and threatening to fuel demand through more home ownership incentives.
Let’s hope the treasurer follows through and delivers some much-needed “whole of housing market” thinking in the May budget.
Authors: Steven Rowley, Director, Australian Housing and Urban Research Institute, Curtin Research Centre, Curtin University; Nicole Gurran, Professor – Urban and Regional Planning, University of Sydney; Peter Phibbs, Chair of Urban Planning and Policy, University of Sydney
By some metrics, housing market conditions have cooled and credit growth to households has slowed, but risks related to house price and debt levels have not yet decreased.
Their specific assessment on Australia points out that house price gains have moderated [but this does not reflect more recent events]. However, the extent of cooling has varied considerably across cities. The strongest price increases continue to be recorded in Sydney and Melbourne, where underlying demand for housing remains strong. With house prices still rising ahead of income, standard valuation metrics suggest somewhat higher house price overvaluation relative to the previous IMF assessment.
The latest IMF assessment says that signs of commercial real estate overvaluation have emerged. Commercial real estate prices in Australia have increased rapidly since mid-2014. Rents have not followed at the same pace, and the price-to-rent ratio is now above average. Whether the latter is a good metric of fair value is difficult to assess. Risks to financial stability from any potential CRE overvaluation appear manageable. The share of commercial real estate lending in commercial banks’ total assets decreased in the past few years and has now stabilized at around 5 percent.
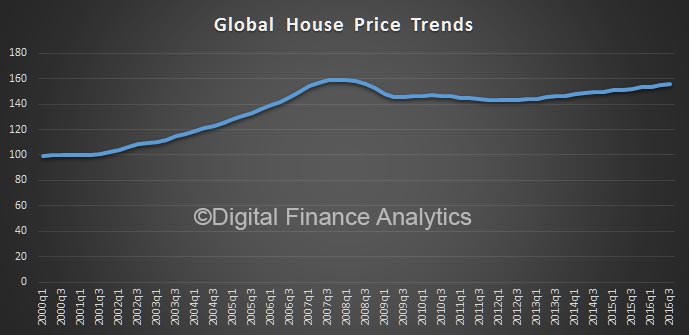
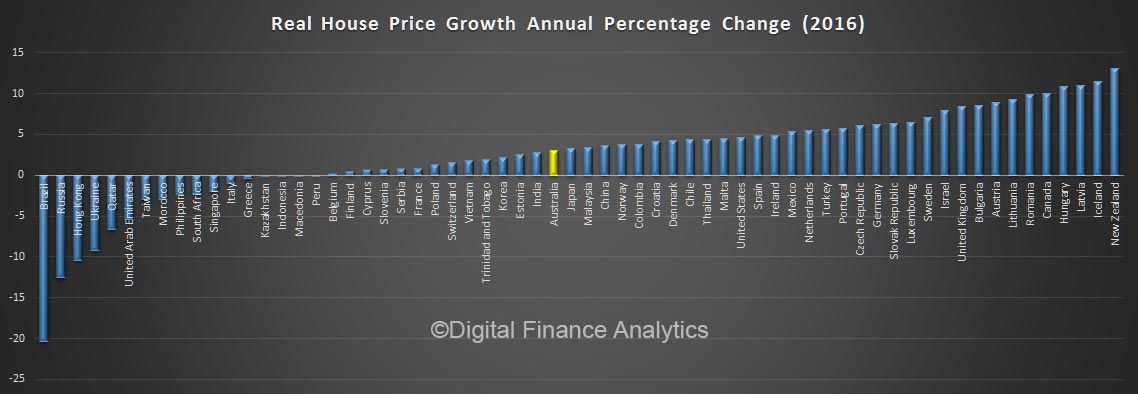
Overall the IMF’s Global House Price Index—an average of real house prices across 57 countries — continued to climb up in the third quarter of 2016. This is the sixteenth consecutive quarter of positive year-on-year growth in the index.
Brazil: Rio de Janeiro, China: Shanghai, Croatia: Zagreb, Cyprus: Nicosia, Finland: Helsinki, France: Paris, Greece: Athens, Macedonia: Skopje, Netherlands: Amsterdam, Russia: Moscow, Singapore: Singapore, Slovenia: Ljubljana, and Spain: Madrid.
Bust and Boom
Denmark: Copenhagen, Estonia: Tallinn, Hungary: Budapest, Iceland: Reykjavik, Indonesia: Jakarta, Ireland: Dublin, Japan: Tokyo, Latvia: Riga, New Zealand: Auckland, Portugal: Lisbon, South Africa: Johannesburg, United Kingdom: London, and United States: San Francisco.
Boom
Australia: Melbourne, Austria: Vienna, Belgium: Brussels, Canada: Toronto, Chile: Santiago, Colombia: Bogota, Hong Kong: Hong Kong, India: Delhi, Israel: Tel Aviv, Korea: Seoul, Malaysia: Kuala Lumpur, Mexico: Mexico City, Norway: Oslo, Slovakia: Bratislava, Sweden: Stockholm, Switzerland: Zurich, and Taiwan: Taipei City.
The position of Australia on the price growth is probably understated (based on more recent data).
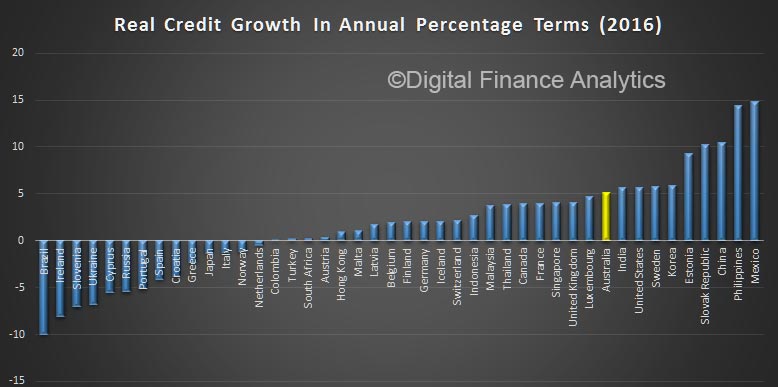
Credit growth in Australia is towards the upper end of the countries listed.
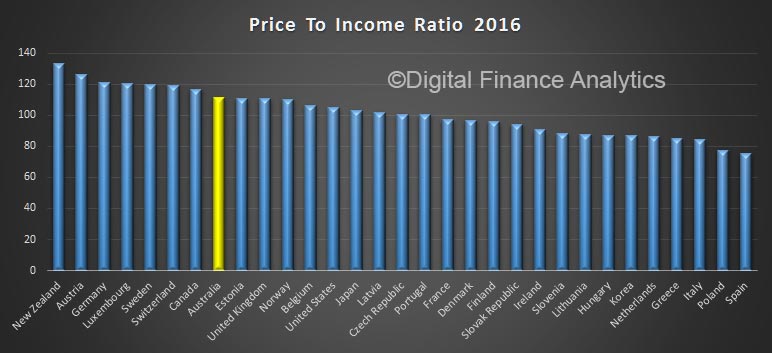
The price to income ratio is Australia is relatively high.
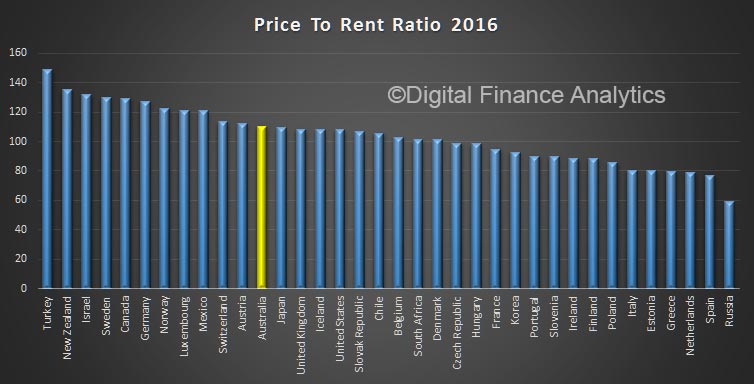
The house price to rent ratio shows Australia above the average.
This suggests the housing issues are global in nature, and not exclusively the result of local policy settings! Many countries are are feeling the draft from low interest, and rising home prices.
According to various media reports, the Victorian Government has announced changes to stamp duty attached to buying property today. Currently, first time buyers in Victoria get a 50 per cent stamp duty discount, but from July, the duty will be removed for first-home buyers in the state where the property costs less than $600,000. In a band between $600,000 and $750,000 there will be stamp duty reductions regardless of whether the property is new or existing. It will assist owner occupied buyers.
Around 25,000 people a year are expected to benefit from the changes with average first-home buyer saving an extra $8,000. Those buying close to the tax limit of $650,000 would be $11,000 better off.
In the financial year 2013-14, the Victorian Government received $3.5 billion in duty, now it stands at $5.7 billion. The changes would cost about $800 million over four years.
Also, a $50 million “HomesVic” program will begin in January 2018 to give about 400 buyers an option to co-purchase a home with the government in an equity share. Buyers will need a 5 per cent deposit to be eligible, and equity up to 25 per cent for each property which the government will recover when the property is sold, The scheme will target couples earning up to $95,000 and singles earning up to $75,000.
Additional measures include a 1% land tax on vacant property and removal of some investment property stamp duty incentives.
These measures add to the to the land release and country first owner grants already announced. Combined they could make quite a difference to the market.
Exclusive analysis performed for AFR Weekend has revealed that more than a million Australian home owners will struggle with mortgage stress if interest rates were to rise just three percentage points.
Data from research house Digital Finance Analytics shows that close to one in three households from Victoria, Tasmania and Western Australia will experience mortgage stress ranging from mild to severe in the event of just three rises of 25 basis points. A rise of 300 basis points, back to more normal levels, would be much more severe.
Runaway house prices in Melbourne and Sydney have added to the risks facing the economy as rising levels of household debt make home owners and property speculators vulnerable to unexpected moves in interest rates.
The Reserve Bank of Australia’s official cash rate, on which mortgage rates are based, is as an “emergency low” 1.5 per cent. In practice that means mortgage repayment rates are between about 4 per cent and 5 per cent of the loan amount per year.
Digital Financial Analytics principal Martin North says that a shake out in the property market would not be restricted to lower income areas and would include households in the trophy suburbs of Bondi and Lane Cove in Sydney as well as homes in the leafy green streets of Toorak and Prahran in Melbourne.
“The common theme here is affluent households paying top dollar for apartments with big mortgages and the potential to be caught out by rising interest rates and flat or falling incomes. Even places like the lower north shore are being hit” he said.
Under the modelling performed by Digital Finance Analytics, there are around 650,000 households in Australia experiencing some form of mortgage stress. The numbers are consistent with a Roy Morgan report from September 2016 that showed one in five households were experiencing mortgage stress.
The longstanding measure for mortgage stress has been 30 per cent of household income.
Mild mortgage stress might see household cut back on childcare expenses, dipping into savings or reaching for the credit card in order to make payments. Severe mortgage stress indicates that the mortgage holder has missed a payment or payments and is already considering selling the property.
If rates were to rise 150 basis points the number of Australians in mortgage stress would rise to approximately 930,000 and if rates rose 300 basis points the number would rise to 1.1 million – or more than a third of all mortgages. A 300 basis point rise would take the cash rate to 4.5 per cent, still lower than the 4.75 per cent for most of 2011.
Professor Roger Wilkins of the Melbourne Institute at the University of Melbourne produces the Household Income and Labour Dynamics Survey, regarded as one of the best sources of information about housing affordability in Australia.
He says that while mortgage stress hasn’t materially increased in recent years that a sharp rise in interest rates would be destructive to household finances everywhere.
“If the cash rate goes to 6 per cent then you would expect to see a lot people in strife. Particularly with wage growth and inflation at such low levels so that does increase vulnerability to rises to interest rates” Mr Wilkins said.
Most Australian banks are facing a one or two notch rating downgrade over the next two years as rising residential property prices put financial institutions at risk.
In a commentary on Australian banks entitled Rising Economic Risks Could Cut Ratings on Most Australian Financial Institutions by One Notch, S&P Global Ratings has examined the dangers of Australia’s hot housing market.
Rising economic imbalances are increasing the risk of a sharp correction in property prices, analysts at the global ratings agency said.
If such a scenario occurs, S&P highlighted eight financial institutions (including six banks) which would incur large credit losses and a subsequent credit rating downgrade.
S&P makes these ratings adjustments by focusing on the Risk Adjusted Capital (RAC) Framework.
“Our risk weights applicable to a bank’s loans are calibrated to the economic risk we see in the country. Consequently, as economic risks in a country rise in our opinion, we increase the risk weights, and that pushes down the capital ratios,” Sharad Jain, director at S&P Global Ratings, told Australian Broker.
“This in turn, could have an additional downward impact on bank ratings. This is because our risk adjusted capital ratios are a key driver of our capital and earnings assessment – which is an analytical factor in our assessment of a bank’s rating.”
In the event of rising economic risks facing banks in a particular country, this by itself would be enough to place pressure on bank ratings within that country, he said.
S&P expects property price growth to moderate and then remain at relatively low levels during the next 12 to 18 months.
However, analysts warned there is a one-in-three chance of a ‘downside scenario’ occurring in which property prices spiked. The resultant rise in risk would weaken the capital ratios of all banks in Australia.
For most banks, this movement would not be enough to put further pressure on their credit profiles. Thus, most financial institutions would only be downgraded by one notch.
However, S&P Global gave a warning about eight Australian financial institutions, highlighting two banks – Auswide Bank and MyState Bank – as being at greatest risk in this ‘downside scenario’.
“It is important to point out that, if our downside scenario materialises, to review our ratings on these institutions, we would make an assessment of their position and plans in relation to capital, business, and broader financial profile,” Jain said.
“A two-notch downgrade would be only one of the three likely outcomes in that scenario. The other two likely outcomes are a one-notch downgrade with stable outlook or a one-notch downgrade with a negative outlook.”
S&P Global also warned about the risks posed for AMP Bank, HSBC Bank Australia, ME Bank and P&N Bank in these circumstances although the agency admitted that parent support from these institutions is highly likely to prevent a two notch downgrade.
Living standards and well-being are generally high, though challenges remain in gender gaps and in greenhouse-gas emissions, and further challenges arise from population ageing.
Low interest rates have supported aggregate demand but are also ramping up risk-taking by investors and driving house prices and mortgage lending to historical highs.
A fall in house prices and or demand could have significant macroeconomic implications. Specifically, the market may not ease gently but develop into a rout on prices and demand with significant macroeconomic implications.
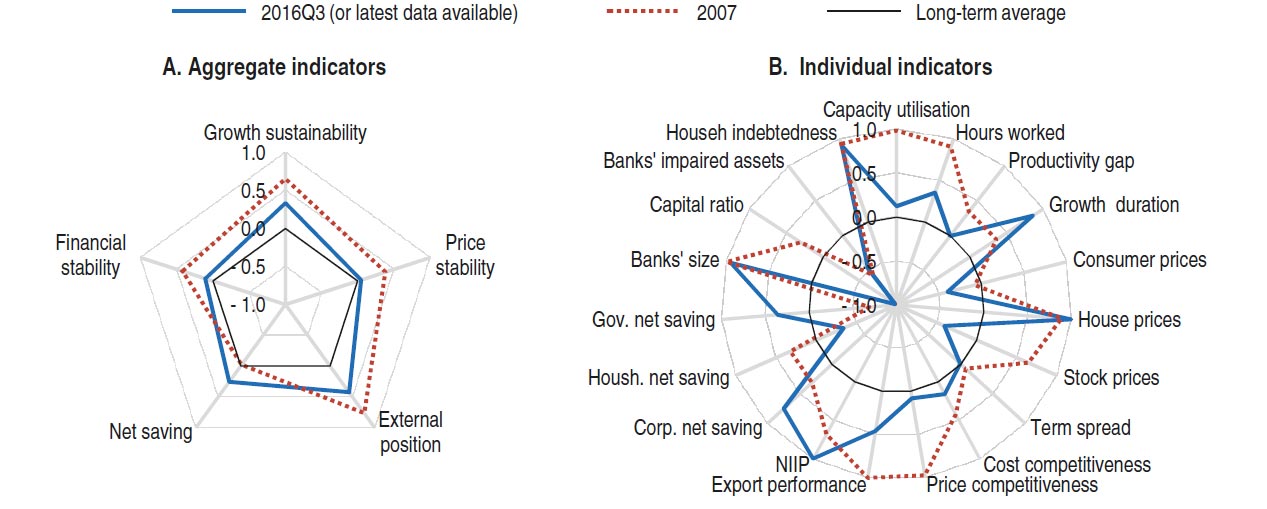
Macrofinancial indicators underline the threat from the housing market, with house prices and related indicators (house indebtedness, bank size), pointing to continued vulnerability. Any impact will most likely be through aggregate demand than financial instability.
They advocate tight macroprudential measures, improved housing supply, and reducing banks’ implicit guarantees by developing a loss absorbing and recapitalisation framework.
They support a cut in company tax, and an expansion of the GST, switching from transaction taxes (like stamp duty) to land taxes.
They say the economy is now rebalancing following the end of the commodity boom, supported by macroeconomic policies and currency depreciation. The strengthening non-mining sector is projected to support output growth of around 3% in 2018 and spur further reduction in the unemployment rate.
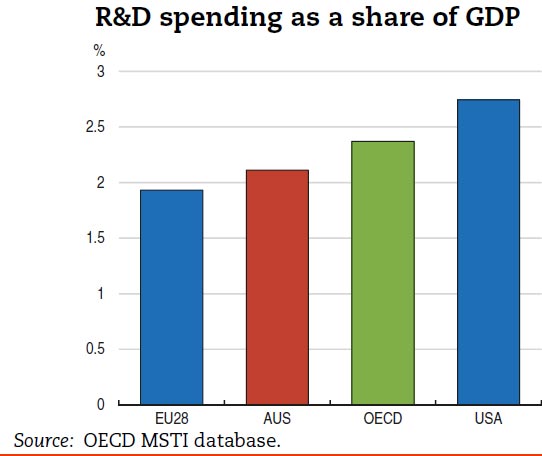
Improving competition and other framework conditions that influence the absorption and development of innovation are key for restoring productivity growth.
Innovation requires labour and capital markets that facilitate new business models. Productivity growth could be boosted through stronger collaboration between business and research sectors in R&D activity.
Australia’s adjustment to the end of the commodity boom has not been painless. Unemployment has risen, and there are increasing concerns about inequality.
In addition, large socioeconomic gaps between Australia’s indigenous community and the rest of the population remain. Developing innovation-related skills will be important for the underprivileged and those displaced by economic restructuring, and can help reduce gender wage gaps.
Externally, Australia, as always, is exposed to the vagaries of global commodity markets and this might include a renewed plunge in prices (or, positively, a strong resurgence). Australia’s iron ore production is among the lowest cost in the world and therefore comparatively insulated from such developments, however its coal sector is relatively more exposed as its production is distributed across the cost curve. Interaction of downside scenarios is likely to exacerbate the negative macroeconomic outcomes.
For instance, a negative external shock could lift unemployment sharply which would result in significant fall in consumption and rising mortgage stress and falling house prices. The economy is well positioned to handle shocks. The speed and strength of the rebalancing processes in response to the end of the commodity boom auger well for the economy’s shock-absorbing capacity. In addition, Australia has more reserve capacity for monetary and fiscal stimulus than many other OECD economies.
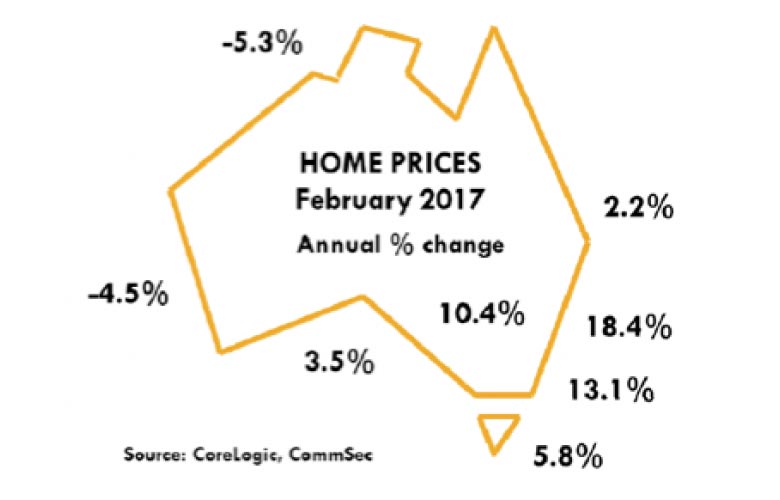
With the current cycle in its 58th month, property price growth hit a new high in February, with prices rising 1.4 per cent to be up 11.7 per cent for the year.
The monthly CoreLogic Hedonic Home Value Index showed Canberra led the way in February with prices rising 3.2 per cent, and Sydney prices were up 2.6 per cent for the month.
Darwin prices fell 4.3 per cent for the month, Perth prices were down 2.4%, and Brisbane eased 0.4 per cent.
Growth conditions have accelerated since mid-2016, said CoreLogic head of research Tim Lawless, as lower interest rates and strong demand from investors drive price increases.
“Growth conditions have been rebounding since the middle of last year when, on two separate occasions, interest rates were cut, and investor demand commenced trending higher,” he said.
Lawless said before the rate cuts, price growth was moderating.
“Prior to capital gains accelerating half way through last year, the growth trend had been moderating, reaching a cyclical low point over the twelve months ended July 2016 when the annual change in capital city dwelling values slowed to 6.1%,” said Lawless.
The February results mark a new high point in the current growth cycle, said Lawless.
“The annual growth rate across the combined capitals hasn’t been this strong since the twelve months ending June 2010,” he said.
Lawless said, “In Sydney, where the annual rate of growth is now 18.4%, this is the highest annual growth rate since the twelve months ending December 2002 when the housing boom of the early 2000’s started to slow.”
The current growth cycle is now approaching five years, being in it 58th month, according to CoreLogic. Since property prices in capital cities began rising June 2012, dwelling values have increased by a cumulative 47.3 per cent, ranging from a 74.9 per cent capital gain in Sydney, to a rise of 6.0% in Perth.
Lawless said the high price growth was bad news for those hoping to get onto the property ladder.
“The strong growth conditions across Sydney have provided a substantial wealth boost for home owners, however, the flipside is that housing costs are becoming increasingly out of reach,” he said.
Lawless said in Sydney, based on September 2016 numbers, dwelling prices are almost 8.5 times higher than gross household income. The figure for Melbourne is 7.1 times.
Craig James, chief economist of CommSec, wrote, “It may be no surprise to see that home prices continue to lift across most capital cities. But what was clearly surprising was the size of the lift in prices.”
“Policymakers will keep a close eye on the housing sector the early part of 2017,” said James, saying they “will prefer to see more balanced house price growth across the nation.”
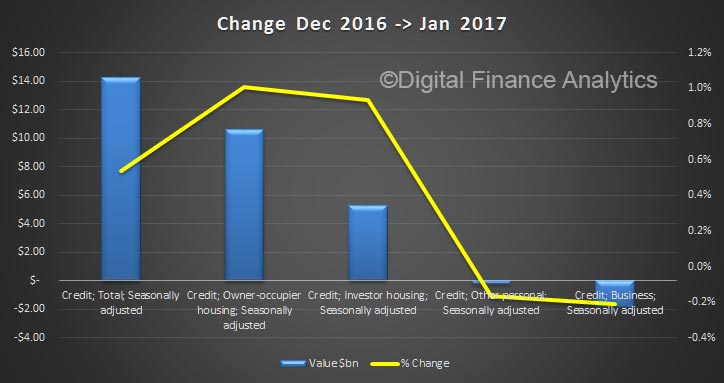
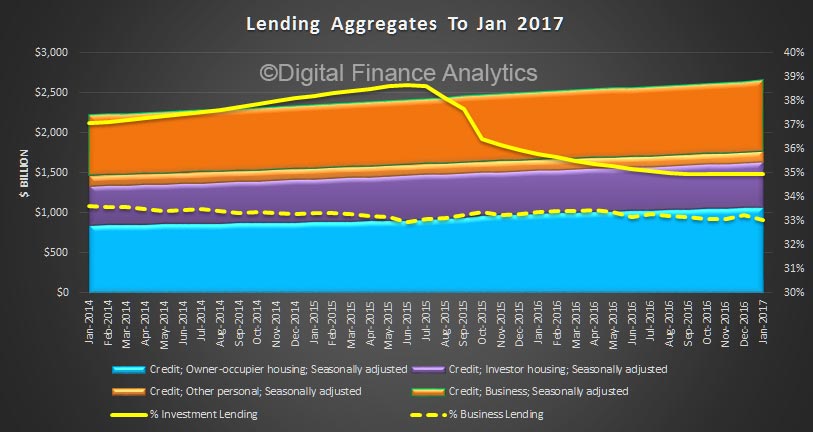
The latest RBA credit aggregate data shows that total lending grew in January 2017 by $14 billion, or 0.5%. Of that housing rose to $1,637.4 billion, up 1% or $15.2 billion. Business lending and unsecured personal finance fell. Clearly housing is where the action is, and given this data and strong clearances, home prices, especially in the eastern states are likely to continue to rise. It also explains the RBA’s recent comments and APRA’s tighter lending guidance. Household debt climbs ever higher, with the risks to match! No way can the RBA cut the cash rate on these numbers.
We see investment lending remained strong at $5.3 billion (0.9%) whilst owner occupied loans grew by $10 billion (1%). Investment loans were one third of all housing loans written.
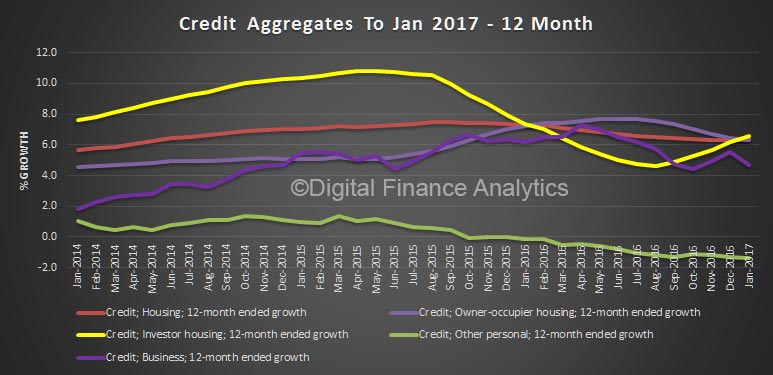
The adjusted annual growth rates for housing loans was 6.4%, with owner occupied loans growing at 6.3% and investment loans 6.6%. Business lending was at 4.7% and personal credit a negative 1.3%.
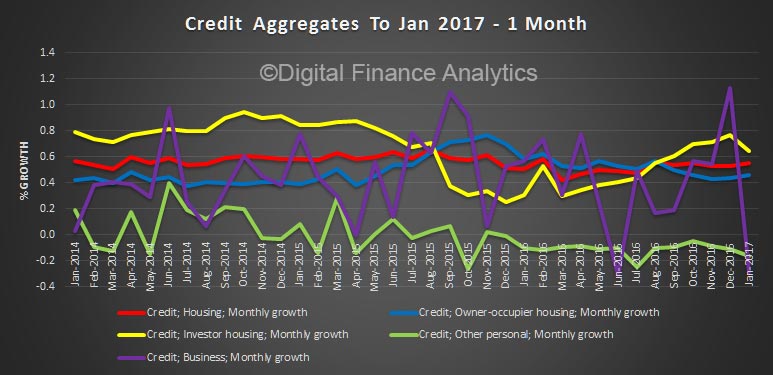
The monthly movements are more noisy, but housing rose 0.5%, the same as a year ago.
The RBA notes:
All growth rates for the financial aggregates are seasonally adjusted, and adjusted for the effects of breaks in the series as recorded in the notes to the tables listed below. Data for the levels of financial aggregates are not adjusted for series breaks. Historical levels and growth rates for the financial aggregates have been revised owing to the resubmission of data by some financial intermediaries, the re-estimation of seasonal factors and the incorporation of securitisation data. The RBA credit aggregates measure credit provided by financial institutions operating domestically. They do not capture cross-border or non-intermediated lending.
Following the introduction of an interest rate differential between housing loans to investors and owner-occupiers in mid-2015, a number of borrowers have changed the purpose of their existing loan; the net value of switching of loan purpose from investor to owner-occupier is estimated to have been $49 billion over the period of July 2015 to January 2017, of which $1 billion occurred in January 2017. These changes are reflected in the level of owner-occupier and investor credit outstanding. However, growth rates for these series have been adjusted to remove the effect of loan purpose changes.
Soaring household debt and housing prices could make it “dangerous” to cut interest rates, the head of the Reserve Bank of Australia says.
Dr Philip Lowe has told a Federal parliamentary economics committee that a deeper cut to the official cash rate could deliver a short-term boost to jobs and inflation but also push already-high property prices and household debt levels to worrying levels.
“Is it really in the national interest to create a little bit more employment growth in the short-run at the expense of creating vulnerabilities which could be quite dangerous in the long term,” Dr Lowe said at the hearing in Sydney on Friday.
He said another rate cut could help drive down the unemployment rate, which could be lower than its current 5.7 per cent, and boost underlying inflation, which could be higher than 1.55 per cent.
RBA figures show the household debt-to-income ratio is already at 187 per cent, while total household debt is equal to about 123 per cent of the country’s gross domestic product.
“I accept that different people will come to different points on judging that trade-off; at the moment we’re in a reasonable place because the unemployment rate is broadly steady and household debt and house price growth at the aggregate level are fast enough,” Dr Lowe said.
“I feel if they were even faster at the moment we would be moving into the area where the vulnerabilities are increasing, perhaps to unacceptable levels.”
Lower housing prices and household debt levels would only marginally strengthen the case for another rate cut, he said.
The central bank chief said monetary policy alone could no longer drive growth and it was up to the Parliament to use fiscal policy — through changes to tax and spending — to support the economy.
“Monetary policy at the margin can help you, but were talking very much at the margin,” he said.
The best way the Government could reduce pressure on property prices and boost growth would be investing in urban transport infrastructure, he said.
He said with a growing population, crowded cities, poor land supply and the difficulties people encounter moving around, investment in urban transport infrastructure would be “a first order gain”.
“It increases demand, takes the pressure off ultra-low interest rates, increases the productive capacity of the economy because people can move around, it takes the pressure off housing prices,” Dr Lowe.
“It’s probably the best housing affordability policy.”


 “If the cash rate goes to 6 per cent then you would expect to see a lot people in strife. Particularly with wage growth and inflation at such low levels so that does increase vulnerability to rises to interest rates” Mr Wilkins said.