Another Strong Auction Result Today

Domain has released their preliminary analysis of auction clearance rates today.  Nationally, 78.3% of the 1,585 listed cleared, with Sydney hitting 81.4% and Melbourne 78.3%. Volumes are down on last year somewhat, but clearance rates remain much higher.

domain-29-oct-2016-1

Brisbane cleared 58% of 131 listings, Adelaide 77% of 105 listed, and Canberra 70% of 74 listed. So we continue to see momentum in the Sydney and Melbourne markets.  No surprise this meshes with recent home price rises.

domain-29-oct-2016

Real Home Value Growth Varies Significantly

Talking about average home price growth is rarely helpful, it is important to get granular. So CoreLogic’s post on real home price growth by major centres is very helpful because it corrects growth for inflation.  Their analysis shows that real home values are now more than 20% lower than their peak in Perth and Darwin, but well up in Sydney. Over the longer term, Sydney and Melbourne are the only two capital cities in which real home values are now back above their previous peaks.  We have a multi-speed market.

The Australian Bureau of Statistics (ABS) released consumer price index (CPI) data for the September 2016 quarter earlier this week.  According to the data, headline inflation increased by 0.7% over the quarter to be 1.3% higher over the year.  Meanwhile, underlying inflation was recorded at 0.3% over the quarter and 1.5% higher over the past 12 months.  Both headline and underlying inflation have increased at a rate below the RBAs target range of 2% to 3%.  This would usually see the RBA cut interest rates to try and lift inflation however, the previous cuts in May and August, which had the same intent, have not successfully lifted inflation.  What those cuts did manage to do was re-energise growth in housing, particularly in Sydney and Melbourne.  For this reason there is some speculation as to whether the RBA will risk cutting interest rates again given concerns that a lower cash rate will fail to push the dollar lower and lift inflation but add further heat to an already strong housing market.

With the CPI data released, we can pair it with the CoreLogic home value index data to September 2016, in order to obtain an understanding of real growth in values.  Although headline value growth is lower than it was a year ago, so too is headline inflation which mean that real value growth, particularly in Sydney and Melbourne remains strong.

chart-1

The above chart highlights the real and nominal changes in home values across each capital city over the 12 months to September 2016.  In both real and nominal terms values have fallen over the past year in both Perth and Darwin while they have increased across each of the remaining capital cities.  There’s also been evidence that along with Sydney and Melbourne, where growth has been strong for almost four years now, value growth has also picked up in other cities such as Adelaide, Hobart and Canberra.

chart-2

If you look at the compound annual change in real home values over the past five, ten and 15 years, the 15 year time-frame in most capital city provides the strongest performance.  The clear exception is in Sydney where the last five years have resulted in the strongest annual returns.  In contrast, across all other capital cities except for Perth and Hobart the past five years have recorded the weakest annual growth across each of the three time-frame.  This result really highlights the strength of the Sydney market over the past five years and its relative weakness over the 10 years preceding.

chart-3

Since the end of 2008 (ie post GFC), growth in home values has significantly skewed towards the Sydney and Melbourne housing markets.  As highlighted in the above chart, when adjusted for inflation values are lower that they were at the end of 2008 in Brisbane, Adelaide, Perth, Hobart and Darwin.  Sydney and Melbourne have also seen a substantially greater increase in values relative to Canberra which was the only other capital city to have seen an increase in real home values.

chart-4

Sydney and Melbourne are the only two capital cities in which real home values are now back above their previous peaks.  After peaking all the way back in the March 2004 quarter, real home values in Sydney are now 35.3% higher in Sydney and in Melbourne they are 17.2% higher than their September 2010 peak.  All other capital cities are still recording real home values below their previous peaks.  The magnitude of these declines are recorded at: -10.2% in Brisbane, -5.3% in Adelaide, -20.2% in Perth, -15.6% in Hobart, -23.8% in Darwin and -1.0% in Canberra.  In some of these cities, values peaked many years ago, as far back as 2007 in Perth and Hobart and 2008 in Brisbane.

Although interest rates are low and in real terms homes have been becoming more affordable outside of Sydney and Melbourne it still hasn’t proved to be enough to lure substantial demand and subsequent growth across the other capital cities.  What this highlights is the importance of employment, what sets Sydney and Melbourne apart, outside of more expensive housing prices, is the fact that they both have strong economies which are creating jobs.  Housing affordability alone is no longer enough to attract an increasing level of housing demand, you need a strong economy and the jobs that go along with those strong economic conditions.

Perth and Darwin in particular are well into a fairly substantial value decline phase which is appears set to continue.  Since their respective market peaks in September 2007 and September 2010, real home values are now -20.2% and -23.8% lower respectively.

Home Prices Rise Again (In Places)

From Domain.com.au

Despite efforts to cool the property market, Sydney house prices have run away yet again, growing at their strongest rate in over a year.

The harbour city’s median house price is now at a record $1,068,303, after a 2.7 per cent jump over the September quarter, Domain Group data released on Thursday found.

This has seen some property owners make hundreds of thousands of dollars by flipping properties purchased in the past few years.

Three-bedroom 4 Milton Street, Chatswood sold for $3.3 million in August - up $1.75 million in three years.Three-bedroom 4 Milton Street, Chatswood sold for $3.3 million in August – up $1.75 million in three years. Photo: Richardson & Wrench Chatswood

It has also pushed home ownership further out of reach of first-time buyers. And experts say this is likely to get even tougher with more price growth on the horizon, despite Treasurer Scott Morrison warning the state governments they need to tackle housing affordability.

Some of the growth in the September quarter was thanks to a surge in Investor activity, which increased 9.2 per cent in the year to August 2016, Domain Group chief economist Andrew Wilson said.

“The growth is raging back into Sydney … we have auction clearance rates in the mid-80 per cent range, and there were two interest cuts in August and May this year,” Dr Wilson said.

The strongest region over the past 12 months was the lower north shore – up 12 per cent in a year. Over the quarter, house prices in the area increased 6 per cent.

But apartment owners weren’t as lucky, with prices up just 1.1 per cent over the quarter to a median of $685,865.

Among house sellers making substantial profits in the lower north were the former owners of three-bedroom 4 Milton Street, Chatswood. It sold for $3.3 million in August – up $1.75 million in three years.

This was a street record and more than $500,000 above expectations, Richardson & Wrench Chatswood principal Warren Levitan said.

There were 14 interested buyers, but the home sold to an offshore purchaser with plans to knock it down and rebuild prior to moving in. In the meantime, it has been rented for $900 a week.

“A lot of the [price growth] is due to the local Asian market, where there are still buyers willing to pay top price … there’s also not a lot of stock,” Mr Levitan said.

They weren’t the only sellers making an enviable profit. Three years ago, 2 Cabramatta Road, Mosman sold for $1,873,000. In September, it sold again for $2.95 million. The sellers of 28 Devonshire Street, Crows Nest also saw their home jump $750,000 in three years.

This “revival” in the Sydney market will “likely be on the RBA’s minds next week,” HSBC chief economist Paul Bloxham said.

But while there’s likely to be more price increases over the next few months, it will be “single digit rather than double-digit growth” on an annualised basis, he said.

He pointed to an increase in supply and a tightening in the guidelines for lenders as what will see property prices grow at lower levels than those seen in 2014 and 2015.

New guidelines from the Australian Prudential Regulation Authority released on Monday require lenders to ensure borrowers are able to afford repayments on a 7 per cent interest rate when assessing whether they’re eligible for a loan.

This means someone buying a median priced house would need to be able to pay $6040 a month on a 25 year loan. Assuming they had a 20 per cent deposit.

This is about the same amount as the entire take-home pay packet on a $100,000 salary.

BIS Shrapnel residential researcher Angie Zigomanis agreed price growth was likely to continue, as “investor numbers are looking better and it looks as if the banks are loosening some of their criteria for lending”.

Strong migration into NSW and fewer homes available for sale would also put pressure on property prices, he said.

Century 21 chairman Charles Tarbey also had “bullish prospects” for the market in the lead-up to Christmas, but warned prices may start to moderate in 2017.

NAB Group chief economist Alan Oster was also not convinced there would be any huge increases in house prices in the near future, as there had been a slowdown in business conditions across NSW.

Already, the apartment market has shown signs of slowing in some areas. Canterbury Bankstown, the south, the west and the upper north shore all recorded modest price declines for units in the three months to September.

Over the year, the biggest drop in apartment prices was seen in Canterbury Bankstown, with a decline of 4.7 per cent to a median of $505,000.

The median apartments across Sydney increased 0.9 per cent in the 12 months to September.

Banks offering ‘significant discounts’ to property investors

From Smart Property Investment

New research has revealed that property investors are negotiating significant price discounts on home loans, despite measures to cool investor lending.

Speaking to Smart Property Investment’s sister publication Mortgage Business following the release of the JP Morgan Australian Mortgage Industry Report last week, Digital Finance Analytics (DFA) principal Martin North, who co-authored the report, said “there is strong evidence that investors are becoming able to secure significant discounts” on their home loans.

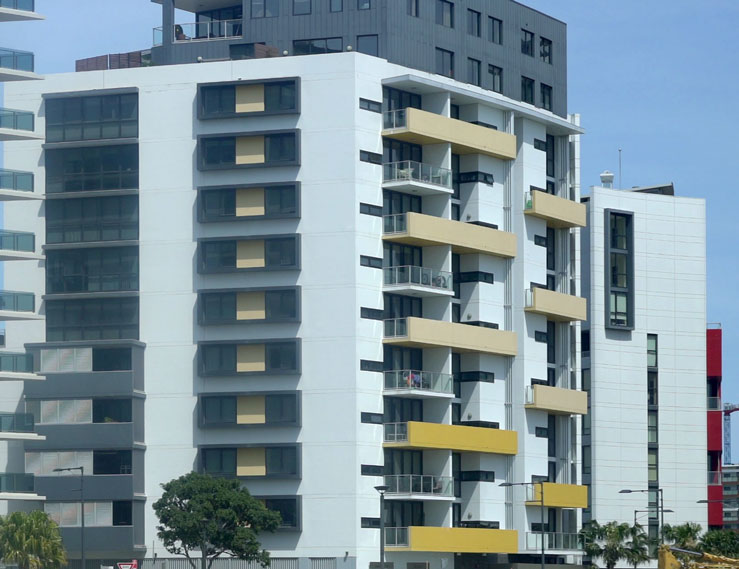
wolli-building

“We are seeing competition swinging back more into the investor loan space. Some of the discounts we are seeing are even better than what is available to FHBs or even owner-occupiers with a higher LVR,” he said.

Rate discounts for investors all but disappeared when regulatory measures saw banks introduce differential pricing last year. Lenders then started to offer attractive headline rates under 4 per cent in an effort to secure investor business, particularly as the growth rate of their books fell below APRA’s 10 per cent speed limit.

According to Mr North, before differential pricing you could get up to 120 basis point discounts on investor loans. Now, he says, those discounts are returning as fresh momentum gathers in the investor lending market.

“Property investors seem convinced that capital growth is still available,” he explained.

“The banks are recognising this. So what they have done is take away some of those great headlines rates, those good deals, and started to offer heavier discounting for investors.

“I’ve noticed that some investors who have been transacting over the last few months have been able to get a very significant discount off their investment loan.”

However, Mr North said banks are “picky” and that discounts are heavily dependent on the type of deal. Investor home loans that are principle and interest (P&I) with an LVR of 80 per cent or less are attracting the biggest discounts, he said.

“My view is that these discounts are now back in the market. But you have to know where to look for them and you have to ask. It’s not just a case of flicking through the comparison websites.

“That’s why there is a very significant correlation between these discounts and mortgage brokers. They know where to find these discounts.”

The revelation comes as new data from major mortgage aggregator AFG shows lending to property investors remains strong, falling by just two percentage points over the September quarter.

Comparethemarket.com.au analysed AFG’s September quarter data to find that borrowing by real estate investors declined marginally from 34 per cent to 32 per cent for the first quarter of the 2016/17 financial year.

Back in May APRA announced the big four banks and Macquarie would be required to hold additional regulatory capital against their loan books as protection against any increase in defaults.

Banks have also tightened their lending requirements. For example, Commonwealth Bank no longer lends to self-employed foreign property investors.

“Tighter regulations designed to cool the property market, and lending to it, hasn’t deterred investors,” Comparethemarket.com.au spokesperson Abigail Koch said.

The latest ABS housing finance data shows that the $31.4 billion worth of commitments in August was split between $19.5 billion worth of commitments by owner-occupiers and $11.9 billion in commitments to investors. The value of lending to owner-occupiers has fallen over two consecutive months while lending to investors has risen for the fourth consecutive month.

Unit Prices Growing Slower Than Houses

In an interesting post from CoreLogic, Cameron Kusher discusses the supply on units, and concludes there are more coming on stream relatively in Brisbane and Melbourne, than Sydney, so risks are lower, here. But I found his observation about relative home price growth even more interesting.  Unit prices are moving more slowly than houses.

We suggest the rising supply of units appears to be having a depressive impact on price growth and given the continued supply ahead, unit prices are unlikely to defy gravity in the major centres.  Investors beware!

In the recently released Financial Stability Review (FSR) the Reserve Bank (RBA) talked about the supply risks surrounding the inner city apartment markets however, they did point to the fact that they see more potential risk in Melbourne and Brisbane.  In this blog we explore the differences in pending apartment supply across the key capital cities.

chart-1

The above chart highlights the change in house and unit values across the individual capital cities since the market entered its current growth phase in June 2012.  The first thing to note is that in all cities except for Hobart, house values have risen by a greater amount than units.  In fact, in all of the remaining capital cities except for Sydney unit values have increased by less than half the rate of houses.  This highlights that despite the shift to more unit living, particularly in inner-city areas, ultimately there appears to be a healthier relationship between supply and demand for houses compared with units and as a result, house values have increased at a faster rate than units.

Morrison targets state planning regulations as problem for housing affordability

From The Conversation.

The government will push states to remove unnecessary residential land use planning regulations that are impeding the supply of housing, Treasurer Scott Morrison will say in a major speech acknowledging the pressing issue of housing affordability.

Addressing the Urban Development Institute of Australia on Monday Morrison will say that improving affordability “right across the housing spectrum must … be a key policy goal for governments at all levels”.

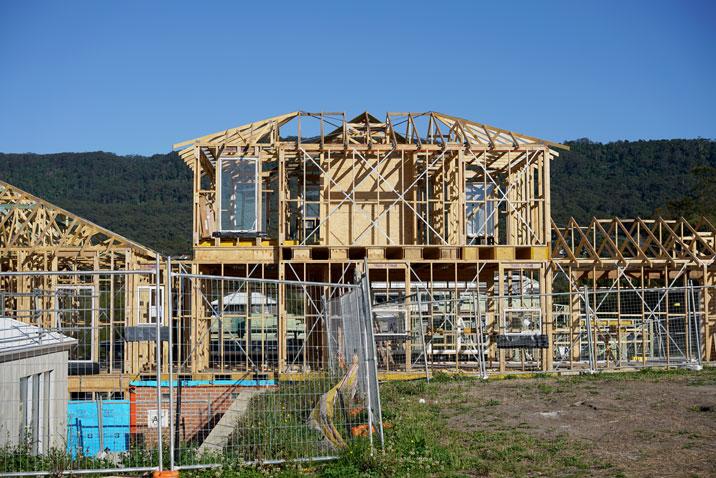
half-buit-house-pic-4

Developing a sensible policy requires separation of the forces that have caused prices to increase, he will argue. “Of all the determinants of house prices in Australia, whether cyclical or structural, the most important factor behind rising prices has been the long running impediments to the supply side of the market.

“This not only relates to the volume of supply but also the responsiveness, flexibility, diversity and composition of that supply, as housing needs becomes more complex.

“A period of weak residential construction in the mid to late 2000s left many markets undersupplied, especially in NSW.”

While a large volume of construction is now coming through and much more is anticipated, not all is in the right place or of the right type, Morrison will say.

“Whilst Sydney, Melbourne and Brisbane have record supply, most of this is in the inner city apartment market … Unfortunately, we are still seeing a muted supply of detached housing in other parts of our cities.”

Morrison will list supply side constraints as including “complex land planning and development regulation; insufficient land release; the planning, cost and availability of infrastructure provision; transaction and betterment taxes; public attitudes towards urban infill; and, for Sydney in particular, physical geographic constraints.”

State governments could do a lot to improve planning processes and the provision of infrastructure, he will say.

He will instance developers telling Treasury about increasing development times including one case on Melbourne’s outskirts where it took 12 years for a project to go from land acquisition to a new suburb.

“This is how long it took for the land to be rezoned and for the developer to meet the onerous hurdles required in construction.

“While some construction standards are important for maintaining the safety and quality of newly constructed dwellings, some of these hurdles sounded almost farcical. For example the Melbourne developer wasn’t permitted to design the shopping precinct of the new suburb they had built because the Victorian government required that their own architects did the work (and at their own pace).

“So even though there have been some signs of a supply response in recent years, particularly in inner-city apartments, more needs to be done to ensure that supply increases more broadly – both in terms of location and type of dwelling – and that the roadblocks to this increased supply are removed.”

This will be a focus of Morrison’s discussions at the next Council on Federal Financial Relations in early December.

The proportion of Australian households owning or paying off their home has fallen from 71% to 67% over the past 20 years.

The proportion of home owners aged over 45 with a mortgage has increased significantly in that time.

“It’s taking longer for people to own their own home and be free of their mortgage. This trend has the potential to undermine retirement incomes, with superannuation cashed in on retirement to clear the mortgage or having mortgage costs eating into retirement income or undermining their ability to save more as they approach retirement,” Morrison will say. Housing un-affordabilty thus has a “cascading impact”.

Morrison will point to the “real pinch point” – being able to get into the market in the first place.

“As house prices have risen relative to incomes, this is making it more difficult for first home buyers to keep up and save an adequate deposit,” he will say.

“The proportion of home loans that are being provided to first home buyers was 13.4% in August 2016, the lowest point since February 2004 and well below its long term average of 19.4%.

“In aggregate, across the country, a 20% deposit on the nationwide median home loan is more than 100% of annual household disposable income. This is slightly above the decade average, but well above the 60% levels that were the norm prior to 2000,” Morrison will say.

“The market is getting away from people. No matter how hard they work or save or even earn, they are finding it harder and harder to get into the market.”

But “the key to addressing housing affordability is not to crash the housing market. Rather the objective is to have housing policies that mitigate the artificial inflation of asset prices, ensure that supply is not restricted from responding to genuine demand and that enable homebuyers, through their own efforts, to make more rapid progress to being able to enter the market”.

On the issue of the looming glut in inner city apartments, Morrison will say that “notwithstanding some regional risks, the current construction cycle would likely have to run-up faster and continue for longer before over-supply became a nationwide macroeconomic risk.

“That is not to say that the size and length of the current construction boom won’t warrant attention in the coming months and years. Policy makers are very cognisant of the risks and have been doing something about it.”

RBA Minutes On Housing

The RBA minutes, released today, have several paragraphs on the housing sector, yet seem to be quite selective in their narrative. So we have laid out our own perspectives alongside the words from the RBA.

Housing-Dice

We think the housing risks are higher for one simple reason. Debt enables households to bring forward purchases, to be paid for from later income. But with income rising so slowly, and debts still growing fast, how will the debts be repaid?

RBA Minutes Says DFA Says
Household consumption growth had moderated in the June quarter. This was driven by a decline in the consumption of goods, consistent with low growth in retail sales volumes, while growth in the consumption of services had remained around average. More timely indicators of household consumption had been mixed: although growth in retail sales had been low over the few months to July, households’ perceptions of their personal finances had remained above average. Members noted that future consumption growth would largely depend on growth in household income. Members observed that the household saving ratio had been little changed in the June quarter but remained on a gradual downward trend, in line with earlier forecasts. Why no mention of the rising household debt ratio? It is now higher than ever it has been. With income growth so low, whilst serviceability of large loans at current interest rates is manageable by many, how will the capital value of the loan be paid off?

The proportion of households who are property inactive continues to rise, as more are excluded on affordability grounds.

Dwelling investment had been increasing more rapidly than housing credit, suggesting that households were increasing their housing equity at a relatively strong rate. Indeed, private dwelling investment had continued to grow at an above-average rate in the June quarter. The large amount of work in the pipeline and the high level of building approvals in July and August were expected to support a high level of dwelling investment for some time, although the rate of growth in dwelling investment was expected to decline over the forecast period. Investment loans were the only growth area in the August ABS data- up 1%. Lenders are very willing to lend to this sector. We think stronger macro-prudential policies are needed. Demand for investment property remains strong, on the expectation of continued future home price growth.


The growth of home prices is not matched to growth in rental incomes, in fact they are slower than they have been for years.  This creates a further risk in the investment sector. We know many households are not covering the costs of their rental property from rent received, relying on tax breaks and offsets, especially in VIC and NSW, whilst hoping for capital growth.

In the established housing market, conditions had eased relative to a year earlier, although there had been some signs that conditions had strengthened a little more recently. Housing price growth in Sydney and Melbourne had increased in recent months and auction clearance rates in these two cities had risen. In contrast, turnover and housing credit growth had been noticeably lower than a year earlier and the value of housing loan approvals had been little changed in recent months. Conditions in the rental market had continued to soften, particularly in Perth, where population growth had been easing and the rental vacancy rate had risen. There is debate as to the rate of real growth in home prices, but they are still rising, especially in VIC and NSW. High auction clearance rates show demand remains strong. Home prices could well continue to rise, enabling more lending. We need DSR and LTI macro-prudential measures. LVR measures do not help much in a rising market.
Conditions in the housing market had been mixed over prior months. The effects of tighter lending standards had been apparent in indicators such as the shares of interest-only loans and loans with high loan-to-valuation ratios in new lending, both of which had declined over the past year. Turnover had declined and housing credit growth had been steady at a noticeably lower rate than a year earlier. Although the rate of increase in housing prices had been lower than a year earlier, growth in housing prices and auction clearance rates had strengthened in Sydney and Melbourne in the months leading up to the meeting. Members noted that considerable supply of apartments was scheduled to come on stream over the next couple of years, particularly in the eastern capital cities. Overall, members assessed that while the risks associated with rapid growth in housing prices and lending had receded over the past year, developments would need to be monitored closely. Interest only loans are actually rising again according the APRA’s latest data, as investment loan growth continues. Several lenders are offering attractive discounts now. Household have high levels of debt. The risks are quite high now, and would become severe if interest rates were to rise


House price crash ‘unlikely’: AMP Capital

Australian house prices are facing a downswing over the next two years, but a crash in prices remains unlikely, according to AMP Capital as reported in InvestorDaily.

RE-Jigsaw

House prices in Sydney and Melbourne have risen by 60 and 40 per cent respectively over the past four years, said AMP Capital chief economist Shane Oliver – and the median house price in Sydney is now 12.2 times household income.

Additionally, Mr Oliver explained that the rise in house prices has “gone hand-in-hand” with increasing levels of household debt, making the debt to income ratio for Australian households one of the biggest among OECD countries.

“The surge in prices and debt has led many to conclude a crash is imminent, but we have heard that lots of times over the last 10-15 years. Several considerations suggest a crash is unlikely,” Mr Oliver commented.

Mr Oliver explained that debt interest payments relative to income are around 2004 levels, and lending standards in Australia have not dropped to levels seen in other countries.

The risk of housing oversupply is also unlikely to cause a price crash, as “this would require the current construction boom to continue for several years”, Mr Oliver said.

Mr Oliver added that the risks on the “supply front” are clearly rising in relation to apartments, where approvals to build additional units are running at more than double normal levels.

Altair Asset Management chief economist Stephen Roberts also cited rising levels of housing inequality in China as a risk factor to Australian house prices, explaining that the Chinese government’s recent focus on excessive house price speculation could have a flow-on effect on Australian prices.

“It is reasonable to assume that policy moves to contain house price inflation in China will increase and will reverberate through to investment demand for housing overseas too,” Mr Roberts said.

Both Mr Oliver and Mr Robertson commented that housing construction is likely to ease in 2017, however Mr Oliver remarked such easing would be unlikely to affect the economy as “this is likely to coincide with a fading in the detraction from growth due to falling mining investment and commodity prices”, where Mr Robertson said otherwise.

“The contribution to economic growth from housing will be less in 2017 than in 2016 and will probably lessen the contribution to growth from housing related consumer spending too,” Mr Robertson said.

“In time, policymakers will respond to the weakening outlook, probably with the RBA resuming its cash interest rate cutting program around the middle of 2017.”

Canada Mortgage Rules a Step Toward Cooling Home Prices

Fitch Ratings says new Canadian Department of Finance mortgage rules to reduce speculation in residential real estate are a step toward cooling the housing market in major cities including Toronto and Vancouver. The new rules could result in improved credit quality in certain residential covered bond programs.

canada-pic

The rules include applying an interest rate stress test for all insured mortgages starting on October 17; previously, this was only required for homebuyers with a down payment of less than 20% of the home purchase price or for mortgages of less than five years. Tightened mortgage insurance eligibility requirements for “low-ratio” mortgages – mortgages for less than 80% of a home’s purchase price – will also be applied from Nov. 30. The government has also proposed to no longer exempt non-residents from paying capital gains taxes on income from selling a property.

Fitch believes that the new measures may temper the housing market, especially in cities that are significantly overvalued. According to a Fitch study published earlier this year, home prices across Canada are estimated to be about 25% above their sustainable value with major regional variations.

The income tax rule change in particular should reduce housing demand from foreigners. In Vancouver, this will reinforce the effects of the 15% tax on foreign home purchases put in place by the British Columbia government in August. Data from the Real Estate Board of Greater Vancouver indicate that average sale prices of detached houses have already dropped by roughly 16%, led by higher priced properties.

The new mortgage insurance guidelines could improve portfolio credit quality in the Canadian registered covered bond programs. While insured mortgage loans are prohibited from securing this subsector of the covered bond market, changes to insured mortgage loan underwriting requirements could influence non-insured mortgage loan underwriting requirements. Any tightening of non-insured mortgage loan underwriting requirements would further help to cool the housing market and also help to address the concern of heightened borrower leverage.

RBA On Inner City Apartment Exposures

The latest RBA Financial Stability Review includes coverage on the Banks’ Exposures to Inner-city Apartment Markets. They say banks are most exposed to inner-city housing markets through their mortgage lending rather than via their development lending. Sydney and Melbourne have the largest exposures. That said, they downplay the risks, thanks to the run-up in prices providing a buffer (though this is not true for new transactions) whilst admitting that there is no data on the geographic footprint of mortgage lending in the returns the banks provide, and not all banks would necessarily have the same level of exposures. Another area where we think better data is needed.  Also, what happens if off-the-plan purchasers walk away before completion?

The large number of new apartments recently completed and currently under construction in many capital cities raises the risk of a marked oversupply in some geographic areas. The banking system’s exposure to these apartment markets arises from its financing of apartment construction as well as lending to the purchasers of the apartments once construction is complete. This box examines the banking system’s development and mortgage exposures in the inner-city areas of Brisbane, Melbourne and Sydney, where apartment construction has recently been most concentrated.

As indicated here, if apartment market conditions were to deteriorate in these inner-city areas it is more likely that banks would experience material losses on their development lending rather than on their mortgages. This is because of both a higher probability of default and higher loss-given-default on their development lending than on their mortgage lending for apartment purchases. However, while this box examines the situation for the Australian banking system as a whole, individual banks may have more concentrated exposures in certain geographic areas, including exposures to riskier or lower-quality developments, and hence it is unlikely that losses would be evenly distributed across the banking system if a downturn were to happen.

Current Market Conditions

Following the marked pick-up in apartment construction in recent years, inner-city Melbourne is forecast to have the largest number of completions (around 16 000) over the next two years, followed by Brisbane (12 000) and Sydney (10 000) (Figure B1a, Figure B1b, Figure B1c).

rba-exposure-b1arba-exposure-b1brba-exposure-b1cIn Brisbane and Melbourne these new apartments will represent a far larger increase in the dwelling stock than in Sydney. Furthermore, apartment price and rental growth in Brisbane and Melbourne are relatively subdued – notwithstanding some strengthening in rents in Melbourne of late – and rental vacancy rates are higher than in Sydney (Graph B1). It is therefore foreseeable that these additions to the stock will have a greater effect on housing market conditions in these areas.

rba-exposure-b1Exposures

The routine regulatory data disclosures do not require banks to report their exposures by geographic region. Nonetheless, data on banks’ total Australian mortgage and development lending – along with data on construction activity, housing prices and buyer profile in these areas – can provide some rough estimates of the magnitude of these exposures and hence a broad indication of how exposed banks are to a downturn in these markets.

Overall, these estimates suggest that, by value, banks are most exposed to inner-city housing markets through their mortgage lending rather than via their development lending (Graph B2). The data suggest that around 2–5 per cent of banks’ total outstanding mortgage lending is to inner-city Brisbane, Melbourne and Sydney, and this share is likely to grow as the apartments currently under construction are completed. At around $20– 30 billion, mortgage exposures are estimated to be larger in Sydney, reflecting Sydney’s higher apartment prices and greater number of mortgaged dwellings, than in Brisbane and Melbourne where mortgage exposures are estimated at around $10–20 billion in each inner-city area. By contrast, the available data suggest that around one-fifth of banks’ total residential development lending is to these areas. Development exposures are a little larger in Melbourne and Brisbane than in Sydney, due to the greater volume of apartment construction currently underway, though they are each less than $5 billion.

rba-exposure-b2Potential Losses

Banks would experience losses on these exposures in default events where the value of the properties is insufficient to cover the debt outstanding. Australian mortgage lending has historically had very low default rates – around ½ per cent – and had high levels of collateralisation. In Sydney in particular, a very large price fall would be required before the banks would experience sizeable losses, since the rapid price growth over recent years has increased borrowers’ equity in their apartments and thereby lowered banks’ losses-given-default.

In contrast, inner-city Melbourne and Brisbane have experienced far less price growth, limiting borrowers’ accumulation of equity. To gain a broad indication of the size of potential losses to banks, one can consider a hypothetical scenario where default rates rose to between 5 and 15 per cent on inner-city mortgages, and then combine this with a range of housing price falls. Under this scenario, bank losses remain very low until price falls reach over 25 per cent or so (Graph B3).

rba-exposure-b3Repeating this scenario for developer exposures is challenging, because the exposures are more idiosyncratic and the largest losses can be on incomplete developments. In addition, the average level of developer equity in their apartment projects is not readily available and anecdotal evidence suggests that it varies significantly by building. A simple way to model potential losses on developer lending is to use loss rates in line with those seen on all Australian residential development lending during the financial crisis.

In this scenario, losses still remain fairly small (Graph B4). Alternative comparisons are the Spanish and Irish financial crisis experiences, which were associated with housing price falls of more than 30 and 50 per cent, respectively, and impairment rates on commercial property of over 30 per cent.

rba-exposure-b4In these situations, the losses to banks would be several times larger than the recent Australian experience. However, Australia is not facing the same economic and financial headwinds as Spain or Ireland did during the financial crisis, where the extent of overbuilding was much greater and prevalent across their entire countries, contributing to very sharp deteriorations in economic conditions. More likely, any oversupply in Australia would be more localised to certain geographic areas, and potential price falls tempered as the population moved to absorb the new (and cheaper) supply of housing in these areas over time.