Latest Auction Results Firm

The results from the APM PriceFinder residential auction activity for Saturday, 16 July 2016, shows continued strong momentum. Nationally, clearances were at 75.5%, compared with 69.8% last week, which is the same as a year ago, though on lower volumes. Melbourne was above 80% this week, higher than this time last year.  In comparison, Adelaide was just 47% and Brisbane 51%.

APM-16-Jul-1APM-16-Jul-2

Just building more homes won’t fix the housing crisis – here’s why

From The Conversation.

In major cities across the globe – from London to Manila, Auckland to Los Angeles – housing is becoming less and less affordable. This has caused a great deal of angst over house prices. But so far, politicians and the media have been much more effective at whipping up public anxiety, than putting in place actual solutions.

Over-inflated house prices are caused by more than just supply and demand. Policy changes often focus too narrowly on increasing housing supply, by opening up more land for development and speeding up the planning process. Of course, supply is important. If more people want to buy houses than there are houses available then prices may be forced upward.

But it is not enough to address only one cause. Another major driver of price increases is a housing market “bubble”. A bubble can be detected when property prices increase significantly faster than rents. In investment terms, this means you’re buying a more expensive asset, but it doesn’t give a higher return from rental income.

When prices are rising rapidly, buyers tend to anticipate that this will continue, guaranteeing a tidy profit when they eventually sell the property. Add record low interest rates and the resulting abundance of low-cost debt means that house prices can easily become over-inflated, relative to people’s incomes.

The 2013 Nobel Prize-winner Robert Shiller theorised this buyer behaviour and called it “irrational exuberance”. Housing markets in many cities across the globe are stubbornly following Shiller’s theory. As a bubble grows, more people are priced out of the market for buying property, while the apparent urgency to get onto the property ladder increases. Even if housing supply is increasing, the expectation of increasing property values will continue to drive this kind of behaviour in the market.

It is thought that London alone requires 42,000 new homes each year, based on population estimates. Between 2001 and 2011, Greater London’s population increased by 12.6%, while housing supply grew only 7.5%. It is only physically possible to meet this demand by putting more people into existing houses, leading to overcrowding, which is harmful to health and well-being.

So, building more houses won’t discourage irrational investment on its own. In fact, it might encourage more people to take on debt and invest in an over-valued housing market. If the bubble bursts – which would most likely be caused by a recession, or an increase in the cost of debt – prices will undergo a “correction”. Whether this correction is large or small, the financial impact on households and the threat to the stability of the national economy are significant.

How to rent a home

To diffuse this situation, we need to question our common assumptions about housing. The key role of housing is to meet the basic human need for safe and secure shelter. Housing policies mostly assume that home ownership is the only way to do this.

This idea has its roots in the post-war era, when governments promoted the idea of owning your own home, as the mark of financial security. Home ownership is not wrong – although households should seriously consider the risks of taking on large, long-term debts. But arguably, it isn’t an appropriate one-size-fits-all solution for cities in 2016.

Not ideal. from www.shutterstock.com

So, what other options do we have? For starters, better rental regulations could allow for long-term tenure and provide better protection for tenants. In Germany, only 39% of the population owns their own home, compared with roughly 60% in the UK.

But they also rent under very different conditions to people in the UK. Local governments can limit the rate of rent increases, and tenants have more rights to occupy a property over a long-term period. These arrangements make renting a viable option for people looking for long-term accommodation, which frees up household income to invest in other assets, with lower risk.

The real crisis

There are even more inventive ways to emphasise the importance of access to shelter, over and above home ownership. For one thing, there are some creative and forward-thinking design solutions on show at this year’s “Home Economics” display, at the Venice Biennale.

But we also need to rethink the way we plan our cities. In reality, the housing crisis stems from the fact that house building is left largely to the private market. Private developments don’t always include smaller, more modest homes for low-income households as well as expensive homes for the wealthy (the latter are usually more profitable). A survey of developments between 2014 and 2015 found that only 20% of the total number of homes built were deemed to be “affordable”.

Local governments require a certain share of new houses to cater to those on low incomes, but these affordable housing requirements are notoriously weak, too. In London, as little as 12% of dwellings in new developments need to be “affordable” – a classification which allows rents as high as 80% of market rate. In some cases, the price of a home deemed “affordable” was equal to 30 times the average UK wage.

Policies focused purely on expanding supply, without catering to different income groups, ignore the fact that cities depend on people who earn many different levels of income to provide key services. There are wider costs to society if cleaners, bar staff, creatives, cashiers and nursery assistants cannot afford to live in urban areas. Even if cheaper accommodation is available on the outskirts, this won’t offer a solution if commutes are long and costly.

We don’t know how or when the UK’s housing market bubble will burst, or how much prices might fall when it does. For the moment, those who don’t own property can take comfort in the fact that they aren’t taking on a mortgage in an overvalued property market. Meanwhile, leaders need to consider more innovative housing options, which focus on access rather than ownership. They need to provide meaningful alternatives for people on low incomes – or risk driving them out of our cities altogether.

Author: Jenny McArthur, PhD candidate, infrastructure investment, urban growth and liveability, UCL

Auction Volumes Down Last Saturday

According to CoreLogic, 70.7 per cent of capital city auctions were successful this week, according to preliminary results. This week’s result indicates an upwards shift in the auction clearance rate from last week, when 66.4 per cent of auctions were successful and is also higher than the clearance rate recorded over the first month of winter 2016 (67.1 per cent). The number of residential auctions held this week was 811, down substantially from 2,218 last week. At the same time last year, 1,674 capital city auctions were held with 76.8 per cent clearing.

20160704 capital city

Auction Clearances Still Buoyant

The latest data from APM PriceFinder shows that last Saturday, 2nd July, despite the election distraction, national clearances were at 70%, compared with 64.9% last week, though on much lower volumes for obvious reasons. Compared with this time last year numbers are down a little, but clearly there is still appetite for property.

APM-2-JulyAPM-2-July-1

A Two Speed Home Market

The CoreLogic June Home Value Index results reported a 0.5% rise in capital city dwelling values over the month with five capitals recording a fall in dwelling values while Sydney, Melbourne and Hobart values show another substantial rise.

Home-Prices-June-2016Higher dwelling values across Australia’s two largest capital cities continued to push the CoreLogic Hedonic Home Value Index to new record highs, with dwelling values across the combined capital cities rising by 0.5% in June to be 8.3% higher over the past twelve months.

The June results continued to show a rebound in housing market conditions after CoreLogic reported weaker results for the final quarter of 2015 when the combined capitals’ index was down 1.4%. CoreLogic Asia Pacific research director Tim Lawless said,

“Importantly, the pace of capital gains in June was substantially lower than the April and May results when CoreLogic reported a 1.7%, and 1.6% month-on-month lift in capital city dwelling values.”

“The monthly growth rate reduction is likely to be very much welcomed by state and federal government policy makers and regulators who may be concerned about a sustained rebound in capital gains.”

“As an example, home values in Sydney have been rising for four years, and have increased by a cumulative 59% over this time frame. Melbourne dwelling values have been rising for the same length of time and have moved 41% higher over the growth cycle to date.”

“The combined capitals’ headline result was driven by a strong 1.2% rise in Sydney dwelling values, and a 0.8% gain across Melbourne’s housing market. Hobart values also showed strong conditions with dwelling values moving 1.8% higher over the month,” Mr Lawless said.

Although the headline results are positive, five of Australia’s eight capital cities recorded a decline in dwelling values in June. Monthly declines of more than 1% were recorded in Darwin (-1.6%), Adelaide (-1.3%) and Canberra (-1.1%), while the falls in Brisbane (-0.1%) and Perth (-0.8%) were less severe.


Income, Credit and Home Prices Out of Kilter

In this post we combine the latest data from the RBA and ABS, and our own analysis to look at the relationship, at a state level, between income growth, home price growth and credit growth. These three elements should logically be closely meshed, yet in the current environment, they are not. We think this is an important leading indicator of trouble ahead as these three factors will come back eventually to a more normal relationship, signalling potential falls in home values and credit volumes in a low income growth environment.

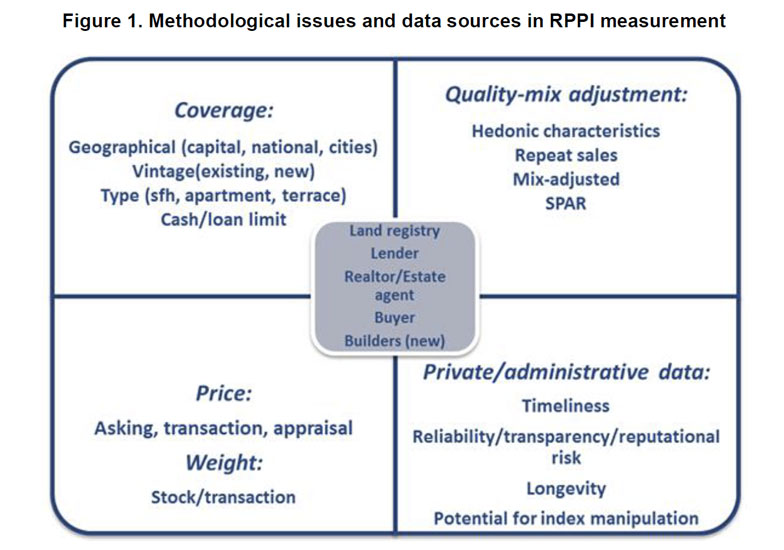
The latest data from the ABS shows that home prices fell slightly in the past quarter. The Residential Property Price Index (RPPI) fell 0.2 per cent in the March quarter 2016, the first fall since the September quarter 2012. Attached dwellings, such as apartments, largely drove price falls in the RPPI.  The attached dwellings price index fell 0.8 per cent in the March quarter 2016. Falls were recorded in Melbourne (-1.3 per cent), Sydney (-0.6 per cent), Perth (-1.1 per cent), Canberra (-1.1 per cent) and Adelaide (-0.4 per cent). Brisbane (+0.7 per cent), Hobart (+2.3 per cent) and Darwin (+0.1 per cent) recorded rises. Established house prices for the eight capital cities was flat (0.0 per cent).  The total value of Australia’s 9.7 million residential dwellings increased $15.4 billion to $5.9 trillion. The mean price of dwellings in Australia is now $613,900.

The RBA minutes also out today had a couple of interesting comments.

Dwelling investment had continued to grow strongly over the year, consistent with the substantial amount of work in the pipeline noted in previous meetings. Members observed that private residential building approvals had increased strongly in April, to be close to peaks seen earlier in 2015. Although these data are quite volatile from month to month, the trend for building approvals had been stronger than expected of late and the pipeline of residential work yet to be done had remained at high levels. This implied that growth in new dwelling investment would continue to add to the supply of housing over the next year or so, particularly in the eastern capitals.

In established housing markets, prices increased significantly in Sydney and Melbourne over April and May and, to a lesser extent, in a number of other capital cities. Auction clearance rates and the number of auctions increased in May, but remained lower than a year earlier. At the same time, the monthly data available for April showed that there had been a further easing in housing credit growth and the total value of housing loan approvals, excluding refinancing, had fallen in the month. Members noted that the divergence in the trends in housing price and credit growth was not expected to persist over a long period of time.

We already know that income growth is static.

So this got us thinking about the relationship between income, home price growth and credit growth. To look at this, we drew data from our surveys, and also the ABS and RBA data-sets, to map the relative cumulative growth of average household income, home price growth and credit growth. The results are interesting. We used 2006 as a baseline and measured the relative cumulative growth since then, by state.

First, here is the average across Australia. The growth of credit since 2006 (the yellow line) is significantly stronger than home prices and income. Income is notably the slowest. This is course confirms what we know, households are more leveraged (highest in the western world), and home prices are higher relative to income, supported by credit availability and more recently low interest rates. Note also the recent slowing in credit growth.

Credit-Price-and-Income-Trends---AllLooking at the state variations is really insightful. In the ACT credit growth is very strong, but home prices and incomes are moving at a similar trajectory. This is partly because of the micro-economic climate supported by well paid public servants.

Credit-Price-and-Income-Trends---ACTIn NT, home price growth is higher than credit and income growth, but the growth is beginning to slow, in response to the mining slow down. Home prices are significantly extended relative to incomes.

Credit-Price-and-Income-Trends---NTIn TAS, home prices are tracking incomes, whilst credit has been growing more slowly, thanks to lower price growth and local demographics.

Credit-Price-and-Income-Trends--TASIn WA, we see significant home price momentum through the mining boom years, but it is now adjusting, and credit which has been strong has been easing in the past 12 months. Home price growth is now tracking income growth.

Credit-Price-and-Income-Trends---WAIn SA, credit is quite strong now, and we are seeing home prices moving ahead of incomes, as they did in 2010, but only slightly.

Credit-Price-and-Income-Trends---SAIn QLD, credit is growing faster now, and home prices are moving faster than incomes, there is an interesting dip in 2011-12, thanks to some “local political difficulties!”

Credit-Price-and-Income-Trends---QLDVIC holds the award for the strongest credit growth in recent time, and as a result we see home prices moving ahead of income growth, a trend which can be traced back to before the GFC.

Credit-Price-and-Income-Trends---VICFinally, in NSW, we see a dramatic run up in credit and home prices, especially since 2013. Both are growing faster than incomes. Prior to this, income growth and home prices were more aligned.

Credit-Price-and-Income-Trends---NSWSo a few observations. Incomes and home prices, and credit are disconnected, significantly. This is a problem because credit has to be repaid from income, in some way, at some time. Next, there are strong correlations in some states between credit growth and home prices, in other states it is less clear. NSW and VIC have the largest gaps between income and prices. So it reconfirms the property markets are not uniform. Finally, and importantly, we think that home price and credit growth will have to come back to income growth – and as incomes will be static for some time, downward pressure on home prices and credit will build, especially if the costs of borrowing were to rise.

Home Prices Higher In May

The latest home price data from CoreLogic RP Data shows that dwelling values across the combined capital cities of Australia rose by 1.6% in May with house values driving most of the capital gains, up 1.8% compared with a 0.1% rise in unit values. The strong May numbers were largely the result of a surge in Sydney dwelling values which were up 3.1% over the month. A rise of more than 1% month-on-month was also recorded in Melbourne (1.6%), Canberra (2.5%) and Hobart (2.2%). Perth was the only city to record a fall in dwelling values over the month, down 2.7%.

CoreLogic-May-2016The CoreLogic combined capitals index has recorded a 5.0% increase since the beginning of January and as a result, has caused the annual trend in capital gains to rebound after conditions tapered since July last year. The annual rate of growth, which recorded a recent trough in December last year at 7.4%, has since rebounded back to 10.0% at the end of May.

After such a strong performance across the Sydney housing market, the annual rate of growth has moved substantially higher to reach 13.1% per annum after reaching a recent low point of 7.4% per annum growth over the 12 months ending March 2016. Despite Sydney’s bounce in the trend rate of growth, Melbourne’s housing market is still recording the highest annual rate of capital gain at 13.9%.

Perth and Darwin remain the only markets to record an annual decline in home values. Perth dwelling values are down 4.2% over the past year and have recorded a peak to current fall of 6.7%. Similarly, Darwin dwelling values fell by 3.5% over the past year and are down 5.5% since peaking two years ago.

The current growth cycle has been running for four years now. After capital city dwelling values fell by 7.4% between October 2010 and May 2012, values have since risen by 36.6% over the growth cycle to date. The largest capital gains over the cycle to date have been in Sydney where dwelling values are 57.5% higher followed by Melbourne with a 39.4% capital gain since values started rising. The third strongest performance has been in Brisbane at 18.5%. The rebound in the rate of capital gain during 2016 is supported by other measurements in the market. Auction clearance rates across the combined capital cities have remained stable and hovered around the high 60% to low 70% range since February this year. Sydney clearance rates remain firm, sitting at around the mid 70% mark over the past three weeks while Melbourne clearance rates now sit in the early 70% range.

The herd driven housing bubble that could trigger an apartment bust

From The Conversation.

The price gap between houses and apartments in many Australian cities is closing as property investors exhibit a significant degree of herding behaviour, according to new research.

The research comes amid speculation that Australia is in a housing bubble. Herding behaviour is leading to excessive borrowing, further fuelling apartment prices, particularly in Sydney.

A major cause of the sub-prime crisis in the US was a herd mentality, in which home buyers were influenced by purchasing behaviour of others. More recently a widely publicised 2015 report by global fund manager PIMCO suggested that low interest rates and rising house prices in Australia were driving similar behaviour.

We examined whether there was formal evidence of a herd mentality in Australian metropolitan property markets. To do so, we looked at the dynamic interaction between house prices and apartment prices in Australian capital cities using monthly CoreLogic RP Data from December 1995 to June 2015.

Figure 1. Monthly house and Apartment prices (December 1995- June 2015) Note: Green dotted lines show the narrowing of the pairs over time. CoreLogic RP Data

Figure 1 shows house and apartment prices exhibit a strong degree of co-movement and both prices tend to deviate from each other quite often. Nevertheless, every now and then the price gap has narrowed.

Except for Canberra, in all cities the narrowing takes place after a long period of widening. There are at least two reasons why there is a long-run relationship between house and apartment prices. First, houses and apartments are considered as substitutable investments. Second, negative gearing and capital gains provisions encourage people to borrow against the equity in their home to purchase an investment property, which is typically an apartment. When the price of the family home increases, this boosts demand for apartments, pushing up their price as well.

We found that in some cities such as Sydney, investors can equally profit by purchasing apartments because rising house prices eventually push up apartment prices and vice versa.

We found house prices significantly affect apartment prices across all cities. But in only four cities (Adelaide, Melbourne, Perth and Sydney) apartment and house prices influenced each other equally. However, when apartment prices are on the rise (i.e. the market is bullish), the positive impact of house prices on apartment prices is substantially larger. This implies that investors exhibit a significant degree of herding behaviour. Such evidence of herd mentality is highest in Sydney and lowest in Darwin.

Our finding for Sydney is consistent with a widely accepted view by RBA officials who argue that prices have grown too fast and there is a housing bubble threatening to burst. Vernon Smith, who won the 2002 Nobel Prize in Economics and visited Australia in July 2015, also recently said Sydney house prices are in a bubble.

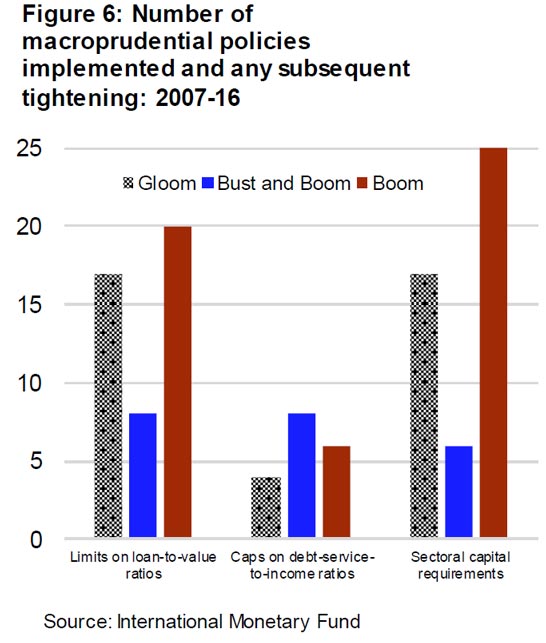
There are various ways in which this herd mentality might be reined in, including adjusting interest rates, tightening lending criteria, changing negative gearing and reforms to self-managed superannuation. Some of these initiatives have already been introduced.

In order to address a similar problem, in February 2014 Canada decided to ban rich foreign nationals from purchasing property and, as a result, some turned to Australia as their next favourite destination.

Although Australia has partially recognised this issue by prohibiting the purchase of established properties by foreign investors, there still remains several loopholes that go undetected, making housing extremely unaffordable for young Australians. This has increased intergenerational inequality between millennials and baby boomers that policy makers must be brave enough to make hard decisions about based on evidence rather than election outcomes.

Authors: Abbas Valadkhani, Professor of Economics, Swinburne University of Technology; Russell Smyth, Professor, Department of Economics, Monash Business School, Monash University

RBA FOI on Negative Gearing and Investment Properties

Under a freedom of information request, the RBA has just released some material which casts light on their perspective on investment property and negative gearing from the Financial System Inquiry.

There are a few interesting points.

  • Whilst tax reform is an issue for Government, the RBA has noted that concessional rates of taxation of capital gains might encourage leverage speculation, especially in combination with negative gearing provisions.
  • Risks have been building in investor housing (no coincidence, this is happening at a time when some other asset classes have seen modest/volatile returns).
  • Negative gearing and capital gains concessions could together encourage “leveraged and speculative investment in housing” – including bidding up house prices, risks to financial stability if prices were to fall, and a rise in interest only loans (which do not repay capital so do not build an equity buffer).
  • If changes were made to these policies, it might increase rents, and if the arrangements were not grandfathered, could lead to the large-scale sale of negatively geared properties.

Note: Labor’s proposals, of course include grandfathering.


Has housing in-affordability in Australia’s capitals peaked?

From Business Insider.

Australian housing affordability deteriorated over the past 12 months, but the worst may now be over.

That’s the view of Natsumi Matsuda, an analyst at Moody’s Investor Services, who notes that Australian two-income households spent an average 27.6% of their monthly income on mortgage repayments in the 12 months to March, up from 27.0% a year earlier.

“Affordability deteriorated in all capital cities, except Perth,” said Matsuda. “Sydney (35.6% of income) is the most unaffordable city, followed by Melbourne (30%).”

The chart below, supplied by Moody’s shows the percentage of household income spent on mortgage repayments in Sydney, Melbourne, Brisbane, Adelaide and Perth over the past decade.

“Nationally, affordability remains better than the average for the past 10 years. However, homeowners in Sydney are paying 1.7 percentage points more of their monthly incomes towards mortgage repayments than the average for the past 10 years,” notes Matsuda.

Despite the improvement over the past 12 months, he believes that housing costs may have peaked due to a pullback in housing prices (something that subsequently reversed in April according to Corelogic RP Data) along lower mortgage rates courtesy of the Reserve Bank of Australia’s rate cut earlier this week which took the official cash rate to a historic low of 1.75%.

She explains:

Although housing affordability deteriorated year-on-year, conditions began to improve in the three months to 31 March 2016, suggesting that repayment costs may have peaked for the time being. In fact, affordability improved in all Australian capital cities during this period, although the degree was not enough to head off the year-on-year deterioration.

The improvement over the three months to 31 March 2016 was driven by a pullback in housing prices. The Reserve Bank of Australia’s (RBA) cut to official interest rates on 3 May 2016 will have a further positive influence on housing affordability, though the extent of this impact will ultimately depend on whether there are any flow-on effects to the housing market, where lower rates can put upward pressure on prices.

The debate over housing in Australia — something of a constant nowadays — has intensified in recent weeks as both the Coalition and Labor debated negative gearing, with the government arguing that any changes could lead to a dramatic fall in house prices.

But yesterday prime minister Malcolm Turnbull appeared to suggest that if younger generations are locked out of the housing market, then it’s up to their wealthy parents to help them out, telling ABC radio presenter Jon Faine “you should shell out for them; you should support them, a wealthy man like you”.

While prices continue to trend higher, building approvals have also risen for two months in a row and now new home sales have bounced.

Housing Industry Association (HIA) figures released today show new property sales surged by 8.9% in March after seasonal adjustments, rebounding strongly following a 5.3% contraction in February. It was the largest percentage increase since January 2010.