ABC Four Corners Does The Housing Boom

Last night the ABC aired a programme on the housing boom. It focused on the impact property investors are having on driving home prices higher and making access to property ever more difficult for owner occupied purchasers who are trying to enter the market. Whilst there was little that was new to followers of this blog, one segment looking at the high rate of vacant units in the Melbourne high-rise developments was striking.

Also, there was evidence of applications being “tweaked” to make incomes higher, such that a loan would pass underwriting muster. Some are suggesting this is a prevalent practice, and links to poor bank culture.

You can read the transcript across at the ABC site, and watch the programme (if you are not Geo-blocked).

Here is the segment on Melbourne’s ghost apartments.

I think the missing element for me was the fact that this is an intentional strategy, led by the Reserve Bank to make housing, and households do the heavy lifting as the mining boom fades. No surprise then that loan to income ratios are off.

The long term implications of this policy have yet to come home to roost.

Where To With Hobart Home Prices?

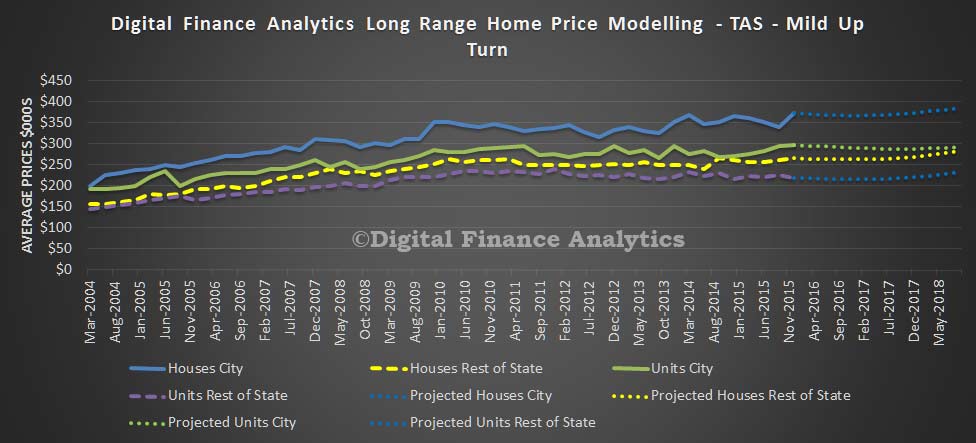
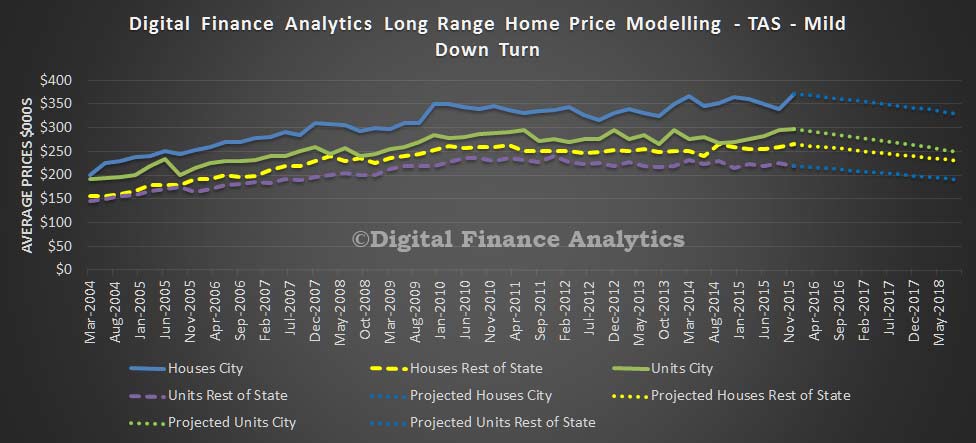
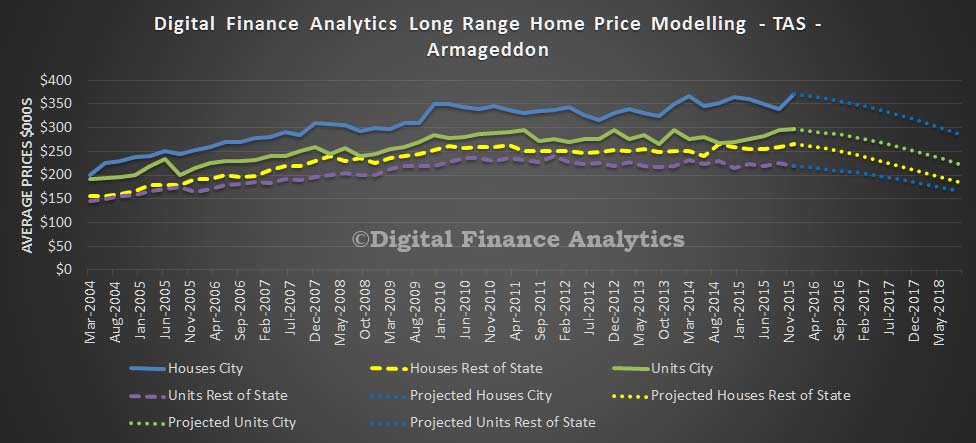
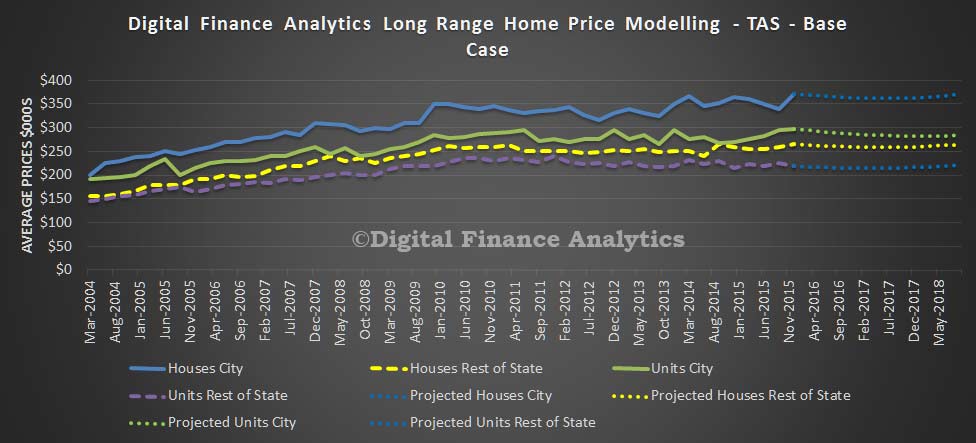
As we continue our state by state scenario analysis – read about our assumptions here – we look at Tasmania. Given the low transaction volumes, our results will be more noisy. That said, in our base case to mid 2018, we expect to see the average house price in Hobart fall by 0.2% to $371,000 and the average unit price in Hobart fall by 4.1% to $285,000. In the regional areas, the average house price will fall by 0.3% to $264,000 and units will rise 0.8% to $221,000.

TAS-Apr-2016---BaseIf economic activity picks up to mid 2018, we expect to see the average house price in Hobart rise by 3.6% to $385,000 and the average unit price in Hobart fall by 1.9% to $291,000. In the regional areas, the average house price will rise by 6.6% to $283,000 and units will rise 5.7% to $231,000.

TAS-Apr-2016---UpIf economic activity slows to mid 2018, we expect to see the average house price in Hobart fall by 11.3% to $329,000 and the average unit price in Hobart fall by 16.2% to $249,000. In the regional areas, the average house price will fall by 13.3% to $230,000 and units will fall 13.4% to $190,000.

TAS-Apr-2016---DownIf economic activity falls significantly to mid 2018, we expect to see the average house price in Hobart fall by 23.0% to $286,000 and the average unit price in Hobart fall by 24.6% to $224,000. In the regional areas, the average house price will fall by 30.3% to $185,000 and units will fall 23.7% to $167,000.

TAS-Apr-2016---Fall

Global House Price Index Falls – IMF

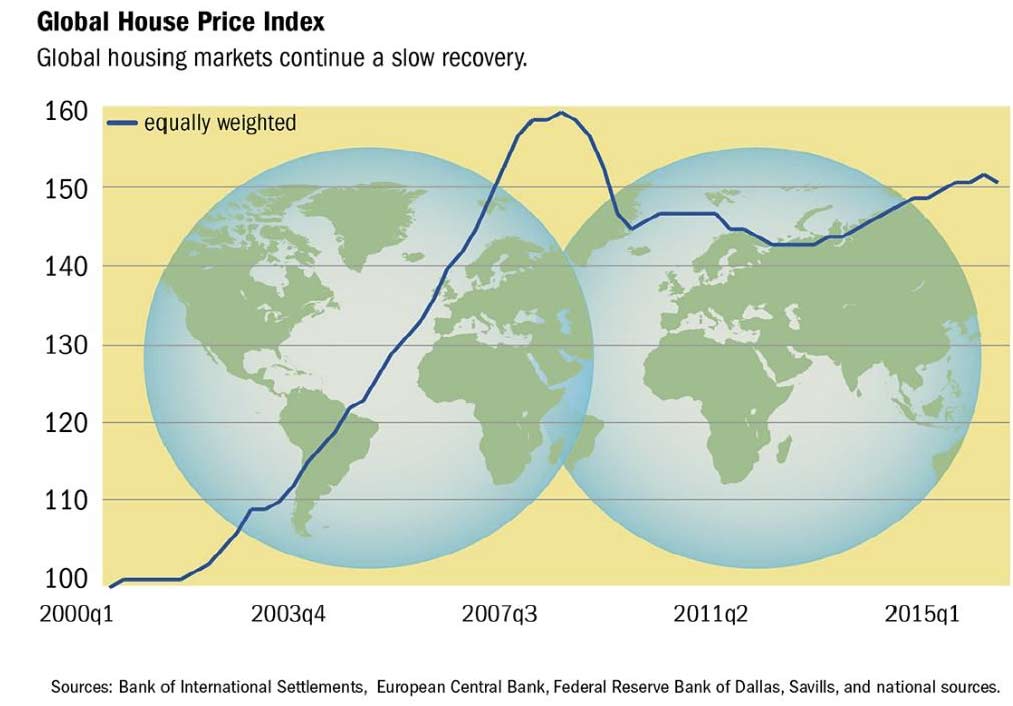
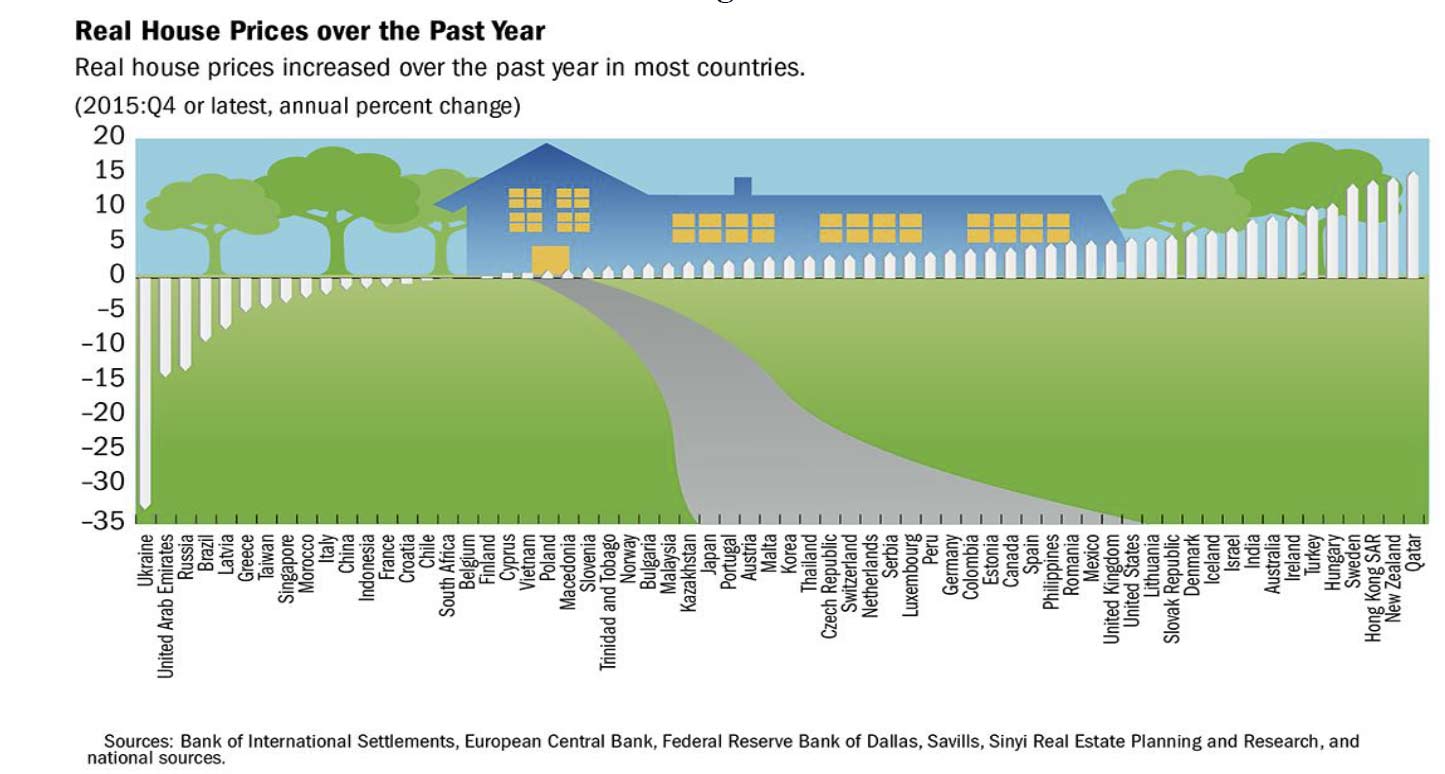
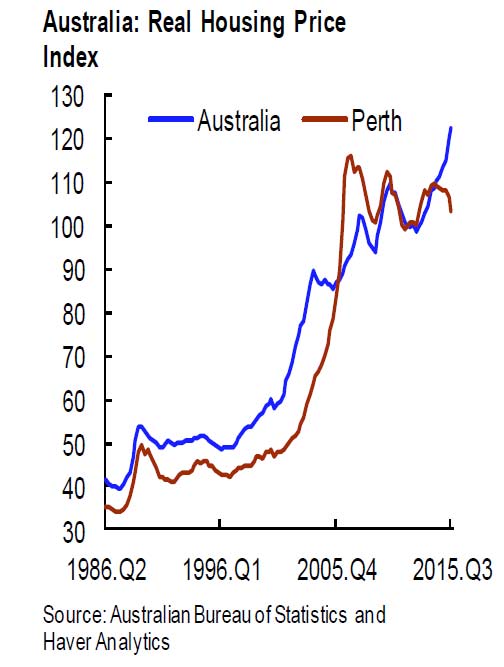
The IMF Quarterly Update includes an update of the Global House Price Index.  In Australia, the aggregate house price index has been rising in a strong but volatile pattern for the past twenty-five years, and has enjoyed a particularly strong burst of growth since 2013. However, house prices in Perth—surrounded by major mining and petroleum industries and known for providing services to these industries—are declining.

After sixteen quarters of inching upwards, the global house price index shows a small downtick. But it is too soon to tell if this is a reversal in trend.

IMF-Apr-01Over the past year, many more countries have registered house price increases than declines. Australia is the eighth highest (well behind New Zealand!)

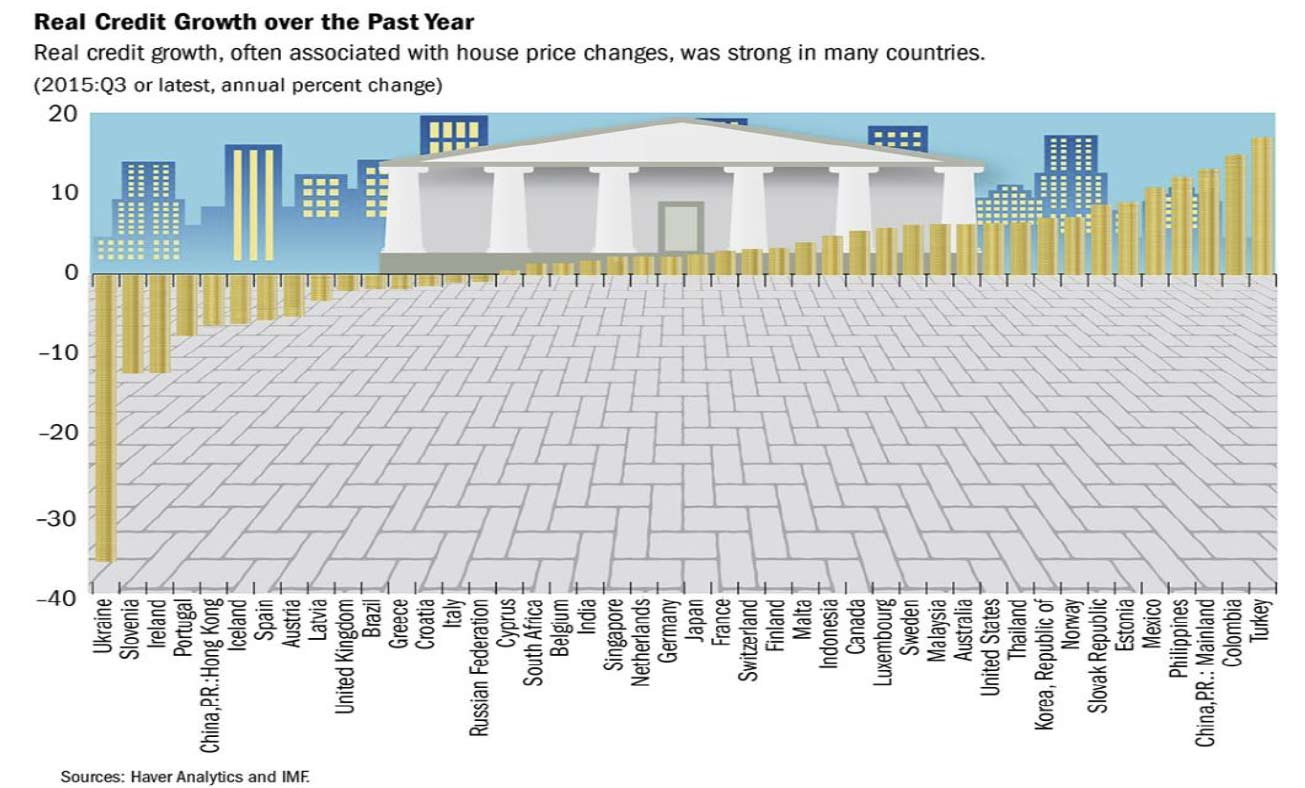
IMF-Apr-16-02Credit growth has also remained strong in many countries, though the overall correlation with house price growth at present is modest. Australia is twelfth, behind USA and Norway.

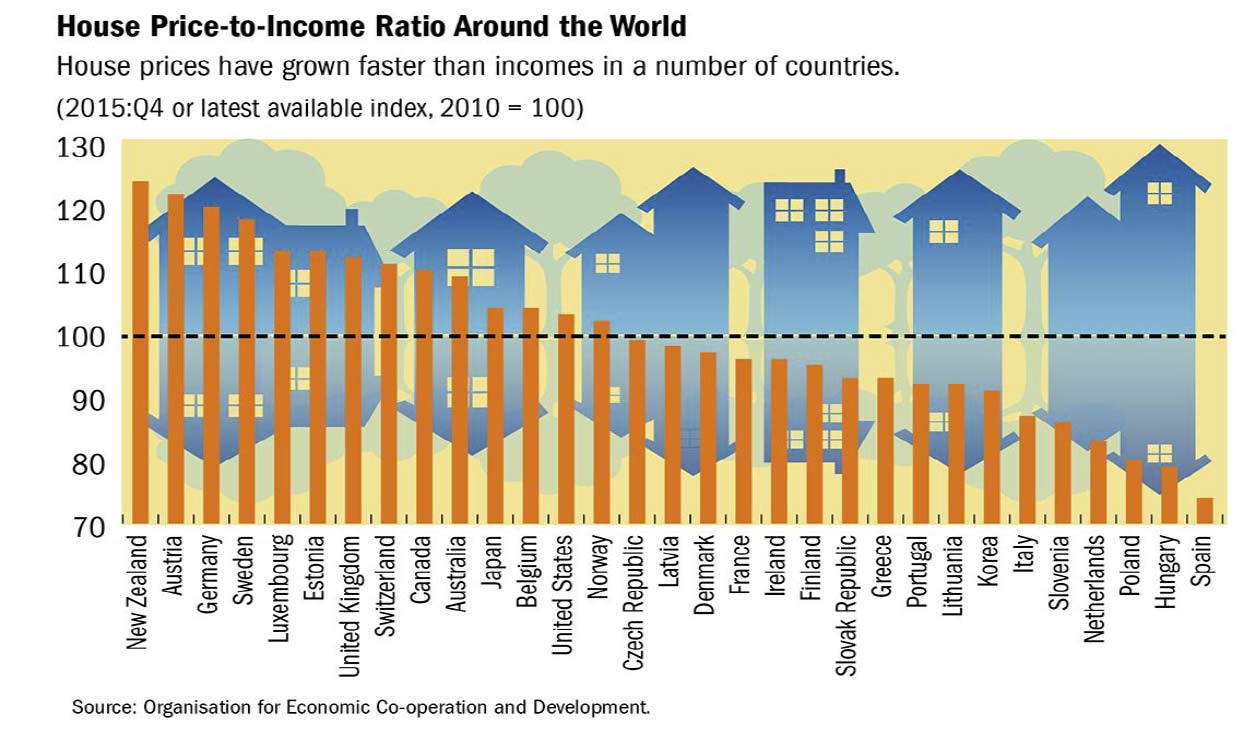
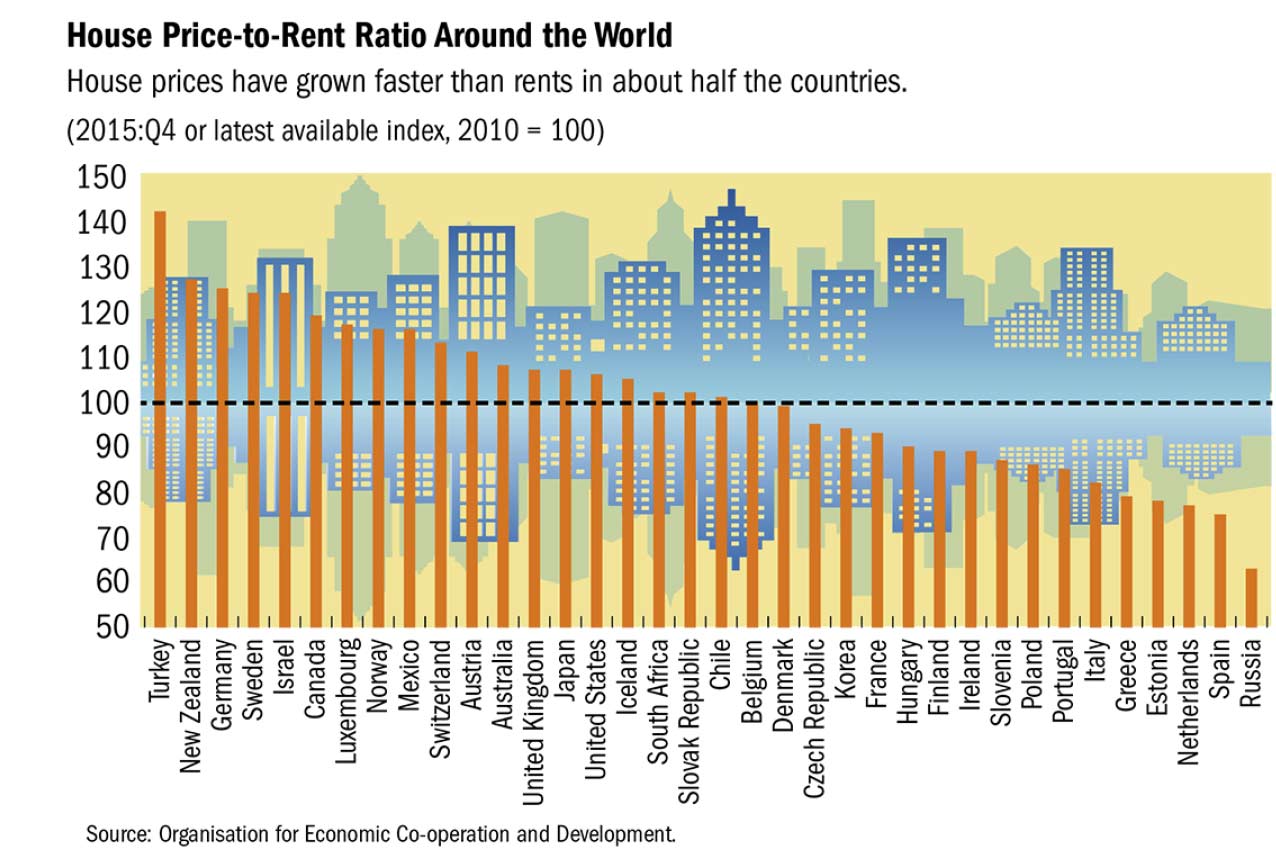
IMF-Apr-16-03Among OECD countries, house prices have grown faster than incomes ( Australia ninth highest) and rents since 2010 in about half the countries (Australia twelfth highest).

IMF-Apr-16-04IMF-Apr-16-05The decline in commodity prices does not seem to be affecting national house prices but is having some effect in regions and cities within countries.

IMF-Apr-16-06


Where To With Adelaide Home Prices?

As we continue our state by state analysis, today we look at South Australia.

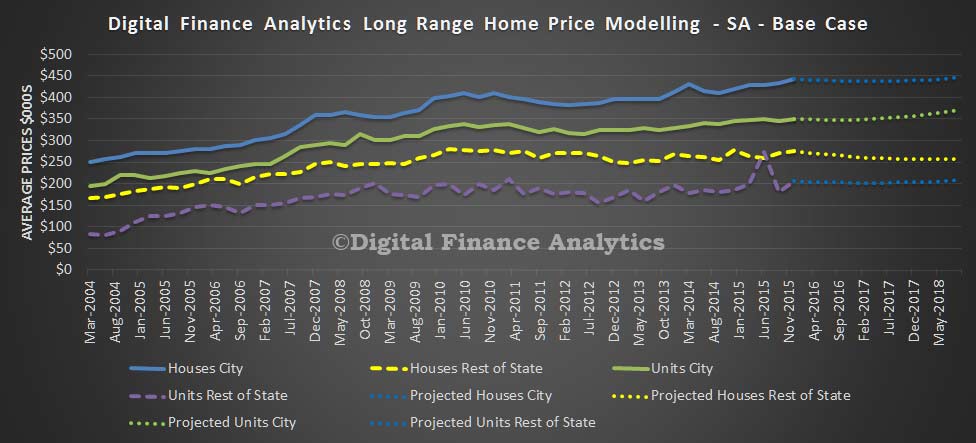
In our base case to mid 2018, we expect to see the average house price in Adelaide rise by 0.8% to $446,000 and the average unit price in Adelaide rise by 5.9% to $371,000. In the regional areas, the average house price will fall by 7.0% to $256,000 and units will rise 1.1% to $208,000.

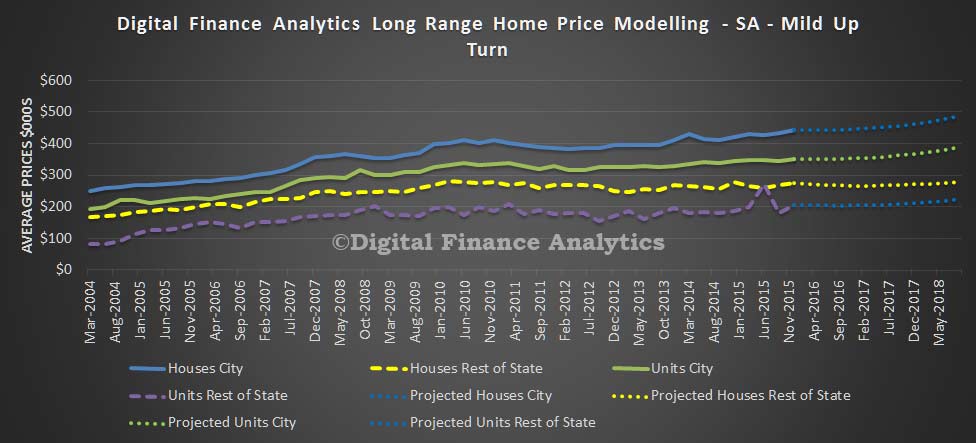
SA-Apr-2016---BaseIf economic activity picks up to mid 2018, we expect to see the average house price in Adelaide rise by 9.9% to $487,000 and the average unit price in Adelaide rise by 10.7% to $387,000. In the regional areas, the average house price will rise by 1.4% to $279,000 and units will rise 8.8% to $224,000.

SA-Apr-2016---UpIf economic activity slows to mid 2018, we expect to see the average house price in Adelaide fall by 10.3% to $397,000 and the average unit price in Adelaide fall by 7.1% to $325,000. In the regional areas, the average house price will fall by 18.1% to $226,000 and units will fall 11.9% to $182,000.

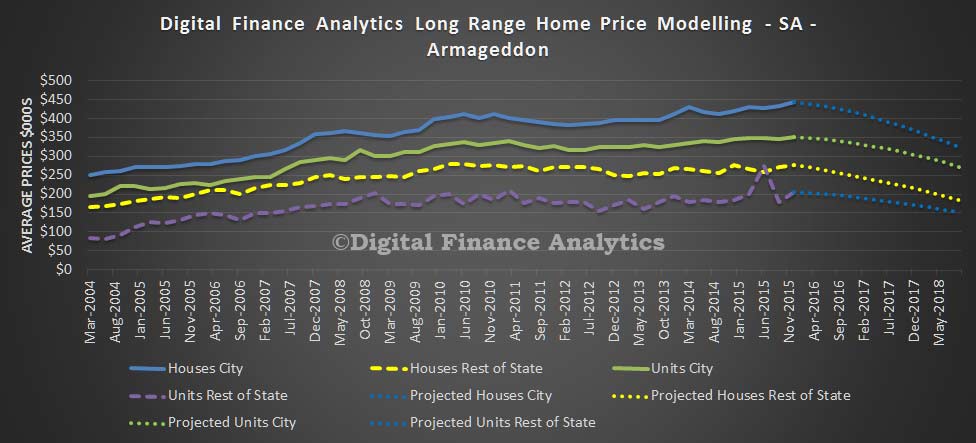
SA-Apr-2016---DownIf economic activity falls significantly to mid 2018, we expect to see the average house price in Adelaide fall by 26.7% to $324,000 and the average unit price in Adelaide fall by 22.2% to $272,000. In the regional areas, the average house price will fall by 33.1% to $184,000 and units will fall 25.8% to $153,000.

SA-Apr-2016---Fall  A reminder. This modelling is wrong, but is designed to illustrate the relative sensitivities in different scenarios!


The way Australia taxes housing is manifestly unfair

From The Conversation.

When politicians talk about tax and fairness, it’s easy for them to point out undeserved loopholes benefiting the wealthy, or multinational companies. But the elephant in the room is the difference between those who own and those who rent (or have recently bought and have huge mortgages) the house they live in.

The tax advantages of housing offend against justice on every count: they place financial stresses on the poor, they are unequal, and the increase in price is not deserved.

Owner-occupied houses are exempt from income and capital gains tax, and from social welfare means tests. Negative gearing gives investment properties a tax advantage, which is exacerbated by discounts on rates of capital gains tax. Rent assistance given to those on social security (currently a maximum of A$130 per week) is not sufficient to compensate for the difference.

The high price of housing is created by tax inequalities and by supply and demand imbalances created by government failure. At the same time, the government has encouraged banks to borrow hundreds of billions offshore to fund greater mortgage debt – pushing prices higher. Foreign depositors are faced with a low 10% withholding tax (reduced from 15%), and have not been subject to adequate money laundering controls.

And there is not much social benefit in higher house prices to counteract the costs to non-homeowners. Higher prices have not led to a significant increase in supply over time; people do not spend the increase, nor use it much to fund their retirement.

Defining ‘justice’

The word justice is used so widely, it needs some definition. While “fairness” is applied more widely, justice can be used to incorporate four sometimes conflicting objectives. Justice seeks, as much as possible to:

  • Contribute to economic equality
  • Give each person their just deserts
  • Meet people’s essential needs
  • Allow for personal liberty by not interfering in people’s lives.

Such a model of justice can be used to evaluate tax systems.

For those concerned that justice comes at a cost to efficiency and economic growth – there is considerable evidence to show that the relationship, where it exists, is positive. Giving people their just deserts provides the material incentives so beloved of economists. Evidence from a broad group of countries shows little overall relationship between income inequality and rates of growth and investment. Fairer taxes lead to greater compliance with tax laws. Research has found a significant increase in Australian tax morale between 1981 and 1995, which was explained by reforms that people saw as making the system more just.

Clouded by politics

Amid the ongoing debate about tax reform during the last year, many had hoped for some meaningful changes in the coming federal budget.

Instead, the current debate on the tax system, and more recently negative gearing, is concerned with perceptions of political acceptability.

This was also typified by the dismissal of any change to the taxation of housing in the Re:think tax discussion paper:

“Given the central importance of the home for Australian families, there is a strong consensus that it would not be appropriate to tax either the imputed rent on owner-occupied housing or capital gains derived from it.”

“Strong consensus”, whatever that means, is not a good reason if it involves injustice. The argument works the other way: given the central importance of the home, and its place in income and assets, it is essential for housing to be included in our tax and welfare systems. Let’s be the land of the fair go, even if we have to give up some personal advantages.

Reform options

Addressing the issue is complicated politically in that around 70% of voters own their houses, and a significant minority have borrowed heavily to get into the market in recent times. If prices drop, they will suffer through no fault of their own, as would the banking industry. With more than two million shareholders, banks are also strong politically.

The Henry tax review did, however, recommend a transition from stamp duties to a land tax, a significant increase in rental assistance and the removal (albeit with a high threshold) of the exemption of owner occupied homes from the means test for pensions.

The greater efficiency, and justice, of land taxes means that they have fairly widespread support from informed commentators. Taxes on property currently raise A$29 billion annually for the states and another A$14 billion for local governments in Australia. If land accounts for 50% of the value of residential housing, the additional revenue would be of the order of A$75 billion. Another A$40 billion might be possible if commercial land was also be included.

Removing capital gains discounts and taxing imputed rents should also be considered. Research released in 1994 found the latter would be both efficient and more equitable in Australia. The advantage of this is that such a system allows for the tax deductibility of mortgage repayments, so would provide compensation for the minority that had recently bought into the housing market. A higher withholding tax on international deposits would also reduce the availability of funds to push up assets, and encourage local businesses by removing some of the artificial support for the currency.

Housing accounts for more than 60% of the value of total assets held by Australians. Translated into imputed rent it amounts to about A$150 billion annually, or 20% of the gross personal income of those who own their homes. If taxed at marginal rates of tax, imputed rents would add about a third to current personal tax of A$190 billion annually.

This article is a summary of a paper “The justice of 2016 Australian tax and redistribution” to appear in the St Mark’s Review.

Author: Anthony Asher, Associate Professor, UNSW Australia

Housing Affordability: Baby Boomers vs. Gen Y

From On The House. Few owner occupiers today, nor many owner occupiers in 1989, could enjoy stress free and affordable weekly mortgage repayments. Lack of affordability is not so much a generational problem as it is a socio-economic problem.

Inter-generational arguments over affordability have again become salient in the media. Characterisations of moaning millennials were made by economist Stephen Koukoulas, prompting a response from young writer Osman Faruqi that baby boomers should choke on my soy flat white.

Confusion around the severity of housing affordability arises because dwelling prices change daily, yet the institutional papers and ABS data we look to are retrospective.

The Submission to the Inquiry into Home Ownership by the Reserve Bank of Australia in June 2015 explored ownership rates as a possible proxy for understanding the severity of housing affordability, and whether expensive housing was keeping young people out of the market. However, the home ownership rates referenced are only measured to 2012 – before the enormous housing boom of 2013 – and therefore the submission paper does not take into account the largest and longest housing boom we have seen in over 30 years.

Graph 2 shows the House Price Index for Australia’s eastern metropolitan markets over time. The increase in the HPI from 2013 (particularly in Sydney and other east coast markets) marks an unprecedented rate of growth in dwelling values.

Graph 2: House Price Index

Source: Onthehouse.com.au

Housing affordability is an undeniable problem in Australia today. It is measured using the ‘median multiple’, which is a measure employed by the World Bank. It is found by dividing median dwelling prices by gross annual median household income. An indicator of 5.1 or more is considered to be highly unaffordable.

We only have median household income data at a capital city level, up to 2012. To get a more accurate figure, I have indexed income by changes in average weekly earnings so I could work out the median multiples for each capital city. With the exception of Canberra, the median multiple is well above 5.1. In Sydney it is currently about 13.

The Interest Rate Debate

One of Koukoulas’ main arguments was that low interest rates have made it easier for young people to take out money to afford a home. He argues that baby boomers struggled with interest rates of over 17% in the 1980s.

While I don’t deny Koukoulas’ latter statement, it is important to get a better understanding of what low interest rates actually do to affordability.

Economics literature shows Australian’s have a high elasticity of demand for houses. This means that the more money people have access to, the more likely they are to buy houses. Low interest rates make the cost of borrowing money cheaper and access to money easier.

When interest rates are low, the cost of housing is bid up higher because more people are competing for housing. Graph 3 demonstrates the inverse relationship between interest rates and Australian median house values.

Graph 3: Interest Rates and Median House Values in Australia

Source: Onthehouse.com.au & ABS

Low interest rates have not worked in the favour of first home buyers. In fact, in 2014, for the first time in recorded history and while the cash rate was at historic lows, more money was lent to people who were buying investment housing compared to people who were buying something to live in (see Graph 4). This unusual phenomenon eased shortly after APRA placed higher risk weights and investment lending restrictions on banks, however it does show that owner occupiers, some of which are first home buyers, do not necessarily benefit from low interest rates.

Graph 4: Loans to Investors vs. Owner Occupiers

Source: Onthehouse.com.au & ABS

Home owners also faced high unaffordability in the late 1980s when interest rates increased sharply and average home loans peaked at 17%. The cost of loans became extremely high and some were forced to sell their home or take on multiple jobs in an attempt to pay off their rapidly growing debt. On top of this, house prices fell, which left some people with mortgage debt even after they lost their home.

ABS data shows that the average loan size of owner occupiers in NSW over the 1980s was approximately $80,000, while the average interest rate increased to 17% in 1989. Assuming a 30 year mortgage on $80,000 taken out in 1989, the total repayments work out to be around $263 per week, at a time when the average person across NSW was earning between $359 and $620 a week depending on their job status and sex . The $263 home loan assumption represents between 73% and 42% of average weekly earnings at the time.

Today, standard home loan rates are at approximately 5.35%. In February 2016, the average loan size taken out by owner occupiers in NSW was $416,000 . With the same loan assumptions as above, weekly repayments work out at approximately $536 per week. In November 2015, the average weekly earnings across NSW ranged between $951 and $1,712, depending on labour force status and sex, making repayments between 56% and 31% of average weekly earnings.

This analysis is fairly ‘back of the envelope’, but looking at these numbers suggests that few owner occupiers today, nor many owner occupiers in 1989, could enjoy stress free and affordable weekly mortgage repayments – which is considered to be no more that 30% of income. Exorbitant home loan repayments persist 25 years on, but for different reasons. A surge in interest rates overwhelmed young home owners in 1989, whereas today many young people are lucky to overcome the deposit hurdle due to enormous dwelling prices. In the case of owner occupiers today, this is with the ‘benefit’ of low interest rates.

Ambiguity still exists in this comparison, for many reasons. For example, average weekly earnings is looking at individuals rather than households. Young people in the 1980s were more likely to have formed double income households than young people today. 1989 was a different world to 2016, particularly in terms of the nature of the economy, technology, job vacancies and the terms of employment.

However, a lack of affordability is not so much a generational problem as it is a socio-economic problem. Years of analysis could be done trying to understand ‘who had it tougher’, but this seems like a waste of energy. Low income households and single parent families will face tougher challenges than members of Generation Y who are in high income brackets.

House Prices On The Slide

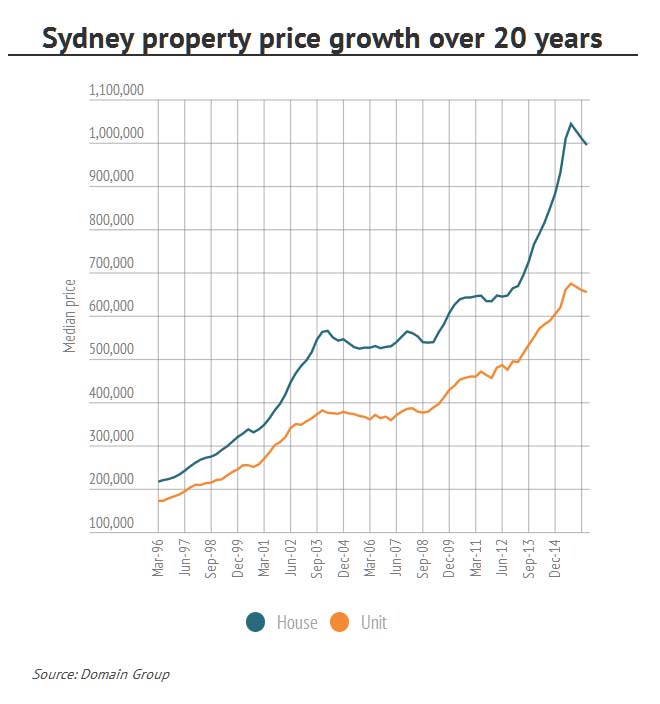
According to the Domain House Price Report for the March Quarter, Melbourne and Hobart are the only capital cities where house prices are still rising. Sydney’s house prices fell, recording a quarter-on-quarter drop of 1.5 per cent, bringing the median down under the $1 million mark to $995,804. This 1.5 per cent drop when coupled with the 3.2 per cent fall in the December quarter, means prices have now dropped 4.7 per cent over six months. It’s an even bigger drop than Sydney experienced over 2008 during the global financial crisis, when the median dropped 4.6 per cent over the full year.

Domain-April-2016-Sydney Canberra house prices fell by 1.4 per cent after five consecutive quarters of growth.

In Perth, house prices dropped by 1.3 per cent to $579,914 over the quarter, while Adelaide recorded a 0.5 per cent drop to $491,422, and prices in Brisbane fell by 0.05 per cent to $512,809.

The report showed that house prices in Hobart surged during the March quarter, rising by 4.3 per cent to $360,212, while Melbourne house prices rose by 1.2 per cent to $726,962.

Darwin house prices dropped sharply by 4.9 per cent to $610,305.

“Weakening economic activity and growing uncertainty is impacting fragile consumer and investment sentiment, leading to falling house and unit prices in most capital cities,” Domain chief economist Andrew Wilson said.

“The outlook for house prices remains subdued, with capital city growth likely to continue to track at best just above the inflation rate for the remainder of 2016.

“The prospect of weaker house price growth, however, will be welcomed by prospective first home buyers still struggling to get into the market.”

The boom’s over, but no crash is imminent. As Dr Wilson points out, the most recent drop in Sydney is less than the one in December. So there could be an even smaller fall in June. It’s not as if there’s been any major trigger to substantiate a more significant correction, like a large rise in interest rates or a jump in unemployment.

Further Confirmation Australian Home Prices Least Affordable

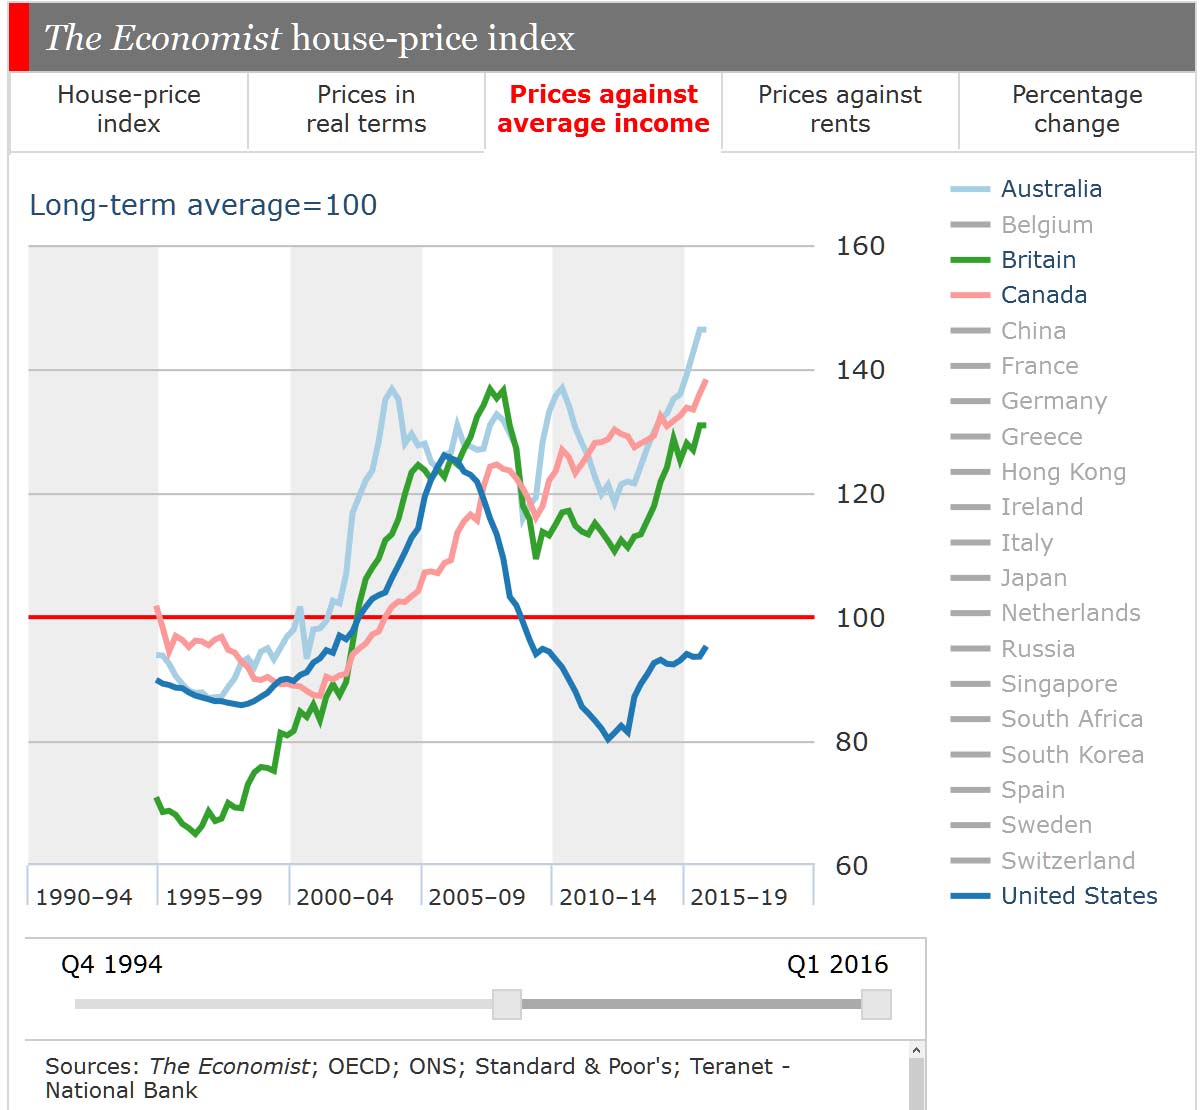
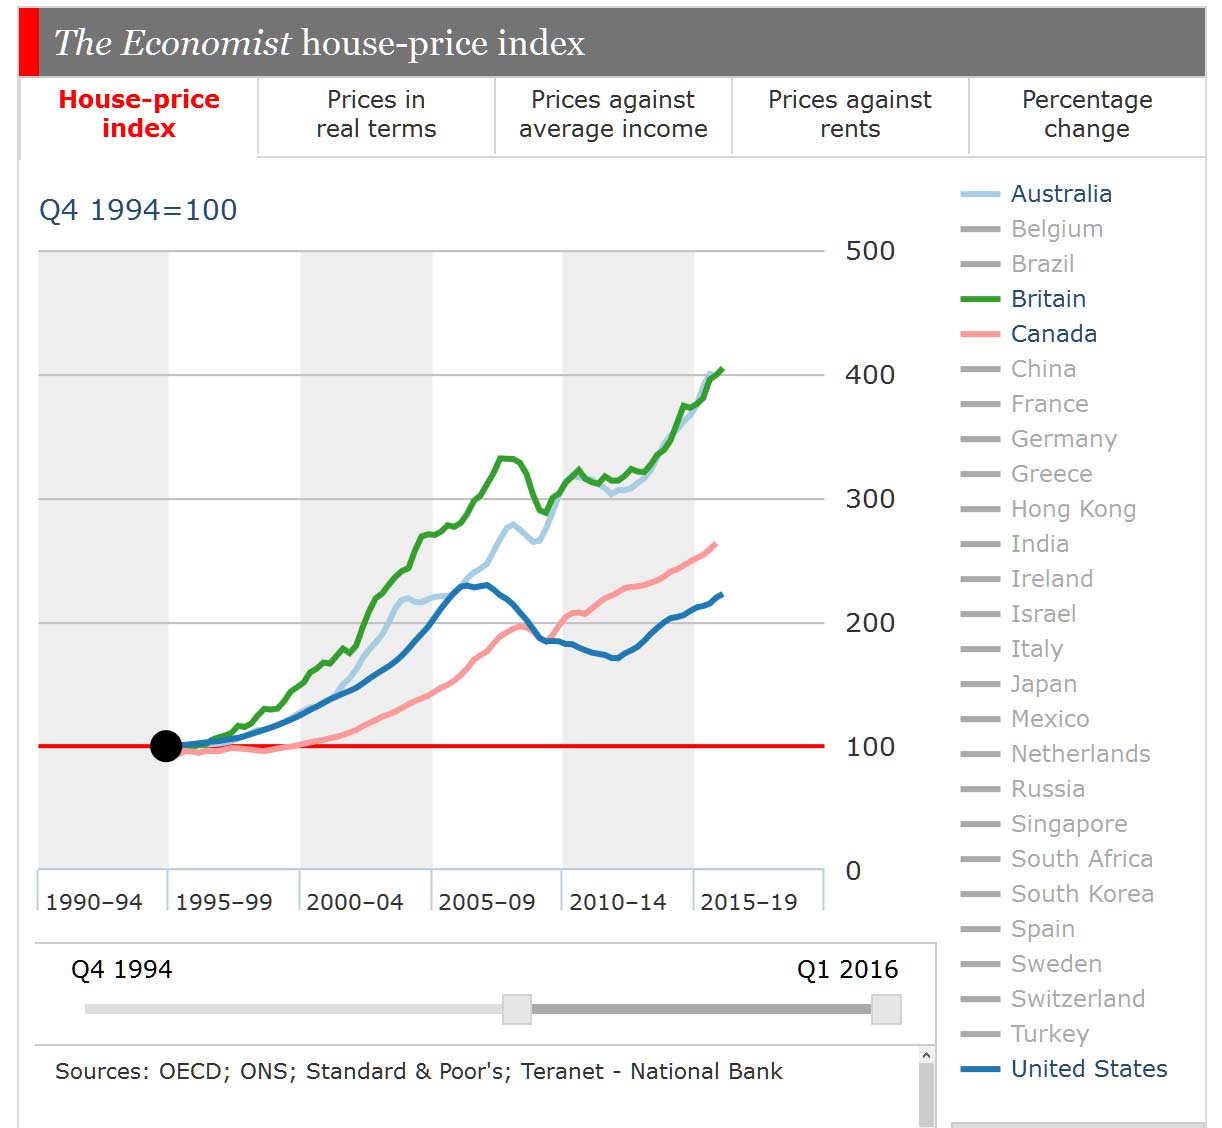
The latest Economist data on global house prices released today, shows Australia sitting at the top the pack (excluding Hong Kong) in terms of average prices to average income. This chart shows Australia, Britain, Canada and USA trends from 1990. This is consistent with findings from Demographia.

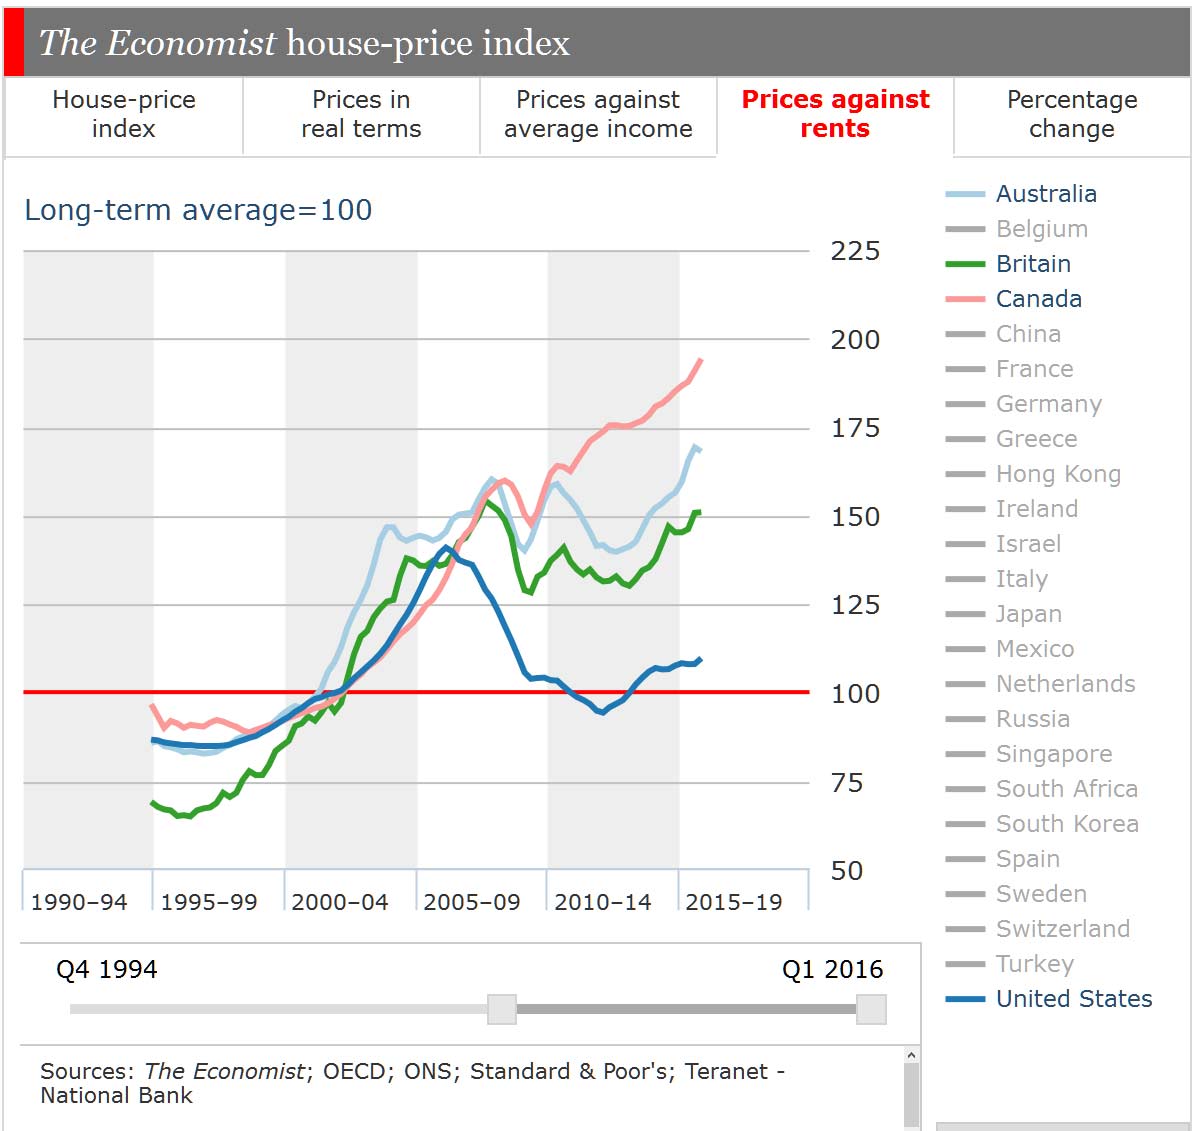
Economist-HP1On a different measure, prices against rent, Australia is behind Canada, but above the other two.  Rental growth in Australia has not kept up with house prices.

Economist-HP-5

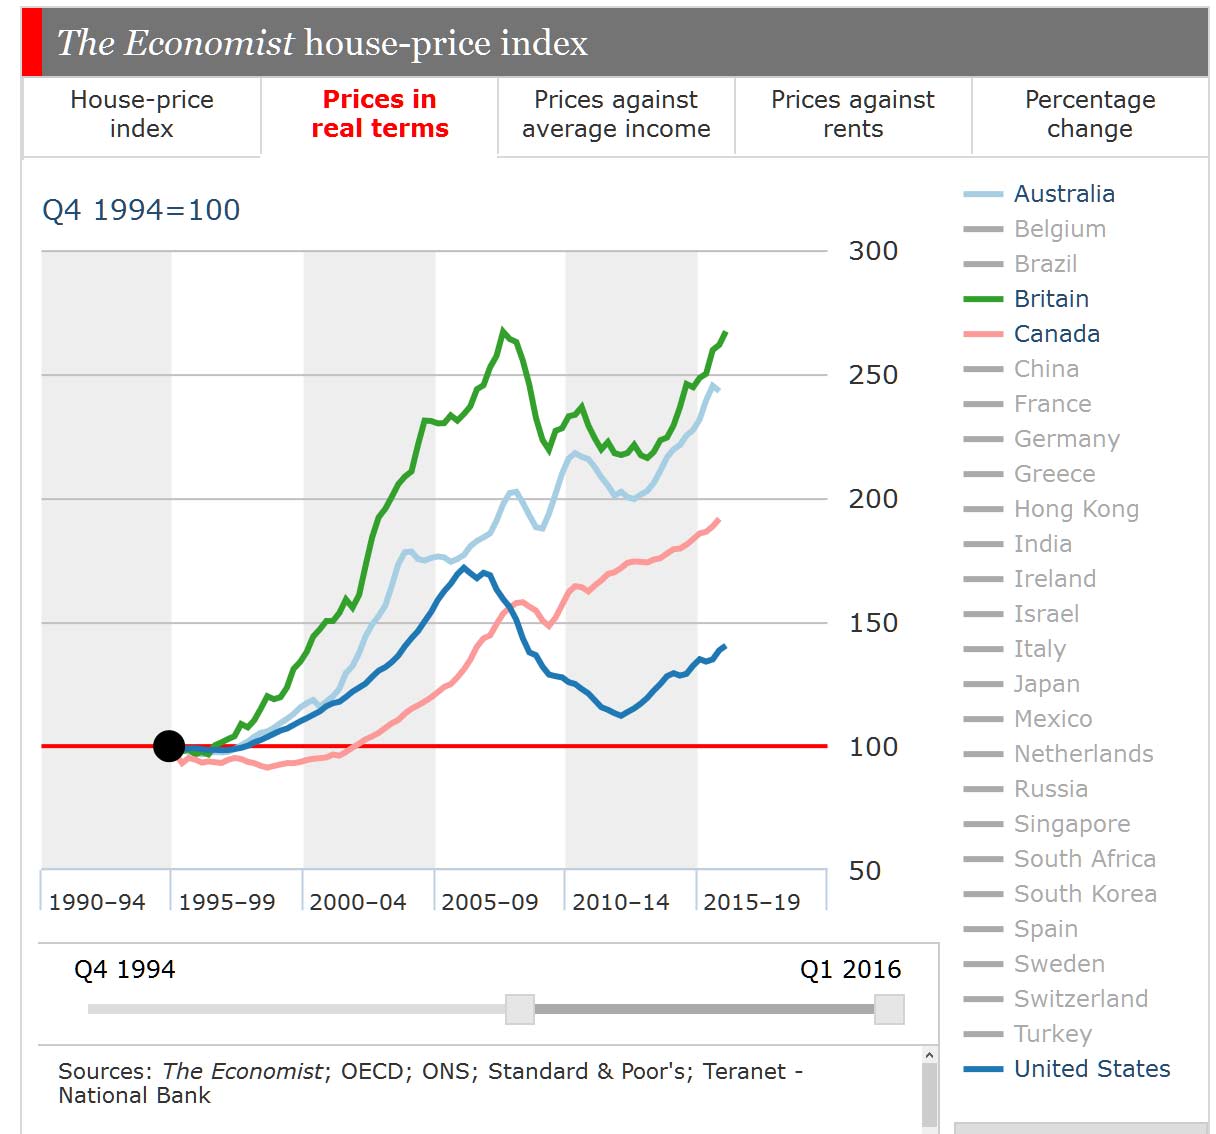
Prices in real terms show Australia price growth just behind Britain, but well ahead of Canada and USA.

Economist-HP3

Finally using the price index, movements in Australia are close to those in Britain, but well ahead of Canada and USA.

Economist-HP-2

Explanation from the Economist

Their interactive chart uses five different measures
• House-price index: rebased to 100 at a selected date
• Prices in real terms: rebased to 100 for the selected date and deflated by consumer prices
• Prices against average income: compares house prices against average disposable income per person, where 100 is equal to the long-run average of the relationship
• Prices against rents: compares house prices against housing rents, where 100 is equal to the long-run average of the relationship
• Percentage change: the percentage change in real house prices between two selected dates

Notes
The data presented are quarterly, often aggregated from monthly indices. When comparing data across countries, the interactive chart will only display the range of dates available for all the countries selected

Annual rate of housing market capital gains slips to slowest pace in 31 months – CoreLogic RP Data

The rate of value growth continued to moderate as housing market conditions cool in Sydney and Melbourne, whilst the remaining capital cities recorded a range of outcomes from small value increases to moderate declines according to CoreLogic RP Data.

During March, capital city dwelling values recorded a subtle lift, rising by 0.2 per cent to take capital city home values 1.6 per cent higher over the first quarter of 2016. The quarterly increase in home values was broad based across the nation’s capitals, with Perth (-0.9%) and Brisbane (-0.1%) the only two cities to record negative movements in dwelling values over the past three months.

CoreLogic RP Data Head of Research Tim Lawless said, “The March quarter rise in capital city dwelling values is in stark contrast to the first quarter of 2015, when values increased by 3.0 per cent, which is almost double the current pace of quarterly growth. However, compared with the final quarter of 2015, when capital city dwelling values were down 1.4 per cent, the housing market has shown a modest rebound in growth which is well below the strong capital gains recorded over the first half of 2015.”

“The annual pace of home value appreciation across Australia’s capital cities highlights the slowing growth trend,” he said.

Following the March results, the annual rate of capital growth across the capital cities has now reached its lowest point in 31 months, with dwelling values rising by 6.4 per cent over the past twelve months across the combined capitals. Furthermore, no Australian capital city has recorded an annual growth rate in the double digits over the past twelve months. Melbourne remains the capital city with the strongest annual growth, with dwelling values increasing by 9.8 per cent over the past twelve months.

Mr Lawless said, “The housing market has been losing momentum since July last year, when capital city dwelling values were increasing at the annual rate of 11.1%.”

Index results as at March 31, 2016

2016-04-01--Indices

Perth and Darwin are the only two capital cities where home values are trending lower on an annual basis, down 2.0 per cent and 1.8 per cent respectively. However, Mr Lawless noted the moderation in the rate of capital growth in the Sydney market has been the most pronounced, with annual dwelling value growth more than halving to 7.4 per cent per annum, from a high of 18.4 per cent per annum in July last year.

The Melbourne market has been much more resilient, with annual growth in dwelling values slipping below the 10 per cent mark for the first time since May last year, to reach 9.8 per cent at the end of March 2016.

The current growth cycle has been running since values troughed in May 2012. Through to March 2016, capital city dwelling values have risen by a cumulative 32.2 per cent. Over the cycle to date, Sydney home values have seen the most significant level of appreciation, with dwelling values 49.2 per cent higher since values started rising, followed by Melbourne at 35.7 per cent cumulative growth.

Darwin and Perth moved through their respective cyclical market peaks more than a year ago, with Darwin home values peaking in May 2014, whilst Perth’s housing market peaked in December 2014. Since then, both Darwin and Perth home values have fallen by a total of 4.6 per cent.

Value of Capital City Markets

From Onthehouse.

Historically, it is common that the February quarter sees subdued growth that is below the long term average, however it is unusual to see a negative result. Quarterly growth in the Australian house market was -0.04% overall in February, while the unit market suffered a loss of -0.32%

Of the 32 major housing markets, 18 slipped into negative growth for the quarter. Of the markets that achieved positive quarterly growth, it was mostly subdued rates of less than 1%.

Interestingly, Sydney, Melbourne and Brisbane saw a reduction in median house values in the February quarter. This is likely the result of tightened access to home loans, which has encouraged a more rapid onset of the downswing in the east coast markets.

Melbourne’s growth cycles typically see two or three growth surges during the upswing stage, so this quarter’s retraction could just be a short term fluctuation.

The greatest capital losses for the quarter were again seen in Darwin, where the median house value dropped -5.68% and units declined -5.02%.

The key to this market is recalling its small size. Sales volumes across the Darwin market (houses and units) dropped 23% for the year, however the change in the number of sales was a decline of just 469.

Surprisingly, house and unit values in country Tasmania achieved the highest quarterly capital growth rates. The median houses value increased by 2.68% in the February quarter, while units went up by 2.00% in the same time period.

To put the various housing markets in perspective, Figure 1 shows the estimated dollar value of each capital city residential real estate market as at February 2016. This was achieved by using the average sale price of houses and units in the year to February 2016, multiplied by the number of sales in the metropolitan regions for the year.

Figure 1: Value of Capital City Markets

Source: Onthehouse.com.au

Noting the small size of Darwin’s housing market – a hundredth of the value of Hobart’s housing market – enables understanding of the high growth fluctuations occurring in Darwin. Because the market is so small, big projects and investments have a large impact on the economy, population and subsequent demand for housing.