Dwelling values stage a broad based rise in February

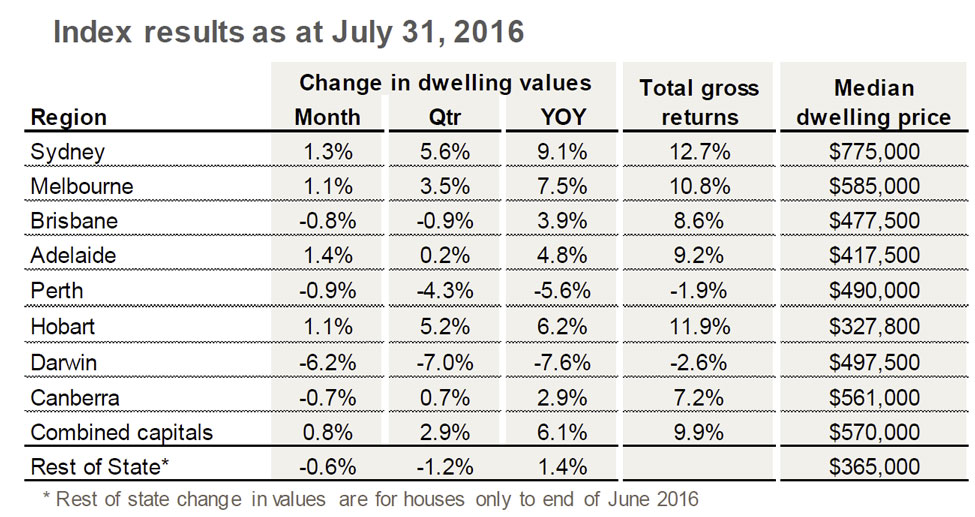
According to the February 2016 CoreLogic RP Data Hedonic Home Value Index results released today, dwelling values across Australia’s combined capital cities showed a 0.5% rise in February, pushing dwelling values 1.4% higher over the past three months.

In February, home values rose across each capital city with the exclusion of Perth and Canberra. Over the past three months, dwelling values have increased across all capitals except Sydney (-0.2%). The largest monthly increases in home values were recorded in the cities that have been underperforming over the growth cycle to date; Hobart dwelling values were 2.9% higher, Adelaide showed a 1.9% rise, and Brisbane home values increased by 1.8%. Perth and Canberra were the only cities to record a monthly fall in values, down -1.1% and -0.2% respectively.

Index results as at February 29, 2016

2016-03-01--indicesv2

Sydney was the only capital city to have recorded a fall in dwelling values over the past three months, down -0.2%. The cities to record the greatest value rises over the past three months have been: Hobart (8.5%), Melbourne (3.8%) and Brisbane (2.0%). According to CoreLogic RP Data head of research Tim Lawless, “Even though home values have trended lower over the year in Perth and Darwin, they have recorded value rises of 0.2% and 0.3% respectively over the past three months.”

Dwelling values are still increasing across most capital cities however, the results remain diverse. Sydney and Melbourne remain the strongest markets in trend terms, however, the gap is widening between the performances of Melbourne relative to Sydney.

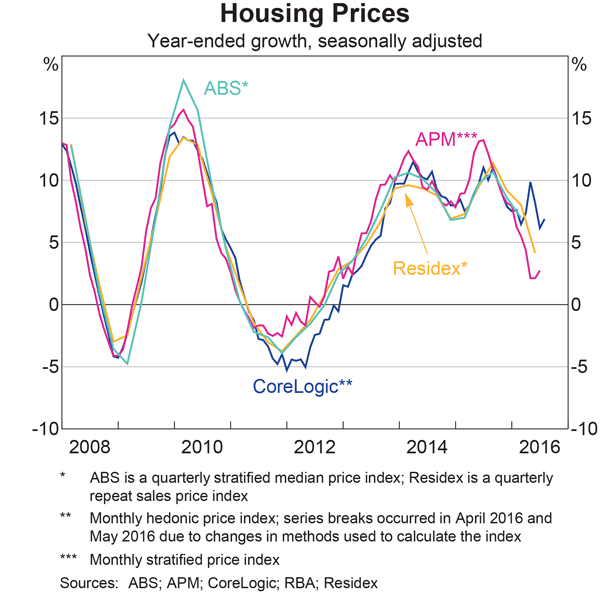
Over the past 12 months, combined capital city home values have increased by 7.6%, with the annual rate of growth down from a recent peak of 11.1% recorded in July last year. Melbourne has maintained its number one growth position, with annual capital gains of 11.1%. Mr Lawless said, “Melbourne values appear to be holding reasonably firm since December last year with the annual rate of capital gain virtually level over the past three months.”

Sydney’s annual rate of growth has continued to moderate, having almost halved from its cyclical peak of 18.4% recorded in July last year to reach 9.5% growth over the past twelve months. Despite the slowing trend, Sydney remains the second best performing capital city over the past twelve months, however, Mr Lawless said, “a few of the smaller cities, where growth rates have recently accelerated, may start to rival Sydney’s position over the coming months.”

“The trend in home value growth is showing signs of increasing in those markets that have previously underperformed. These include Brisbane, Adelaide, Hobart and Canberra. Affordability constraints aren’t as apparent in these cities and rental yields haven’t been compressed to the same extent as what they have in Melbourne or Sydney. Home values increased in Brisbane by 5.5% over the past year, which is the fastest annual rate of value growth in a year. In Hobart, home values are 6.2% higher over the year, which is its fastest annual rate of home value growth since July 2010,” Mr Lawless said.

Here’s what David Cameron could learn from a history of social housing

From The Conversation.

There’s a housing crisis engulfing the UK, and London is at its epicentre. In his recent vow to regenerate over 100 so-called “sink estates”, David Cameron would have us understand that public housing has failed: that the result is poor people, living in poorly designed homes, that were poorly managed. But this version of history is not definitive – nor even particularly accurate.

So what can history tell us about what works and what doesn’t, when it comes to housing? As planners and politicians cast about for solutions to the current crisis, the answer may well be found at their feet – or rather, under them.

In 1892, parliament realised that the building of the Blackwall Tunnel would require hundreds of homes to be demolished. This resulted in a new act of parliament, which stated that no work could commence on the tunnel until those evicted had been rehoused. And so, with private builders unable to supply these new homes, the first council housing in London was built.

But while the new estates sheltered those displaced by construction, their rent was still relatively expensive, so the nation’s poor and vulnerable remained in the private rented sector. So-called “slum landlords” routinely exploited the high demand for housing, leaving vulnerable tenants with substandard and overcrowded accommodation.

The pioneers of housing philanthropy – Joseph Rowntree, George Peabody and Octavia Hill, to name a few – battled to tackle poor housing conditions, homelessness and poverty. But it was often difficult to attract the required support from investors for philanthropic housing projects, when the alternative profits from being a slum landlord were so high.

Meanwhile, the government’s view was that – whatever the solution to the urban housing crisis may be – it most certainly was not state-owned housing. The parallels with 2016 are obvious.

Search for solutions

But all that rapidly changed in the first half of the 20th century – particularly following World War I and World War II – as successive governments took greater responsibility for the social welfare of citizens. Building programmes were supported by government grants and subsidies, which allowed rents to drop below market levels and made housing available to lower income households.

The vision of Anuerin Bevan – a key architect of the NHS – was that council housing, owned and managed by local authorities and built to a high standard, would be home to a diverse range of social classes. Bevan’s vision was not achieved in its entirety: some architectural design and building materials did not meet the needs of residents. Even so, by the 1960s, more than 500,000 flats had been added to the housing stock in London alone.

Worse for wear. sarflondondunc, CC BY-NC-ND

From the late 1970s, council housing was seen as increasingly problematic. As well as an ideological shift away from state provision, the government had concerns about the cost of maintaining council-owned houses, and the higher concentration of poor and vulnerable citizens living in them. It appeared that the 20th century’s use of council housing to provide accommodation for lower income households would not be a 21st-century solution.

Instead, the Thatcher government’s Right to Buy policy for council tenants sought to cement the UK as a nation of home owners. As well as being sold off, council housing stock was transferred to housing associations or arms length management organisations. Together with housing cooperatives and mutuals, these new arrangements became known as “social housing” and “registered social landlords”.

The idea was that housing associations would be able to borrow on the markets to invest in their housing stock – making them less dependent on government funding – and that tenants would have a strong influence about housing management decisions. Tenant participation was certainly strengthened in all forms of social housing, particularly where associations were local and community-based. Greater private investment was also secured to enhance housing quality.

Yesterday’s issues today

In 2010, the coalition government began referring to “registered providers of housing”, dropping the “social” altogether. That said, it should be noted that in other countries in the UK, housing policy has moved in different directions since the issue was devolved to the governments of Scotland, Northern Ireland and Wales.

Now, the Conservative government is introducing the Right to Buy for housing association tenants, as well as implementing fixed-term tenancies and the policy that tenants on higher incomes should pay more rent or leave. This all sounds like the final death knell for mixed income, long-term and secure public housing. In its place comes “affordable housing” – a term which is stretched to describe homes costing up to £450,000.

The current housing crisis is displacing lower income families from many parts of our cities. Young people have much worse housing prospects than their parents. Recent research says that in less than ten years time, only the rich will own their homes. And new cases of slum landlords have been reported in London. It is 2016 but, when it comes to housing, in many ways it could actually be 1891.

The key difference now is that we can look to the past for lessons. We have learned that private developers and landlords cannot be the entire solution. We know how to deliver very large scale housing programmes in periods of debt and austerity. And we can do so again now – while avoiding the pitfalls – with a diversity of social housing models and new roles for private developers, landlords and investors.

Author: John Flint, Professor of Town and Regional Planning, University of Sheffield

How policy success, not failure, has driven Australia’s housing crisis

From The Conversation.

To see Australia’s shortage of affordable housing as a failure of government is to misunderstand the politics that underpin housing. The vast proportion of government money spent on housing directly benefits the well-off at the expense of private renters and public housing tenants.

Government policy has not, on the whole, failed. It has been a huge success insofar as protecting the opportunities for speculative investment and profit for homeowners and private landlords.

If the government was serious in wanting to end the housing crisis it would need to invest in new social housing and pursue measures that choke off, via tax reform, the opportunities for profiteering currently enjoyed by landlords and homeowners.

The pursuit of these options would be bitterly opposed – not least by many homeowners and property investors, as it would lead to a fall in house prices.

Why this misdiagnosis persists

The government’s current housing response can be viewed as a charade. Ministers have been able to convince many that the government is working hard to put in place measures to fix the problems faced by low-income households.

There are two discernible ways that the government has maintained this charade. The first is by permeating an impression that action will be forthcoming. Social Services Minister Christian Porter recently announced that he would be establishing a working group to explore ways to improve the availability of affordable housing.

Porter’s working party should come as no surprise. Over many years, governments have undertaken many reviewsandenquiries.

Second is the recycling of a set of myths. Among these is that public housing is a failed policy that reinforces welfare dependency and that state and territory planners impose arbitrary rules and regulations that impede new housing development.

Public housing and planning regulation are framed as dysfunctional. We are told that affordable housing would be built quickly if the commercial sector were not impeded by bureaucratic demands.

Should we discard statements from the government that effective reforms are underway and recognise that the prospects for low-income Australians will deteriorate over the coming years? Already there are as many as 105,000 people who are without a home and 160,000 households on public housing waiting lists. The overall stock of public housing had fallen from 331,000 units in 2007-08 to 317,000 in 2013-14.

The Productivity Commission estimated that the proportion of low-income households in housing stress – that is, those that pay more than 30% of their income on housing-related costs – increased from 35% in 2007-08 to 42% in 2013-14.

In its 2012 report, the former National Housing Supply Council highlighted that between 2002 and 2012 rents increased in nominal terms by 76% for houses and 92% for flats. And the median value of a home in Australia is now A$576,100.

Sticking to the script

There are already signs in 2016 that the government intends on sticking to the usual script – one that frames the affordability crisis as stemming from a shortage of land, excessive red tape, and high labour costs within the building industry.

Acting Cities Minister Greg Hunt recently identified:

Three critical elements that require government attention. One – land release. Two – the cost of building – and this is in particular in relation to the inner city apartments where there is an urban infill. The third is bureaucracy.

Hunt’s attribution of the causes of the housing affordability crisis are broadly in line with the pronouncements of finance, developer and real estate lobbyists. All have made similar claims and work tirelessly to safeguard the opportunities for profit-making that exist when housing is in short supply.

It is no coincidence that supply-side interventions, such as sustained investment in public housing, have been eschewed in favour of demand-based subsidies. The latter includes initiatives such as Commonwealth Rental Assistance and inputted tax subsidies that enable landlords to boost their profits, alongside first homeowner grants and the exemption of capital gains tax for owner-occupiers when they sell their home. This amounted to A$54 billion of revenue forgone in 2016.

For those who wish to reap profits from their housing investment, there are good reasons to maintain the status quo; for a shortage of supply to continue and for public housing to remain a stigmatised tenure only available for those without any recourse elsewhere.

Stressing land release as a significant cause of the affordability crisis is misleading but not surprising. This is the claim repeated by developers who wish to increase their profits. It is not uncommon for developers to delay development plans on land they have acquired on the expectation that the opportunity to secure greater profits will accrue when the land value increases at a later stage.

It is disappointing that Hunt offered such a myopic explanation of the housing affordability crisis. A more insightful analysis would attend to the failure to invest in public housing, the subsidies that distort the private rental market such as negative gearing, and the tax privileges that are extended to homeowners.

The housing problems experienced by low-income households are a symptom of entrenched inequality within Australia. Public and private tenants remain disadvantaged and have to endure problematic tenancies that are increasingly insecure. Unless this inequality is addressed, Australia’s housing problems will endure.

Author: Keith Jacobs,  Professor of Sociology and ARC Future Fellow, University of Tasmania

Melbourne takes over as the best performing capital city over the past twelve months – CoreLogic RP Data

Dwelling values across Australia’s capital cities were 0.9% higher in January driven partially by a rebound in Sydney and Melbourne.  The recent growth conditions have pushed the Melbourne market into first place for annual growth in dwelling values with an 11.0% rise compared with Sydney where values are 10.5% higher over the past twelve months.

According to the January 2016 CoreLogic RP Data Hedonic Home Value Index results released today, dwelling values across Australia’s combined capital cities showed a 0.9 per cent rise in January after recording no change in December and a 1.5 per cent drop in November.

According to CoreLogic RP Data head of research Tim Lawless, this month on month rise wasn’t quite enough to pull the rolling quarterly rate of growth back into the black, with capital city dwelling values remaining 0.6% lower over the past three months. Hobart led the monthly figures with a 4.7% jump in values, followed by Melbourne where values were 2.5% higher and Canberra with a 2.8% lift. Sydney values also showed a rise of 0.5%, while the remaining four capital cities showed dwelling values to be either flat or down.

Index results as at January 31, 2016

2016-02--indices-release

The rolling quarterly trend was looking similarly diverse, with four of Australia’s eight capital cities recording negative dwelling value movements over the past three months, with Sydney dwelling values showing the largest fall, down 2.1 per cent. Values are down over the rolling quarter in Darwin (-1.4%), Adelaide (-0.9%) and Melbourne (-0.1%) as well. The strongest growth in home values over the quarter across the capital cities was found in Hobart with a 3.0% capital gain.

Despite recording the largest annual decline in home values (-4.1%), Perth dwelling values posted a 1.7 per cent rise over the three months to the end of January. Other capital cities to record a rise over the rolling quarter were Brisbane (+0.8%) and Canberra (+1.2%).
Over the past twelve months, capital city dwelling values have risen by 7.4% with Sydney’s capital gains of 10.5% no longer the highest annual rate across the capitals. “While still a high rate of annual growth, Sydney’s annual rate of capital gain is now at a 29 month low and has been progressively softening since peaking at 18.4% in July last year,” Mr Lawless said.

“Melbourne’s housing market has been more resilient to slowing growth conditions which has propelled the annual growth rate to the highest of any capital city, with dwelling values 11.0% higher over the past twelve months. Previously, during the height of the growth phase, there was a large separation between Sydney’s housing market, which was streaking ahead, and Melbourne’s, where the rate of capital gain was substantial but still well below the heights being recorded in Sydney. The latest data reveals Sydney’s housing market is now playing second fiddle to Melbourne’s, at least in annual growth terms.”

“In fact, over the past six months, the performance gap between Sydney and Melbourne is stark. Sydney dwelling values have reduced by 0.6 per cent between July last year and the end of January 2016, compared with a 3.0 per cent rise across Melbourne dwelling values. The last six months have also seen both Brisbane and Canberra dwelling values rise by 2.0 per cent while Hobart values are 1.3 per cent higher and Adelaide dwelling values have been virtually flat with a 0.1 per cent rise,” Mr Lawless said.

The annual pace of growth across the Canberra market has been progressively improving, with values up 6.0% over the past twelve months; the strongest annual gain since November 2010. The nation’s capital has benefitted from improved buyer confidence while rising demand has seen much of the housing oversupply absorbed, particularly across the detached housing market where gains have been the highest.

While the pace of growth in dwelling values across the combined capitals has eased from the heights of mid last year, rental growth across the capital cities over the past twelve months has reduced further, with dwelling rents unchanged over the year.

According to Mr Lawless, with a rental series that extends back to 1996, these are the weakest rental markets conditions ever seen. “In fact there hasn’t previously been a twelve month period when rents didn’t rise across our combined capitals index.” he says.

Darwin and Perth are dragging the broader capital cities’ rental indicators down with weekly rents down 13.4% over the past year in Darwin and 8.6% lower in Perth. Dwelling rents were also down in Brisbane (-0.7%) and Adelaide (-0.4%). The largest rental increases were in Sydney and Melbourne where weekly rents rose 1.4% higher, and 2.1% higher respectively over the past twelve months.

Mr Lawless said, “With dwelling values rising substantially more than rents in Sydney and Melbourne, this ongoing effect has created a compression in gross rental yields to the extent that gross yields in these cities are now only marginally higher than record lows.”

According to the most recent Reserve Bank’s private sector housing credit data, the pace of investment-related credit growth has fallen well below the 10% speed limit implemented by APRA in December 2014.

Mr Lawless said, “The slower pace of investment credit is likely to be due to more than just higher mortgage rates for investment loans and stricter lending policies, but also due to investors becoming wary of the low rental yield scenario while also anticipating lower capital gains than what was recorded last year.”

“As housing market activity moves out of its seasonally slow festive period, we are likely to have a much better gauge on how the overall housing market is performing in the New Year.

“January tends to be a relatively quiet month across the housing market, however across the capital cities we estimate that there were approximately 16,500 dwelling sales contracted in January.

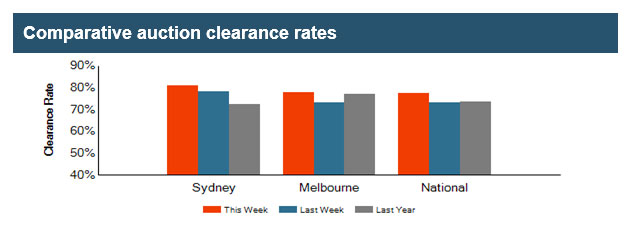
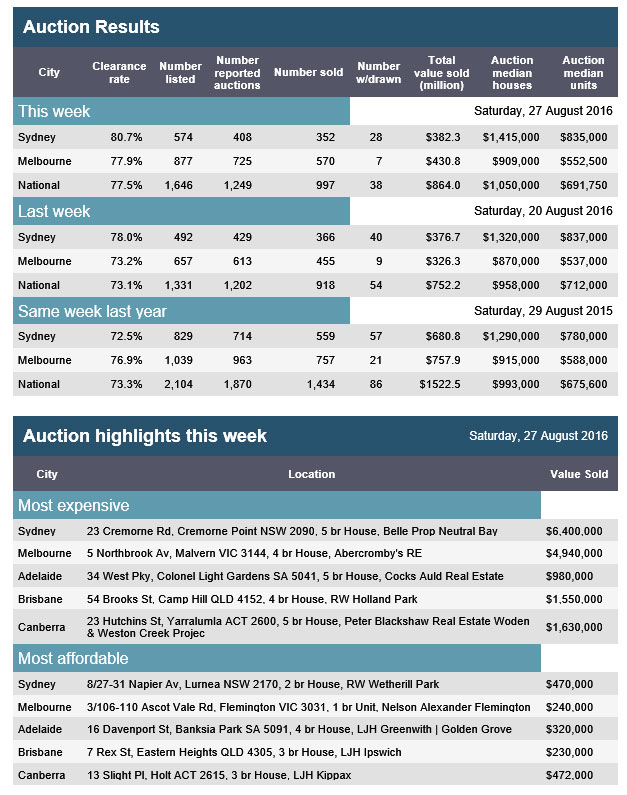
“Additionally, while the number of auctions won’t return to normal until early February, the weighted average auction clearance rate across the capital cities over the final weekend of January was 61.6%; higher than what was recorded during December when the weighted average clearance rate was between 57% and 59% from week to week.

“The bounce in dwelling values in January may provide an early sign that housing values across the combined capital cities are not likely to experience material decreases in 2016. We believe that the rate of capital gain across the combined capitals in 2016 is likely to be less than the 7.8% experienced in 2015, driven by a slowdown in Sydney and Melbourne and continued softness in the Perth and Darwin markets,” Mr Lawless said.

RBNZ Highlights Unprecedented Divergence in House Prices

The Reserve Bank NZ, released a Bulletin today which looks at house price trends across New Zealand. Since mid-2012, Auckland house prices have increased 52 percent, but house prices in the rest of New Zealand have increased only 11 percent. The extent of this divergence is unprecedented.

Since 1981, house prices in Auckland have increased much more than those in the rest of New Zealand. House prices in North Island provinces – where house prices have grown the least – are only 63 percent higher than they were in 1981. By contrast, Auckland house prices are 352 percent higher.

Figure 14 shows Auckland house prices as a ratio to those in the rest of New Zealand. High average rates of house price inflation in Auckland relative to the rest of the country have seen this ratio trend upwards since 1981. The extent of the increase in this ratio since 2009 is unprecedented.

RBNZ-House-PricesAn upward trend in this ratio might be expected over time, but it is not clear how steep that trend should be, whether it is time-varying, or whether it will persist. Notwithstanding that uncertainty, the ratio is currently 22 percent above a simple filtered trend. A divergence of this magnitude is also evident when Auckland is compared with urban centres only. This means that the upward trend has not been driven by a more general divergence between house prices in urban and provincial centres, but is an Auckland-specific phenomenon.

In previous instances when the ratio has increased relatively quickly – namely, during the late 1980s and mid-1990s – this has subsequently been followed by a period of lower growth. In 1987, house prices in Auckland increased while they were flat in the rest of the country. Then in subsequent years, Auckland house prices fell while those in the rest of New Zealand continued increasing. In the upswing of the 1990s, Auckland house prices increased relative to the rest of the country, and stayed elevated until the latter part of the 2000s cycle, at which time house prices in the rest of the country increased at a faster pace than those in Auckland.

DFA believes that the same forces are at work here, as in Sydney, London and other metro centres. Lack of supply, high levels of finance available, investors active, foreign investors active, and weak regulatory control. The perfect storm.


Australian Housing Unaffordable – Demographia

The 2016 Demographia survey (the 12th edition)  is out using data from Q3 2015. Once again Australians are shown to be exposed to highly unafforable housing, with all the downstream economic consequences which follow. Policy, regulation, and vision have all failed us. Whilst inflated prices bloat banks’ balance sheets thanks to massive lending for housing, the economic outcomes are disastrous. The resulting stagnation or even decline in household discretionary incomes is at least as much a threat to prosperity and job creation as the limited gross income gains.

” Australia had 33 severely unaffordable markets, followed by the United States with 29 and the United Kingdom with 17. New Zealand and Canada each had six severely unaffordable markets, while China’s one market (Hong Kong) was also severely unaffordable.”

Demographia-2016The survey covers 367 metropolitan markets in nine countries (Australia, Canada, China, Ireland, Japan, New Zealand, Singapore, the United Kingdom and the United States). A total of 87 major metropolitan markets — with more than 1,000,000 population — are included, including five megacities (Tokyo-Yokohama, New York, Osaka-Kobe-Kyoto, Los Angeles, and London).

The Demographia International Housing Affordability Survey rates middle-income housing affordability using the  Median Multiple.” The Median Multiple is widely used for evaluating urban markets, and has been recommended by the World Bank and the United Nations and is used by the Joint Center for Housing Studies, Harvard University. The Median Multiple and other similar price-to-income multiples (housing affordability multiples) are used to compare housing affordability between markets by the Organization for Economic Cooperation and Development, the International Monetary Fund, The Economist, and other organizations.

Demographia uses the following housing affordability ratings:

  • Severely Unaffordable 5.1 & Over
  • Seriously Unaffordable 4.1 to 5.0
  • Moderately Unaffordable 3.1 to 4.0
  • Affordable 3.0 & Under

Hong Kong’s Median Multiple of 19.0 was the highest recorded (least affordable) in the 12 years of the Demographia International Housing Affordability Survey. Sydney was the second least affordable major market, with a Median Multiple of 12.2. Sydney’s increase of 2.4 points from its 9.8 Median Multiple in 2014 is the largest year-to-year deterioration ever indicated in the 12 years of the Demographia International Housing Affordability Survey. It is also highest Median Multiple outside Hong Kong in the history of the Survey, exceeding the extremes experienced on the US West Coast during the housing bubble of the last decade. Vancouver was the third least affordable major market, with a Median Multiple of 10.8. Auckland, Melbourne and San Jose all had Median Multiples of 9.7. They were followed by San Francisco at 9.4, and London (Greater London Authority), at 8.5. Two other markets had Median Multiples of 8.0 or above, including San Diego and Los Angeles, both at 8.1.

Virtually all governments consider household economic issues as a top priority, especially increasing the standard of living and reducing or eradicating poverty. Yet economic growth has been laggard, and discretionary income trends are even more concerning. Housing costs, which represent the largest household expenditure category, have been rising much faster than incomes. The resulting stagnation or even decline in household discretionary incomes is at least as much a threat to prosperity and job creation as the limited gross income gains.

The largest losses in housing affordability have been associated with urban containment policy. Severely unaffordable housing (Median Multiple of 5.1 or higher) has occurred only in major metropolitan areas that have strong land use policy, especially urban containment boundaries and variations thereof. Corrective measures that could halt or reverse losses in housing affordability from urban containment policy have either been absent or not been implemented. As a result, urban containment policy has been a profound policy failure, as house prices have doubled and tripled relative to incomes in many metropolitan areas.

In the introduction, Senator Bob Day says:

For more than 100 years the average Australian family was able to buy its first home on one wage. The median house price was around three times the median income allowing young home buyers easy entry into the housing market As can be seen from the graph below (“ Real Home Price Index”), the median house price has increased, in real terms, by more than 300% – from an average index of 100 between 1900 and 2000 to an index over 300 by the year 2008.

Relative to incomes, house prices have increased from three times median income to more than nine times income. That’s $600,000 they are not able to spend on other things – clothes, cars, furniture, appliances, travel, movies, restaurants, the theatre, children’s education, charities and many other discretionary purchase options.

It is a similar story in the UK, US, Canada, New Zealand, Ireland and Japan.

The economic consequences of this change have been devastating. The capital structure of these countries’ economies have been distorted to the tune of hundreds of billions of dollars and for those on middle and low incomes the prospect of ever becoming homeowners has now all but vanished. Housing starts are below what they should be and so have all the jobs associated with them – civil construction, house construction, transport, appliances, soft furnishings, you name it. Not to mention billions of dollars in lost taxes and other housing-related revenue to the nation state.

The distortion in the housing market, this misallocation of resources resulting from the supply-demand imbalance is enormous by any measure and affects every other area of a country’s economy. New home owners pay a much higher percentage of their income on house payments than they should. Similarly, renters are paying increased rental costs reflective of the higher capital and financing costs in turn paid by landlords.

Economies have been distorted and getting them back into alignment is going to take some time. But it is a realignment that is necessary. A terrible mistake was made and it needs to be corrected.

Capital gains stall in the final month of the year

According to the CoreLogic RP Data Home Value Index, dwelling values were absolutely flat across the combined capitals during December, with negative movements in Sydney, Adelaide and Canberra being offset by a rise in dwelling values across the remaining five capital cities. The Sydney housing market was the main drag on the December results, with dwelling values down 1.2%, while values were down 1.5% in Adelaide and 1.1% in Canberra. The remaining capitals saw a rise in dwelling values, led by a 2.3% bounce in Perth values and a 1.0% rise in Melbourne values over the month.

Index results as at December 31, 2015

2016-01-04--Dec_Index

After dwelling values had been broadly rising since June 2012, the December quarter results revealed a 1.4% fall in dwelling values across the combined capitals, the largest quarter on quarter fall since December 2011. Six of the eight capital cities recorded a negative result over the December quarter, with weaker conditions in Sydney and Melbourne acting as the greatest drag on capital city performance, according to CoreLogic RP Data head of research Tim Lawless.

The largest quarterly fall was recorded in Sydney, where dwelling values were down 2.3% over the final three months of the year, followed by Melbourne, where dwelling values were 1.9% lower. The only capital cities to show a rise in dwelling values over the December quarter were Brisbane (+1.3%) and Adelaide (+0.6%).

This was in contrast to the first three quarters of 2015, where capital city dwelling values rose by 9.3%, largely driven by a 14.1% surge in Sydney values and a 13.3% increase in Melbourne.  In stark contrast, the final quarter of 2015 showed Sydney as the weakest performer of any capital city, with dwelling values down by -2.3% while Melbourne recorded the second weakest result of -1.9%.

The complete 2015 calendar year results reveal a 7.8% increase in capital city dwelling values which is the lowest rate of capital gain over a calendar year since 2012 when values slipped 0.4% lower over the full year. Highlighting the diversity in the capital city housing markets, dwelling values fell across four of the eight capitals in the 2015 calendar year. The largest of these falls were recorded in Perth, down by 3.7%, and Darwin down by 3.6%. Hobart and Adelaide also showed subtle falls of 0.7% and 0.1%.

Despite the recent weakening of housing market conditions in Sydney and Melbourne, the two largest capital city housing markets still recorded much stronger annual gains than all other capital cities,  11.5% in Sydney and 11.2% in Melbourne. Dwelling values in Brisbane and Canberra were up a more sustainable 4.1% over the year.

Mr Lawless said, “The wealth created from housing in Sydney and Melbourne has been exceptional over the past twelve months.”

“In dollar terms, Sydney home owners have seen approximately $82,000 added to their wealth thanks to the strong capital gains over the year while home owners in Melbourne have seen the value of their dwelling grow by approximately $60,400. Brisbane home owners are $18,560 better off while Canberra owners have seen the value of their homes increase by approximately $21,900.”

“Home owners in the remaining capital cities have seen some erosion of their wealth via falls in the value of their dwelling. The largest losses have occurred in Perth where the average dwelling is now worth approximately $19,970 less than it was 12 months ago, while Darwin home owners have seen the value of their home shrink by a similar $18,150. The annual decline has been milder in Adelaide and Hobart, however dwelling values are still $515 lower in Adelaide over the year and down $2,430 in Hobart.”

“The slowdown in housing market conditions across Sydney and Melbourne in the last half of 2015 is being driven by a range of factors that can best be described as both organic and externally influenced. Organic market conditions have been derived from affordability pressures, rental yield compression and cyclical factors, while factors from external influences largely stem from a change in the regulatory framework introduced by APRA which has made it more expensive and difficult for investors to access housing finance. Added to this is higher mortgage rates and more restrictive credit policies and loan servicing requirements.”

Housing Price and Household Debt Interactions

A newly published IMF working paper looks at the relationship between house prices and household debt, in Sweden. The work is interesting because house prices have risen significantly, and household debt has risen substantially at a time when supply was limited. Australia is not the only country with these synonyms!

Sweden1The swings in house price growth have had wider amplitude than those of credit growth since the GFC. Whilst a loan-to-value ratio cap of 85 percent on all new mortgage loans was introduced in 2010 which may have affected lending growth, they still have tax relief on mortgage repayments.

Sweden-2The question the paper examines is the relationship between these higher prices and household debt levels. A common interpretation of the link between these markets is that mortgage lending drives housing prices up, motivating measures to curb credit. Yet, mortgage lending can also be driven by rising housing prices through the wealth
and collateral channels. Home ownership generally requires debt financing, especially as households usually acquire this major asset early in their life cycle. When house prices appreciate, households who own housing may perceive that their higher wealth allows for greater lifetime consumption, inducing households to borrow and spend more. At the same time, the higher value of housing assets expands the value of collateral against which borrowing is generally much cheaper than unsecured credit. Relaxing this collateral constraint thereby expands households’ borrowing capacity, which could be reflected in a combination of higher consumption and larger asset holdings. For households that do not yet own a house, higher prices increase the need to borrow but also relax collateral constraints.

The paper examines the interactions between housing prices and household debt using a three-equation model, finding that household borrowing impacts housing prices in the short-run, but the price of housing is the main driver of the secular trend in household debt over the long-run. Both housing prices and household debt are estimated to be moderately above their long-run equilibrium levels, but the adjustment toward equilibrium is not found to be rapid. Whereas low interest rates have contributed to the recent surge in housing prices, growth in incomes and financial assets play a larger role. Policy experiments suggest that a gradual phasing out of mortgage interest deductibility is likely to have a manageable effect on housing prices and household debt.

Note that IMF Working Papers describe research in progress by the author(s) and are published to elicit comments and to encourage debate. The views expressed in IMF Working Papers are those of the author(s) and do not necessarily represent the views of the IMF, its Executive Board, or IMF management.

Was the housing boom in Sydney and Melbourne driven by foreign buyers?

From The Conversation.

House prices rose by an average of 64% in Sydney and Melbourne in the decade from 2004 to 2014. At the same time foreign investment proposals in developed real estate rose by almost tenfold. This correlation led to a lot of anecdotal stories of Chinese buyers driving up prices and to a Parliamentary Inquiry.

How much can we attribute the decade-long housing boom in Sydney and Melbourne to foreign buyers? The numbers are hard to find and a little rubbery, but our best econometric estimate is that about one quarter of the growth in house prices in Sydney and Melbourne can be attributed to foreign investment.

This means that if foreign investment had been steady over the period, average house prices would have grown by about 50% compared with the actual growth of 67%. In the other capital cities, by the way, the growth in house prices was much less and it was not possible to find any econometrically significant effect of foreign buyers.

This amounts to a modest effect of foreign investment on house prices in Sydney and Melbourne. The hype about Chinese buyers driving up house prices appears to be overstated – at least in terms of the effect on average house prices – there may have been more significant effects in certain locations.

The quality of data however is a failure of public administration. The Parliamentary Inquiry essentially came to this conclusion. It found that there is no accurate data on foreign investment in Australian real estate and therefore “no-one really knows how much foreign investment there is in residential real estate”.

The Inquiry also noted there had been no court action by the Foreign Investment Review Board (IRB) since 2006 in relation to foreign real estate investment. The Australian Taxation Office has however moved since then to force the sale of a property bought by a foreign buyer without government approval.

The law prevents foreign citizens from purchasing established housing for their own homes or as investment properties, except for one or two narrow exemptions. Clearly there has been inadequate monitoring of purchases to enable this law to be enforced. However if the concern is about house prices and the effect on affordability, then the role of foreign purchases is not at all clear.

If foreigners buy a house to rent out to someone who is already in the housing market such as a non-citizen student in Australia, there is no net increase in the demand for housing and therefore no pressure on house prices. Nor is there any net impact on housing demand and therefore on prices if foreign buyers eventually become foreign sellers. And again, if foreign buyers eventually become permanent residents their purchases represent a shifting forward of housing demand rather than a long run increase in housing demand.

All of which is to say that simply looking at foreign purchases of real estate does not give us a very accurate guide as to the net impact on house prices.

Then there is the tenuous link from house prices to housing affordability. First home buyers generally purchase the cheaper dwellings and established rather than new dwellings, both of which are housing categories where foreign investment is less evident. In any case, other work by the Reserve Bank of Australia finds that house price growth over the past 30 years can be largely explained by fundamental factors such as financial deregulation, the ability of housing supply to respond to demand, and population growth driven by immigration. This suggests that foreign direct investment may have played relatively minor role in explaining house price growth.

If the public policy concern is more about housing affordability, then policies that aim to boost housing supply and that address tax and retirement income policies favouring housing over other asset classes would be more effective than a clamp-down on foreign real estate investment.

Some people seem to worry not so much about housing affordability but about foreigners gaining control over Australian real estate assets. This is hard to fathom because when foreigners buy an asset in Australia, whether it is a real asset like property or a financial asset like shares or bonds, there is no transfer of wealth to foreigners. Indeed quite the reverse – if foreigners are willing to pay more for our assets than any Australian citizen, this cannot be a loss of wealth to Australia.

Despite all of these qualifications and complications, we need to know more about foreign purchases of residential real estate. The Parliamentary Inquiry’s recommendation seems sensible: to establish a national register of land title transfers that records the citizenship and residency status of all purchases of Australian real estate.


uthors: Ross Guest, Professor of Economics and National Senior Teaching Fellow, Griffith University,  Nicholas Rohde, Lecturer in Economics, Griffith University.


Increasing loan size brings housing affordability down

The latest edition of the Adelaide Bank/ REIA Housing Affordability Report shows that overall housing affordability in Australia declined over the September quarter with homes becoming less affordable in five out of the eight states and territories.

The report provides a comprehensive update for the sector using the latest data for the September Quarter 2015.

REIA President Neville Sanders says, “The latest REIA Housing Affordability Report shows that the proportion of median family income required to meet average loan repayments was 31.7%. The figure increased 1.4 percentage points during the quarter and 1.3 percentage points compared to a year ago largely due to the increasing size of new loans.”

“Sadly, the deterioration was seen in most states and territories and the overall level of housing affordability now is at its worst level since March 2013. Western Australia and the Australian Capital Territory were the only jurisdictions to record improvements while the proportion of the median family income required to meet average loan repayments remained unchanged in the Northern Territory.”

“Already the least affordable, New South Wales recorded the biggest fall in housing affordability across the country. New South Wales is still the only state or territory with an average loan size above $400,000, however Victoria follows closely at $390,503.”

“The report shows overall rental affordability improved over the quarter with 24.6% of the median family income now required to pay median rents. The proportion of the median family income required to meet median rents was sitting at 23.4% in Queensland, 23.2% in South Australia and 24.1% in Tasmania.”