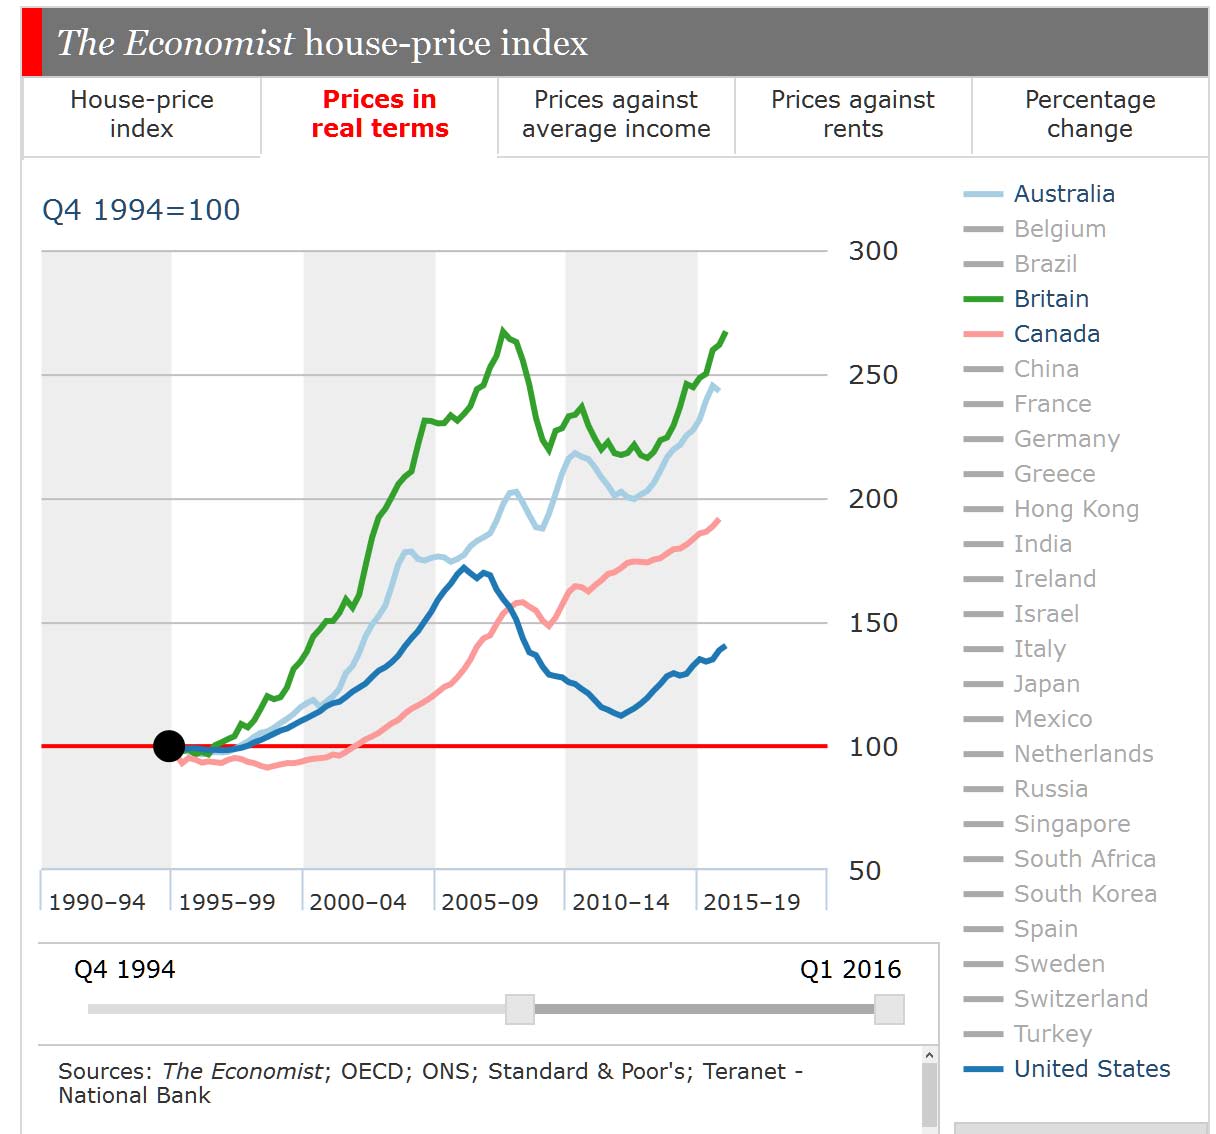
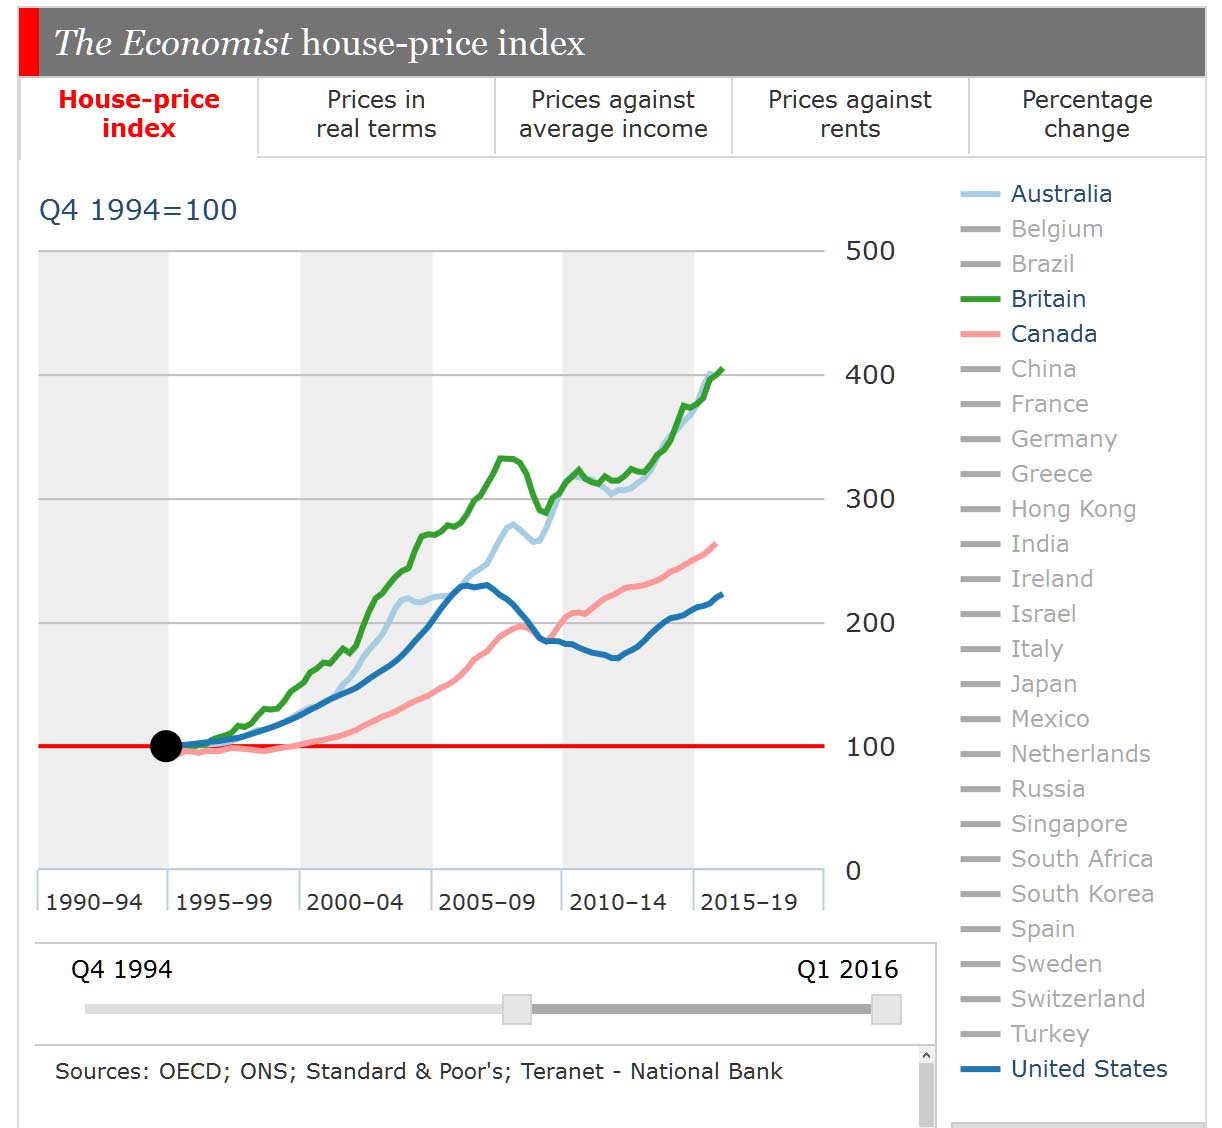
Tapping super not the answer to home ownership decline

From The Conversation.

“All Australians should be able to retire with dignity and decent living standards.”

So states the recently released superannuation report of the Committee for Economic Development of Australia (CEDA).

CEDA’s report is commendable. And although I agree with most of its recommendations, including what the purpose of super should be, how retirement income products dealing with longevity risk should be developed and how super tax laws should be made more equitable, I have one serious misgiving: I do not believe active employees should be able to use their super funds to invest in owner-occupied housing.

The American 401(k) system (also a defined contribution model like Australian super) provides a cautionary tale on the damage caused by what’s known as pre-retirement leakage. Unlike Australia, it is fairly easy for US workers to access their 401(k) retirement accounts during active employment. Even prior to preservation age, which is 59½ in the US, individuals are able to use their workplace retirement accounts for a number of purposes, both with and without tax consequences.

For instance, the US tax code allows individuals under specified circumstances to take loans against the value of their retirement funds without tax penalty. Although such funds are required to be secured and paid back like any other commercial loan, studies show many employees are never able to restore the money to their 401(k) accounts. Not only does this lead to diminished pension pots, it also means there will be less money upon which interest or investment returns can build on in the long-term.

The US 401(k) system also permits employees to take hardship distributions for a number of reasons, including purchasing of a first home, university education and medical expenses. In these circumstances, not only does the individual not face any tax penalties for the withdrawal (except for having to pay ordinary income tax), they are also not required to pay back the money to their account.

Finally, employees can take money out of their 401(k) accounts if they “really” want. What I mean is, absent even an authorised loan or hardship distribution, employees before preservation age can withdraw funds from their retirement accounts. We call this “expensive money” because both a 10% excise tax and 20% employer withholding of funds apply. In the end, these employees receive 70 cents in the dollar for withdrawing money prematurely from their retirement account.

Such leakage in the US causes a significant erosion of assets in retirement – approximately 1.5% of retirement plan assets “leak” out every year. This can potentially lead to a reduction in total retirement assets of 20% to 25% over an employee’s working years, according to experts.

Remember the role of super

I do not disagree with the CEDA report that housing makes a critical contribution to sustaining living standards and helping to address elderly poverty. Needless to say, there should be a multipronged federal government response to the spectre of increasing poverty in old age because of the lack of home ownership. Many useful suggestions are made in the CEDA report in this regard.

But using super, even if only for first-time home buyers, should not be the answer. Indeed, CEDA agrees with much of the recent Financial System Inquiry report (the Murray report), which concludes that super legislation should state explicitly and clearly that its purpose is to provide retirement income.

While increasing home ownership for younger workers is an admirable policy prescription, it is not consistent with the retirement income focus of super. Allowing workers to use their super funds to buy homes means there will be much less money in the pension pot to grow over time to provide the necessary retirement income.

And the harm is ongoing. Making such a change would lead to a further constrained supply of housing, meaning more money chasing the increasingly limited stock of property, tending to drive home prices up even further.

Of course, when, not if, the housing market crashes, much of the super savings tied into such property will also be lost. This problem stems from a lack of diversification in one’s retirement portfolio through an over-investment in the family home. The consequent lack of investment diversification among asset classes means super is less likely to be able to survive future shocks to the Australian economic system.

The lesson from the United States is clear: pre-retirement leakage from super should be permitted only under the most exceptional of circumstances. Even for the very best of reasons, like first-time home ownership, Canberra should prevent super fund leakage during active employment to ensure the primary objective of super: retirement income adequacy.

Author: Paul Secunda, Senior Fulbright Scholar in Law (Labour and Super) at University of Melbourne

Capital Gains Up, But Rental Yields Down – CoreLogic RP Data

According to the CoreLogic RP Data August 2015 Home Value Index, capital city dwelling values continued to rise over the month whilst growth in weekly rental rates shifted to a new record low for annual growth over the month of August.

2015-09-01-indices-tableThe headline results show that dwelling values were 0.3 per cent higher over the month across the eight capital city index. The highest month-on-month movement was in Sydney, where dwelling values were 1.1 per cent higher, while dwelling values also moved higher across Adelaide (0.7 per cent) and Darwin (0.3 per cent), and were flat over the month in Melbourne and Brisbane. The remaining capital cities recorded a month-on month fall in dwelling values.

While the August results indicate a slowdown in the rate of appreciation in dwelling values, the quarterly figures highlight just how strong the housing market has been over the past three months; combined capital city dwelling values are 5.3 per cent higher over the three months to the end of August this year.

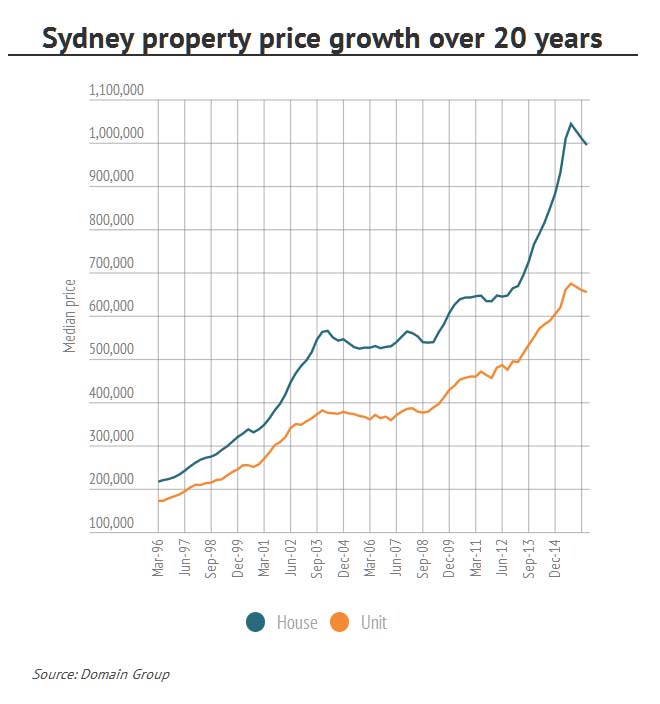
Sydney dwelling values are 17.6 per cent higher over the past year, and since the beginning of 2009, Australia’s largest capital city housing market has recorded a cumulative capital gain of 76 per cent. Using the median house price from January 2009 as a base, the typical Sydney home owner has seen the value of their home increase by approximately $309,000 since the beginning of 2009.

The only cities where dwelling values declined over the past twelve months have been Darwin (-4.6 per cent), Perth (-1.8 per cent) and Canberra (-0.9%).

Growth in weekly rental rates shifted to a new record low for annual growth over the month of August. Across the combined capital cities, the median weekly rental rate rose
by just 0.7 per cent over the past twelve months, with house rents up 0.5 per cent and unit rents up a higher 1.6 per cent.

Since May 2013, dwelling values have risen at a faster pace than weekly rents. “The result of the disparity between dwelling values and dwelling rents has been a consistent downwards trend in gross rental yields.

Gross yields are at record lows in both Sydney and Melbourne. A typical dwelling is attracting a gross yield of just 3.3 per cent and 3.1 per cent respectively across Australia’s two largest cities. Mr Lawless said that the low yield scenario has largely been overlooked by investors who appear to be more focused on chasing future anticipated capital gains rather than aiming for cash flow.

The Long-Term Evolution of House Prices: An International Perspective

Excellent speech from Lawrence Schembri, Deputy Governor, Canadian Association for Business Economics on house price trends. The speech, which is worth reading, contains a number of insightful charts. Australian data is included. He looks at both supply and demand issues, and touches on macroprudential.  You can watch the entire speech.

I have highlighted some of the main points:

First, Chart 1 shows indexes of real house prices since 1975 for two sets of advanced economies. Chart 1a shows Canada and a set of comparable small, open economies (Australia, New Zealand, Norway and Sweden) with similar macro policy frameworks and similar experiences during and after the global financial crisis. In particular, they did not have sizable post-crisis corrections in house prices. For comparison purposes, Chart 1b shows a second set of advanced economies that did experience significant and persistent post-crisis declines in house prices.

Real-House-PricesSince 1995, house prices in Canada and the set of comparable countries have increased faster than nominal personal disposable income (Chart 2a). During this period, all of these countries experienced solid income growth, with the strongest growth in Norway and Sweden (Chart 2b).

Price-to-IncomeDuring the global financial crisis, these countries also experienced house price corrections. This caused the ratios of house prices to income to decline temporarily, after which they continued climbing.

One of the factors that has affected population growth rates is migration. Net migration was highest in Australia and Canada over the entire sample. In addition, net migration increased importantly in all five countries in the second half of the sample period (Chart 3b)

population-GrowthIn Australia, Canada and New Zealand, the rate of population growth of the approximate house-owning cohort of those aged 25 to 75 declined in the second part of the sample period. This likely reflects the aging of their populations as the postwar baby boom generation moved from youth into middle age (Chart 4). Nonetheless, the growth rate of this cohort still remains well above 1 per cent for these three countries.

CohortsChart 9 provides some suggestive evidence on the impact of land-use regulations on median price-to-income ratios. Many of the cities with higher ratios also have obvious geographical constraints—Hong Kong and Vancouver are good examples—so the two sources of supply restrictions likely interact to put upward pressure on prices.SupplyWhen we look at the post-crisis experiences of the countries in our comparison group, they have similar levels of household leverage, measured by household debt as a ratio of GDP (Chart 12). Household leverage has risen along with house prices, as households have taken advantage of low post-crisis interest rates. The one exception is New Zealand, where a modest degree of household deleveraging seems to have occurred. For Canada, the ratio of household debt to GDP has risen since 1975, although the growth of this ratio has notably declined since 2010. For Sweden and Norway, the ratio also grew at a modest pace in the post-crisis period. Note Australia has the highest ratios.

LeverageCharts 13a and b draw on recent work by the IMF, which shows that macroprudential policies in the form of maximum loan-to-value (LTV) or debt-to-income (DTI) ratios have tightened across a broad range of countries over the past 10 years. The IMF’s research, as well as that of other economists, has found evidence suggesting that the tightening has helped to: reduce the procyclicality of household credit and bank leverage; moderate credit growth;
improve the creditworthiness of borrowers; and lower the rate of house price growth.

The most effective macroprudential policies to date appear to have been the imposition of maximum LTV and DTI constraints. Increased capital weights on bank holdings of mortgages have also had an impact. While long-term evidence on these instruments is not yet available, permanent measures that address structural regulatory weaknesses and that are relatively straightforward to implement and supervise will likely be the most effective over time.

MacroprudentialInteresting to note that in Canada, they have had four successive rounds of macroprudential tightening, primarily in terms of the rules for insured mortgages. The maximum amortization period for insured loans has been shortened from 40 years to 25. LTV ratios have been lowered to 95 per cent for new mortgages, and 80 per cent for refinancing and investor properties. These latter two changes effectively eliminate new insurance for refinancing and investor properties. Qualification criteria such as limits on the total debt-service ratio and the gross debt-service ratio, as well as requirements for qualifying interest rates, have also been tightened.

Conclusion

Let me conclude with a few key points from the mountain of facts, graphs and analysis that I have reviewed with you today. As I mentioned at the outset, the purpose of my presentation is to help provide more context for an informed discussion about housing and house prices given their importance to the Canadian economy and the financial system.

First, real house prices have been rising relative to income in Canada and other comparable countries for about 20 years. There are many possible explanations, mostly from the demand side, but also from the supply side.

Second, in terms of demand, demographic forces, notably migration and urbanization, have played a role in the evolution of house prices, as have improving credit conditions through lower global real long-term interest rates and financial liberalization and innovation. There are, of course, other demand factors that warrant more data and analysis, including the impacts of foreign investment and possible preference shifts.

Third, in terms of supply, the constraints imposed by geography and regulation have decreased housing supply elasticity, especially in urban areas. This reduced supply elasticity has interacted with demand shifts toward more urbanization to push up house prices in major cities.

Fourth, the credible and effective macro and financial policy frameworks in place in Canada and the other countries considered here have contributed to a high degree of macroeconomic and financial stability. Consequently, in the face of a protracted global recovery, their countercyclical policies successfully underpinned domestic demand in the post-crisis period. The resulting strength in the housing market has increased household imbalances, but the risks stemming from these vulnerabilities have been well managed by complementary macroprudential policies.

The experience in these countries therefore suggests that macroprudential policies that address structural weaknesses in the regulatory framework are best suited for mitigating such financial vulnerabilities. They reduce tail risks to financial stability and enhance the overall resilience of the financial system.

RBA Says Financial Stability More Important Than More FTB Housing Entry

In her opening Statement to House of Representatives Standing Committee on Economics Inquiry into Home Ownership, Luci Ellis, Head of Financial Stability Department makes a telling point. From the RBA’s perspective, financial stability is more important than easing lending standards for first time buyers. They also recognise that the rise of investors is pushing prices higher, and excluding some FTB market aspirants. No reference though to the changed behaviour of FTB who are now going direct to the investment sector, a significant move in our view, as recently discussed. They also see property as a saving vehicle for old age which is further recognition property is regarded as just another asset class from a wealth accumulation perspective.

The Reserve Bank recognises the importance of housing to Australians: it provides us with shelter; housing costs are a large part of household spending; and a home is the biggest purchase that many of us will make. It is therefore no surprise that housing-related issues have been the subject of several inquiries over the past decade or so.

Within that broader realm of housing, the Bank recognises that home ownership is an aspiration of many Australians. Outright home ownership is widely regarded as key to avoiding poverty in old age. Before that life stage, home ownership is also regarded as a way to obtain the security of tenure that is so important to the wellbeing of many households, especially families with dependent children. Security of tenure can allow households to enjoy stable arrangements for education, child care and community engagement; it avoids the costs and disruptions involved in frequent moves, which many renters experience.

The interest of the Reserve Bank in housing-related matters goes to the heart of its mandated policy responsibilities. The housing sector is one of the most interest rate sensitive parts of the economy. So a significant part of the transmission of the Board’s monetary policy decisions to the real economy comes via housing markets.

Housing market developments are also highly relevant to the Reserve Bank’s mandate to promote financial stability. Housing is the most important asset class for the household sector; it provides security for the finance of many small businesses; and housing-related lending represents a large fraction of the business of the Australian banking system. History shows that housing loans have not generally been as risky as other loans, but such is the size of the sector, the risks involved are nonetheless important. Recent history from around the world also shows that although households’ mortgage borrowings typically do not instigate financial crises and distress, they can do so if the institutional arrangements and lending standards are configured to allow it. Australia is a long way from that situation and we want to ensure that remains true. More broadly, we want to promote financial stability by making sure that Australians are generally resilient to the financial shocks that might come their way. How much they pay for housing and how they finance that purchase strongly influence their resilience.

As the Reserve Bank’s submission to this Inquiry outlined, trends in the housing market and in patterns of home ownership have shifted over recent decades. Perhaps the most obvious shift was the significant increase in housing prices relative to incomes between the late 1990s and mid 2000s. As the Bank has explained on previous occasions, most of this increase was in response to financial liberalisation and to the decline in inflation in the early 1990s. These were one-off changes, so this transition will not be repeated. And because the rise in housing prices was largely driven by a decline in mortgage interest rates, it does not necessarily imply that purchasing a home and servicing a mortgage afterwards has become less achievable. Indeed during this period, Australia’s overall home ownership rate was broadly stable. At the same time, the amount and quality of housing that Australians actually consumed, in terms of size of home, number of bedrooms and so forth, has, if anything, increased.

Of course, beyond these broad aggregates, people’s individual circumstances differ, and therefore so do their housing experiences. Within that broadly stable overall rate of home ownership, the rate for younger households has declined somewhat over time. These are the core age groups of first-time buyers. At least some of that decline occurred before the marked rise in housing prices relative to income, so it cannot all be attributed to affordability issues.

Whether home ownership is affordable depends on one’s definition and is open to debate. But there is no disputing that housing is expensive. It is clear that part of the reason for this is that demand is strong. Over the longer term, this can be at least partly explained by the effects of disinflation and financial liberalisation that I referred to earlier. More recently, demand has been boosted by population growth and by declines in interest rates.

As also noted in the Reserve Bank’s submission, Australia faces a number of longstanding challenges in meeting that strong demand. The population is highly urbanised and concentrated in a few large cities, and housing prices are typically higher in large cities. Australia’s cities are unusually low density compared with those in other developed countries, so the urban fringe locations where first home buyers have typically located are therefore becoming further out and potentially inconvenient for access to jobs and some services. Some of our major cities also face geographic constraints on their expansion. All of these factors tend to increase the price of well-located housing. In addition, the cost of providing new supply can be quite high because of the costs and delays involved in obtaining all the necessary approvals and in providing the necessary infrastructure to service the land.

Another area where Australia seems quite unusual is that most rental housing is owned by private individuals who are not full-time professional landlords. Investor interest in property has been especially strong in recent years, no doubt partly encouraged by low interest rates and the prospect of (concessionally taxed) capital gains. Investors typically have more equity and borrowing capacity than first home buyers and perhaps also other owner-occupiers, and might therefore be more able and willing to pay higher prices than other types of buyers for particular properties. The result has been that the housing sales market has become unusually concentrated in investor activity, particularly in the larger cities. At the margin this has probably priced some aspiring first home buyers from properties they could otherwise acquire. Nonetheless, while there has been much debate on this issue, from a financial stability point of view it is helpful that there has been no push to improve the position of first home buyers by easing lending standards. As recent experiences in other countries have shown, such a step would probably be counterproductive in the longer run.

DFA Survey Shows Property Demand Remains Strong

Following on from yesterdays video blog on the overall results from the latest household surveys, over the next few days, we will dig further into the data. We start with some cross segment observations, before in later posts, we begin to go deeper into segment specific motivations. You can read about our segmentation approach here. Many households still want to get into property – demand is strong, thanks to lower interest rates, despite high home prices and flat incomes. Future capital growth is expected by many in the market, and by those hoping to enter. This despite a fall in household confidence, as measured in our finance confidence index.

We start with savings intentions. Prospective first time buyers are saving the hardest, despite the lower interest being paid on deposits. More than 70% are actively saving to try and get into the market (though we will see later, more are switching to an investment purchase). Portfolio and solo property investors are saving the least – despite the recent changes to LVR’s on loans.

A significant proportion of those saving are actively foregoing other purchases and spending less, so they can top up their deposits. A higher proportion are also looking to the “Bank of Mum and Dad” for help.

SurveySavingJuly2015Looking next at borrowing intentions over the next 12 months (an indication of future mortgage finance demand), down-traders are slightly less likely to borrow now, compared with a year ago, whilst investors are firmly on the loan path. First time buyers will need to borrow. Refinancers are active, and one motivation we are seeing is the extraction of capital during refinance, onto a lower interest rate.

SurveyBorrowJuly2015Many households are still bullish on house price growth. Investors are the most optimistic, whilst down-traders the least. There are significant state differences, with those in the eastern states more positive than those elsewhere.

SurveyPricesJuly2015So, who is most likely to transact? Portfolio investors are most likely, then down-traders, and solo investors. There is also a lift in the number of households looking to refinance, to take advantage of lower interest rates. The recent public announcements by the banks, about tightening lending criteria appears to have encouraged some to bring forward their plans to purchase, in the expectation that later it may be more difficult to get a loan.

SurveyTransactJuly2015The recent tweaks in rates are having no impact on household plans, as the absolute rates are still very low – lower than ever – for many. We conclude that the demand side of the property and mortgage markets are still intact.

Next time we will look in detail at data from first time buyers, and then investors.

What Factors Drive A House Price Boom?

Interesting working paper from the IMF – “Price Expectations and the U.S. Housing Boom”. Essentially, expectation of future prices – unrelated to any fundamentals –  has had a significant role to play.

Between 1996 and 2006 the United States has experienced an unprecedented boom in house prices. There is no agreement on the ultimate cause for the boom. Explanations include a long period of low interest rates, declining credit standards, as well as shifts in the supply of houses and the demand for housing services. Several studies have, however, pointed out that it is difficult to explain the entire size of the boom with these factors and have offered speculation or “unrealistic expectations about future prices” as an alternative explanation. The empirical argument for an important role of house price expectations is often indirect: it is a residual that cannot be explained by a model and its observed fundamentals.

Instead of treating speculation as a deviation from a benchmark, the present paper aims to identify shifts in house price expectations directly and compare their importance to other explanations. To that purpose, we estimate a structural VAR model for the United States and use sign restrictions to identify house price expectation shocks. We then compare their effect to other shocks, including shocks to mortgage rates and shocks to the demand for housing services and the supply of houses.

Results indicate that house price expectation shocks are the most important driver of the recent U.S. housing price boom between 1996 to 2006, explaining about 30 percent of the increase. Over the entire sample, their contribution to fluctuations in housing prices in the U.S. has been smaller, accounting for about 20 percent of the long run forecast error variance of house prices. This suggests that the large contribution of price expectation shocks is historically exceptional. Regarding other shocks, mortgage rate shocks are the second most important driver of the boom: their contribution amounts to about 25 percent. Over the entire sample, they are the most important driver and account for almost 30 percent of the long run forecast error variance. Shocks to the demand for housing services and supply of houses play a subordinated role for fluctuations in house prices, both for the boom period and over the entire sample. Taken together, the four shocks explain about 70 percent of the house price boom, leaving a residual of about 30 percent. This indicates that attributing the entire residual that cannot be explained by standard shocks to price expectations will lead to an overestimation of their contribution. We also find that a model-based measure of house price expectations is positively correlated with leads of a survey based measure of house price expectations. The positive correlation with leads indicates that our measure contains similar information as a survey-based measure. In addition, it tends to provide the information more timely.

We find that the contribution of price expectation shocks to the U.S. housing boom in the 2000s has been substantial. In our baseline specification, price expectation shocks explain roughly 30% of the increase. Another 30% of the increase in house prices remains, however, unaccounted for by the four identified shocks. This indicates that attributing the entire residual that cannot be explained by standard shocks to price expectations will lead to an overestimation of their contribution. We also find that a model-based measure of house price expectations is strongly positively correlated with leads of a survey based measure of house price expectations. This indicates that our measure contains similar information as a survey-based measure, but tends to provide the information more timely. Our approach to identify price expectation shocks leaves the reason why expectations change open. When using an additional constraint to distinguish realistic from unrealistic price expectation shocks, we provide evidence that the housing boom was driven to an important extent by unrealistic price expectations. The analysis has focused on exogenous changes in expectations. An interesting topic for future empirical research is how expectations respond endogenously to other shocks.

Note: IMF Working Papers describe research in progress by the author(s) and are published to elicit comments and to encourage debate. The views expressed in IMF Working Papers are those of the author(s) and do not necessarily represent the views of the IMF, its Executive Board, or IMF management.

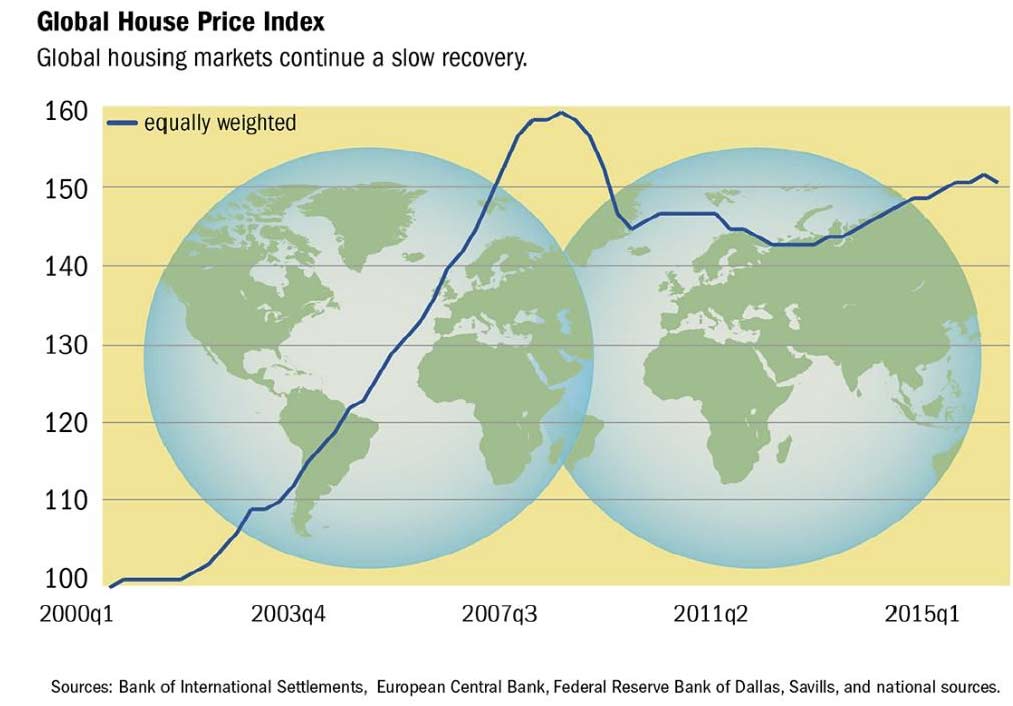
Global House Price Index Up; Australia In The Middle Of The Pack

The IMF just released their Global House Price Index update. It is also worth noting that Australia, whilst experiencing significant house price growth and affordability issues, is in the middle of the pack. House prices are being impacted by significant international issues, not just local ones (factors such as financial globalisation, QE, low interest rates, low growth, rise of the Asian property investor).

Globally, house prices continue a slow recovery. The Global House Price Index, an equally weighted average of real house prices in nearly 60 countries, inched up slowly during the past two years but has not yet returned to pre-crisis levels.

http://www.imf.org/external/research/housing/images/globalhousepriceindex_lg.jpg

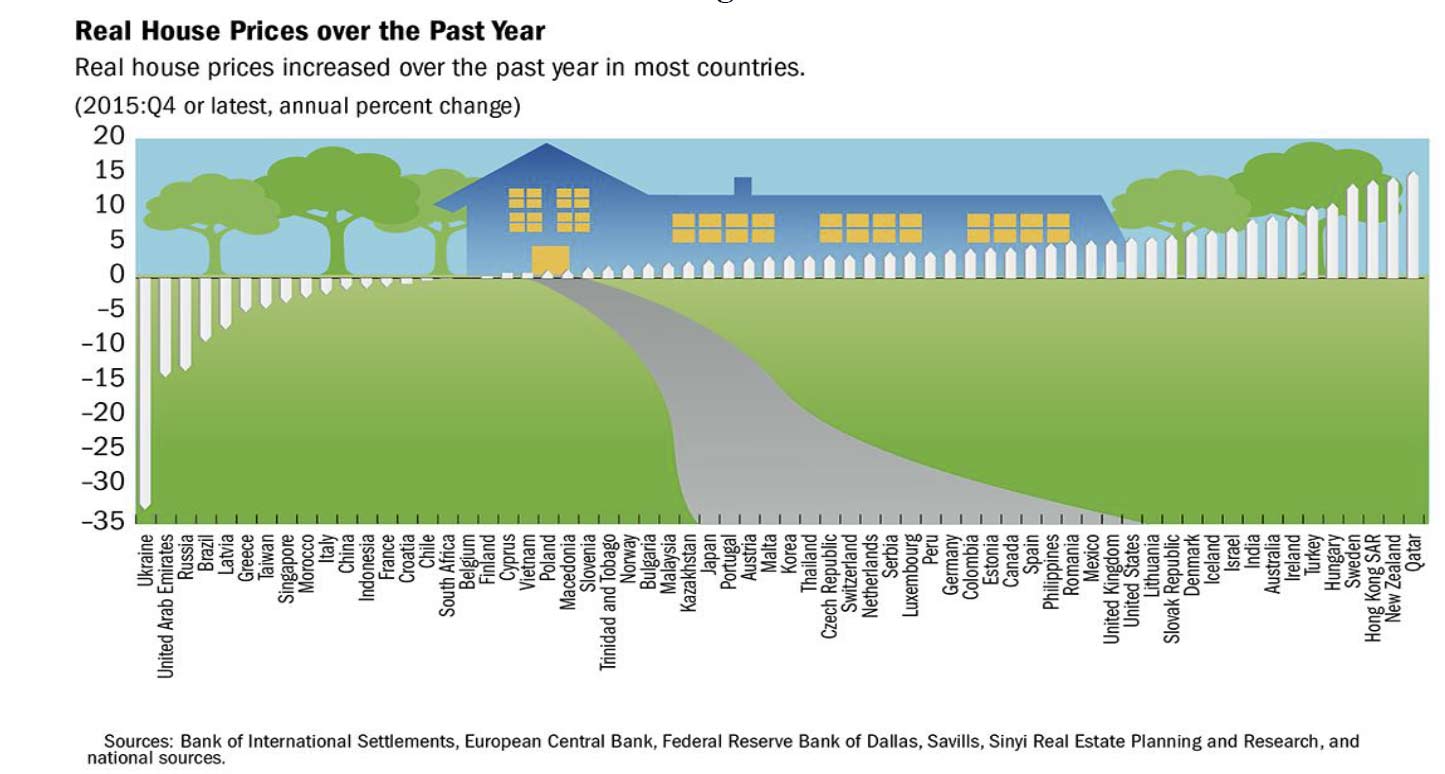
The overall index conceals divergent patterns: since 2007:Q3 house prices rose in a third of the countries included in the index and fell in the other two-thirds. However, the picture may be changing: over the past year, real house prices increased in two-thirds of the countries and fell in the other third.

Cumulative Real House Price Growth Since 2007:Q3

IMFJuly2Real House Price Growth Over the Past Year

IMFJuly3

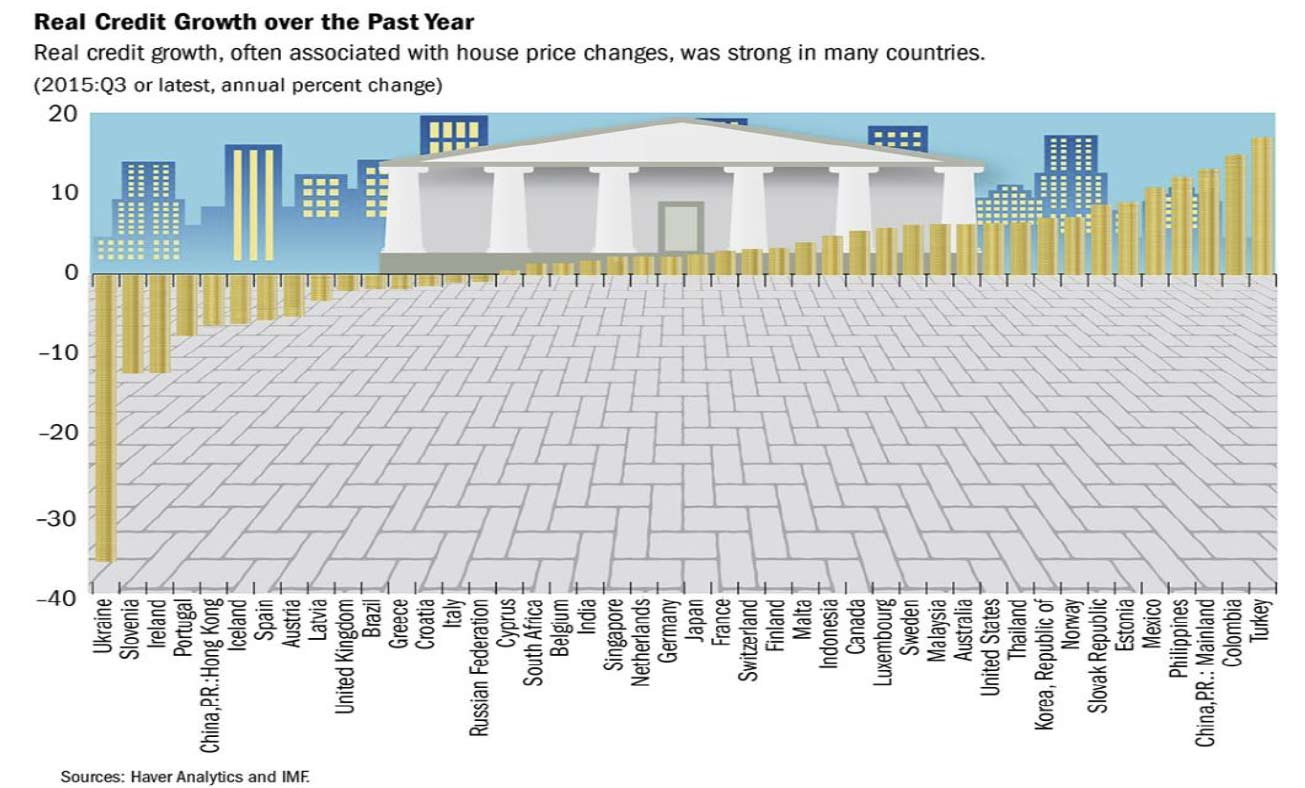
Many countries in which house prices had been falling (such as Spain and the United Arab Emirates) have seen increases over the past year. Conversely, some countries where prices had been rising rapidly (as Brazil, China and Peru) have seen moderation in the rate of increase or a fall over the past year. As has been the case historically, house price growth and credit growth have gone hand-in-hand over the past five years. Clearly, however, credit growth is not the only predictor for the extent of house price growth; several other factors appear to be at play.

House Prices and Credit Growth

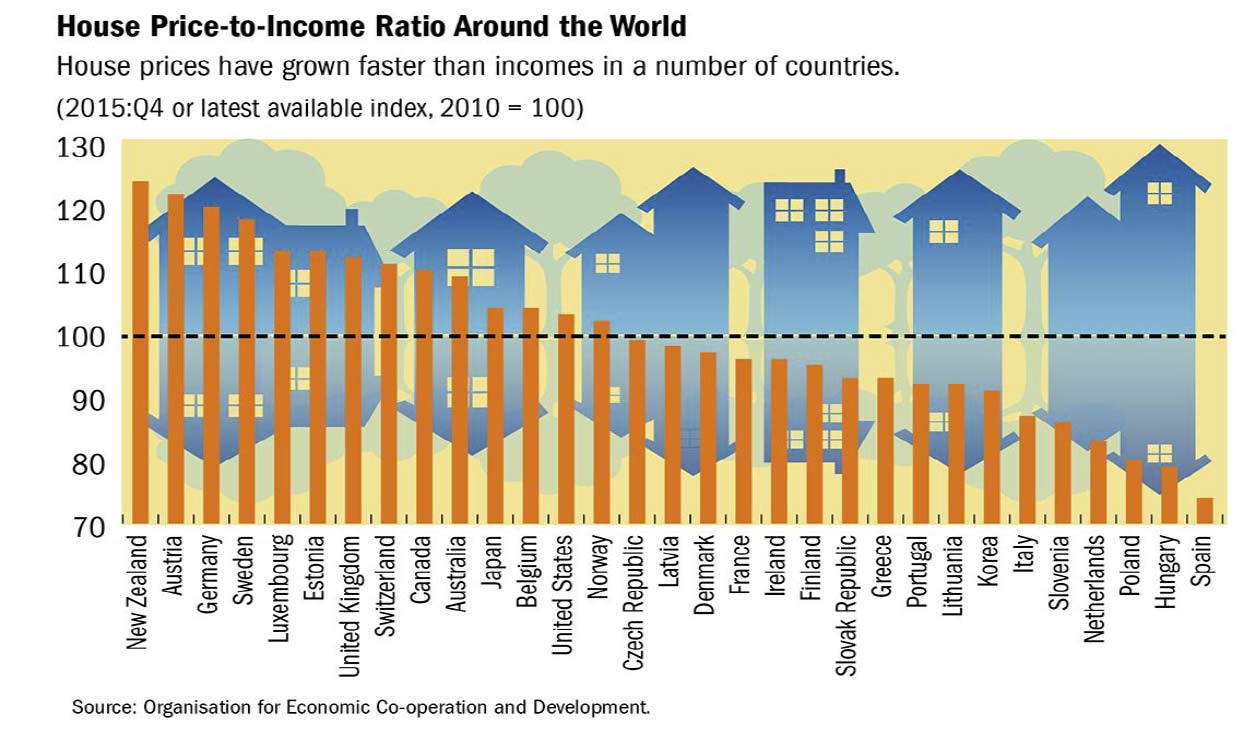
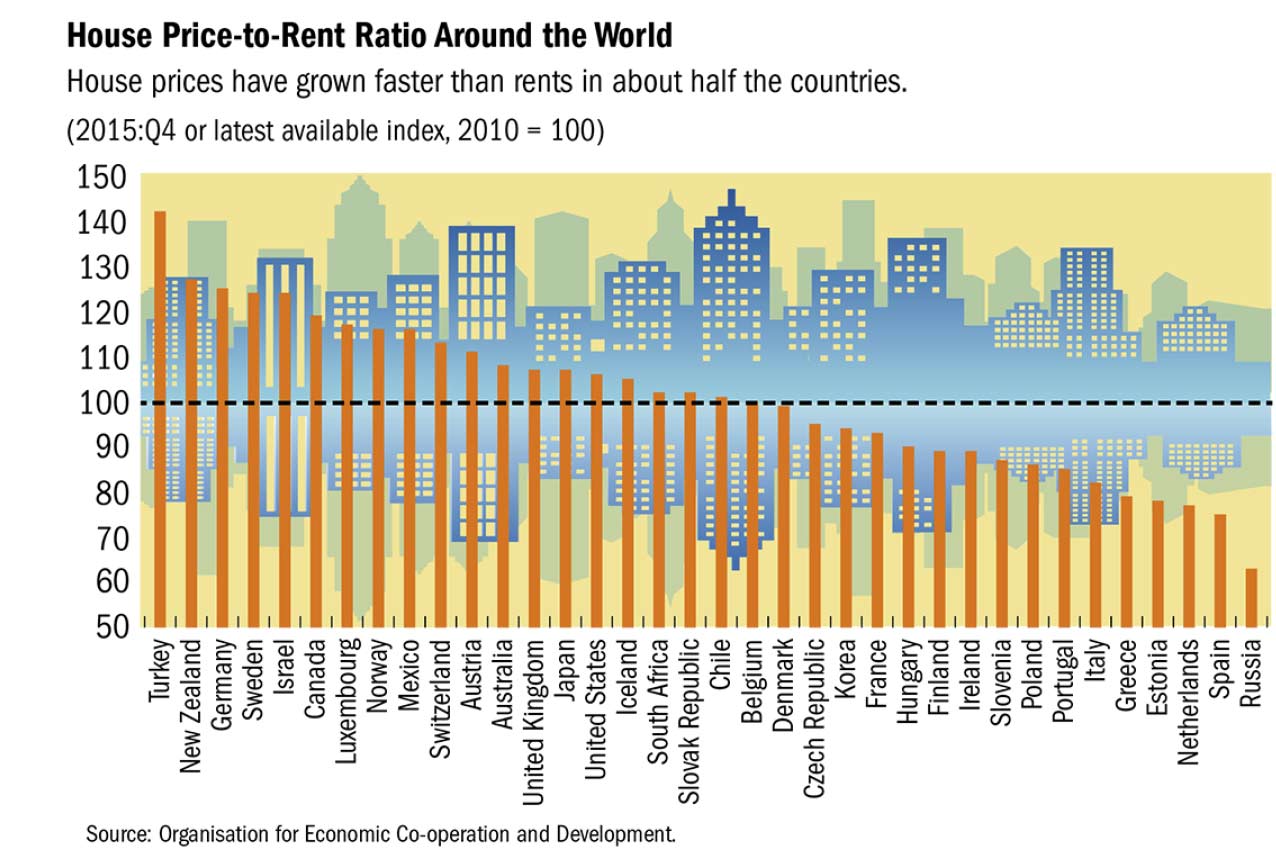
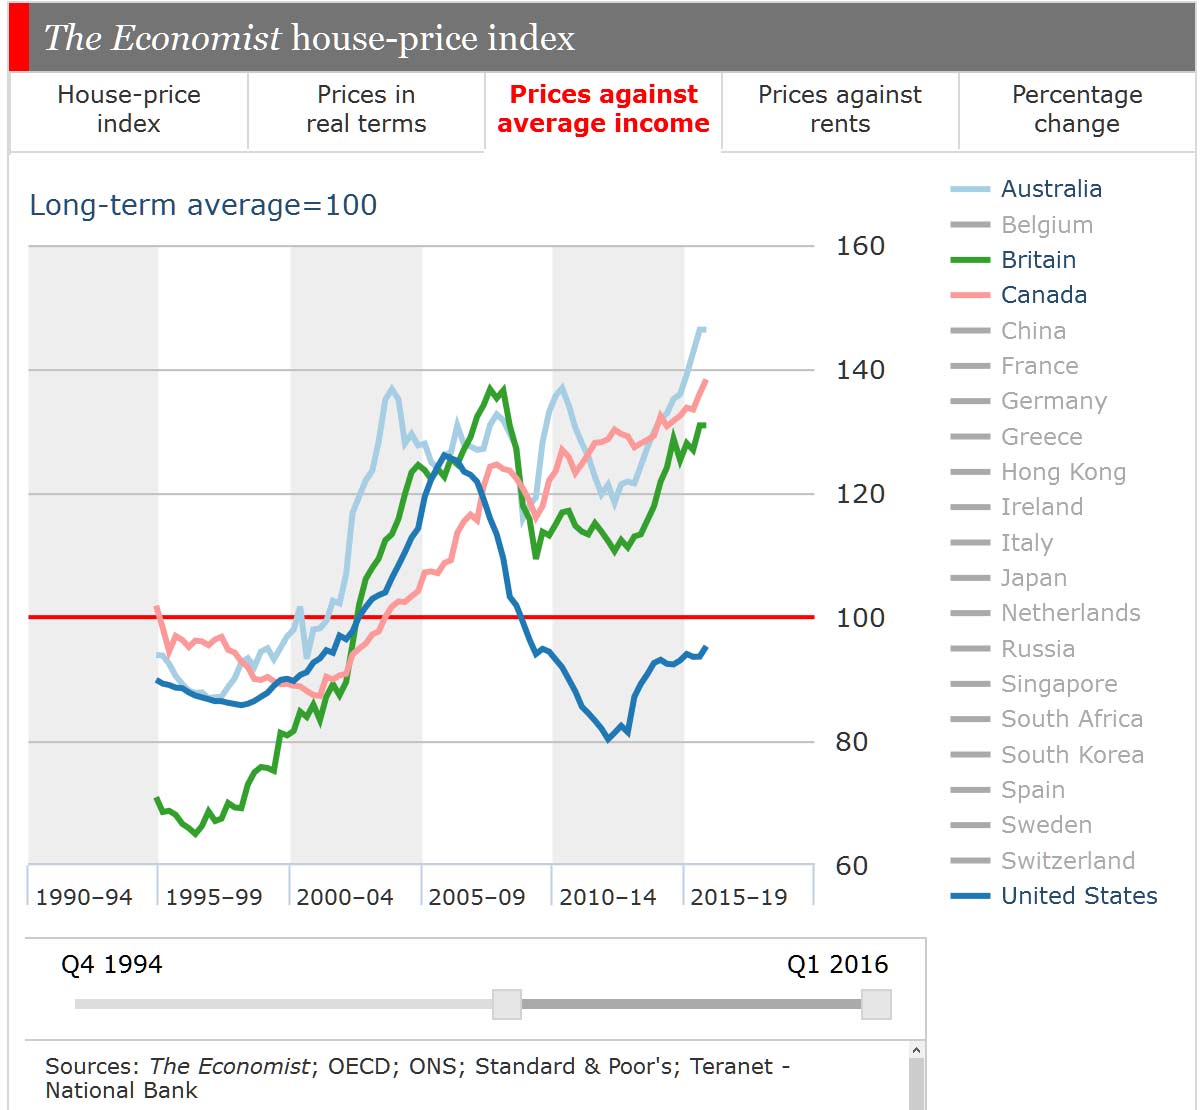
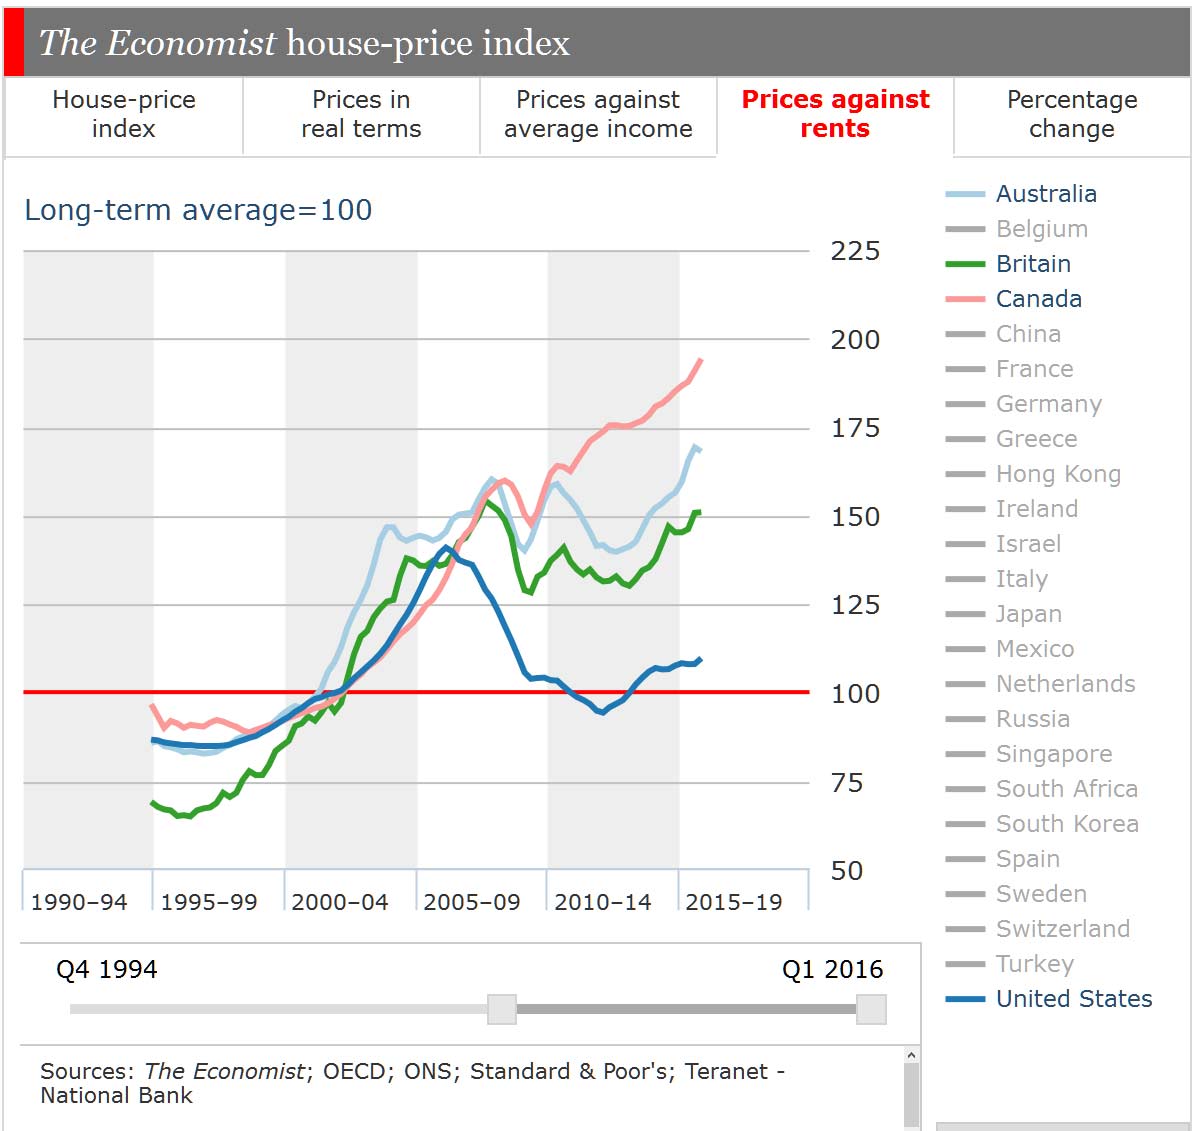
IMFJuly4 For OECD countries, house prices have grown faster than incomes and rents in almost half of the countries. These house price-to income and house price-to-rent ratios are highly correlated.

http://www.imf.org/external/research/housing/images/pricetoincome_lg.jpg

http://www.imf.org/external/research/housing/images/pricetorent_lg.jpg

House Price-to-Income vs. House Price-to-Rent Ratio, OECD Countries

IMFJuly7

Foreign Property Buyers Still Active – NAB

The NAB Residential Property Q2 Report shows that the index is weighed down by slowing rents. Eastern states out-performing, with NSW and Victoria expected to lead price and rental growth over the next 1-2 years. Foreign buyers less active in new property markets, but despite tougher restrictions on foreign investment, increase their presence in established markets, especially in Victoria. For the first time the Survey also distinguishes between foreign buyers in apartment and housing markets.

The NAB Residential Property Index fell -4 to +17 points in the June quarter as a slowdown in rents offset continued capital growth.

But, the picture remains mixed across the country.

NAB Group Chief Economist Alan Oster said: “Overall sentiment improved in Victoria and remained solid in NSW, but fell in all other states and quite heavily in SA and WA, with both states printing their weakest index result since the survey began”.

Looking forward, property professionals in NSW are now the most optimistic in the country (replacing QLD), closely followed by Victoria. In contrast, WA is the most pessimistic in the country and more so than in the last survey.

Expectations for national house price growth over the next 1-2 years were unchanged at 2.1% and 2.3%, but improved outlooks for capital growth in NSW and Victoria are offsetting weaker expectations in all other states.

“The survey also suggests that faster capital growth will push yields lower as rental growth continues to slow over the next 1-2 years” said Mr Oster.

Foreign buyers pulled back a little in new property markets in Q2, with their share of total demand falling to 12.8% (15.6% in Q1), with buyers less active in Victoria (18.1%) and NSW (13.1%).

In existing housing markets, however, foreign buyers were more active with their share of national demand rising to 8.6% (7.5% in Q1), with foreign buyers accounting for more than 1 in 10 sales in both Victoria and NSW.

For the first time the Survey distinguishes between foreign buyers in Australian apartment and housing markets.

In the new property market, property professionals estimated that foreign buyers accounted for 16.1% of all apartment sales and 11.5% of house sales in Q2.

“There were however, some big differences between the states, especially in the apartment market where foreigners purchased more than 28% of all new apartments in Victoria, compared to just 16.5% in NSW. There was much less divergence in new housing markets” said Mr Oster.

Despite stricter restrictions on foreign investment in the established residential property market, the survey suggests foreign buyers also play a fairly significant role in this segment of the Australian housing market.

Foreign buyers accounted for 11.4% of all established apartment sales and 9.4% of house sales in Q2.

According to Mr Oster: “It was however notable that foreign buyers had a much bigger presence in the established housing market in Victoria, with a market share of just over 16%. This was much higher than in all other states. Interestingly, the Survey also reported a much higher share of foreigners buying dwellings or land (23%) for re-development in Victoria”.

In terms of local buyers, first home buyers were more prevalent in new property markets in the June quarter (accounting for more than 1 in 4 property sales) although this increase was mostly due to first home buyer investors.

Owner occupiers or up-graders were also more active in both new and established markets, while resident investors (net of FHBs) accounted for just over 1 in 5 sales in both new and established markets.

NAB Economics is forecasting average national house price growth of 6.1% through the year to end-2015, although wide variance in capital city performance will persist. Capital growth is expected to be led mainly by Sydney (10.2%) and Melbourne (6.5%), with modest gains also forecast for Brisbane (4%) and Adelaide (0.9%). In Perth, house prices are expected to fall -3.8%.

Average national house price growth is expected to moderate in 2016 to 3%. NAB Economics expects prices growth to accelerate in Brisbane (4.8%), remain steady in Adelaide (0.9%) and fall in Perth (-0.1%). In contrast, house price growth is forecast to slow in both Sydney (3.9%) and Melbourne (3.1%).

RBA Says Negative Gearing Should Be Reviewed

In the RBA’s submission to the Inquiry on Home Ownership, they argue that negative gearing for investment property should be reviewed, because it has the potential to raise risks in the market, lift prices and distort the market.

Housing, particularly owner-­‐occupied housing, receives preferential taxation treatment in many countries, and Australia is no exception. Australia’s taxation system is also relatively generous to small investors in buy-­‐to-­‐let property compared with some other countries, because investors can deduct losses from their investments against wage income as well as other property income, and because capital gains are taxed at concessional rates. However, there are some other countries where the tax preference for investor property is even stronger than in Australia.

Geared investment increases with age and income, though we should be cautious, as the ATO data is of course income for tax purposes, post offsets.

RBA-ATO-DataThe Bank believes that there is a case for reviewing negative gearing, but not in isolation. Its interaction with other aspects of the tax system should be taken into account. The ability to deduct legitimate expenses incurred in the course of earning income is an important principle in Australia’s taxation system, and interest payments are no exception to this. To the extent that negative gearing induces landlords to accept a lower rental yield than otherwise (at least while continued capital gains are expected), it may be helpful for housing affordability for tenants. It is worth noting, however, that the interaction of negative gearing with other parts of the taxation system may have the effect of encouraging leveraged investment in property.

Interesting given the UK budget announcement last week to reduce negative gearing there, for the same reasons. So, is economic logic and political positioning pulling in two different directions?  The evidence that removal of negative gearing would drive rents up is shaky at best, and the weight of argument is definitely for reform.

You can hear my thoughts on ABC Radio National’s AM Programme this morning.


LTV and DTI Limits—Going Granular

DFA analysis of Australian mortgages highlight that we have high LTI ratios, and high LVR ratios, both indicating a build up of systemic risks in the system. We used postcode level analysis, and believe that it is essential to “get granular”.

Now the IMF has released a working paper on the effectiveness of using loan-to-value (LTV) and debt-service-to-income (DTI) limits as many countries face a new round of rising house prices. Yet, very little is known on how these regulatory instruments work in practice. This paper contributes to fill this gap by looking closely at their use and effectiveness in six economies—Brazil, Hong Kong SAR, Korea, Malaysia, Poland, and Romania.

IMF-LTI-LVRIn most cases,the caps on LTV and DTI started in the range of 60–85 percent and 30–45 percent, respectively, for mortgage loans. In all countries, there were changes to the limits of LTV/DTIs typically because the authorities noted that they were not having the desired effect. In some cases, house price and mortgage growth did not fall, and in other cases, the limits did not bind. Concerned with speculative activities, authorities in some countries lowered the caps selectively either for speculative prone (geographical) areas or for individuals with multiple mortgages. In one case, the centrally set caps were removed and banks were allowed to set their own limits, validated by supervisors. However, this did not work, and stricter requirements were put back in place.

To curb leakages, the limits were extended in some of the countries to insurance companies, mutual funds and finance companies that advertised mortgage products. It was also extended to development financial institutions.

Insights include: rapid growth in high-LTV loans with long maturities or in the number of borrowers with multiple mortgages can be signs of build up in systemic risk; monitoring nonperforming loans by loan characteristics can help in calibrating changes in the LTV and DTI limits; as leakages are almost inevitable, countries strive to address them at an early stage; and, in most cases, LTVs and DTIs were effective in reducing loan-growth and improving debt-servicing performances of borrowers, but not always in curbing house price growth.

Note: The views expressed in this Working Paper are those of the author(s) and do not necessarily represent those of the IMF or IMF policy. Working Papers describe research in progress by the author(s) and are published to elicit comments and to further debate.