Australian Housing Unaffordable – Demographia

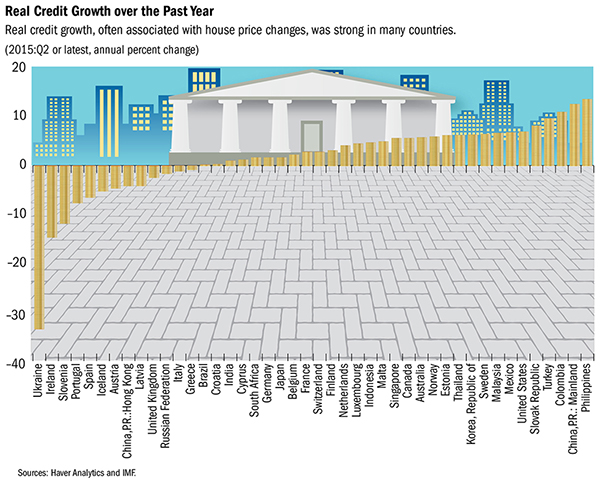
The 2016 Demographia survey (the 12th edition)  is out using data from Q3 2015. Once again Australians are shown to be exposed to highly unafforable housing, with all the downstream economic consequences which follow. Policy, regulation, and vision have all failed us. Whilst inflated prices bloat banks’ balance sheets thanks to massive lending for housing, the economic outcomes are disastrous. The resulting stagnation or even decline in household discretionary incomes is at least as much a threat to prosperity and job creation as the limited gross income gains.

” Australia had 33 severely unaffordable markets, followed by the United States with 29 and the United Kingdom with 17. New Zealand and Canada each had six severely unaffordable markets, while China’s one market (Hong Kong) was also severely unaffordable.”

Demographia-2016The survey covers 367 metropolitan markets in nine countries (Australia, Canada, China, Ireland, Japan, New Zealand, Singapore, the United Kingdom and the United States). A total of 87 major metropolitan markets — with more than 1,000,000 population — are included, including five megacities (Tokyo-Yokohama, New York, Osaka-Kobe-Kyoto, Los Angeles, and London).

The Demographia International Housing Affordability Survey rates middle-income housing affordability using the  Median Multiple.” The Median Multiple is widely used for evaluating urban markets, and has been recommended by the World Bank and the United Nations and is used by the Joint Center for Housing Studies, Harvard University. The Median Multiple and other similar price-to-income multiples (housing affordability multiples) are used to compare housing affordability between markets by the Organization for Economic Cooperation and Development, the International Monetary Fund, The Economist, and other organizations.

Demographia uses the following housing affordability ratings:

  • Severely Unaffordable 5.1 & Over
  • Seriously Unaffordable 4.1 to 5.0
  • Moderately Unaffordable 3.1 to 4.0
  • Affordable 3.0 & Under

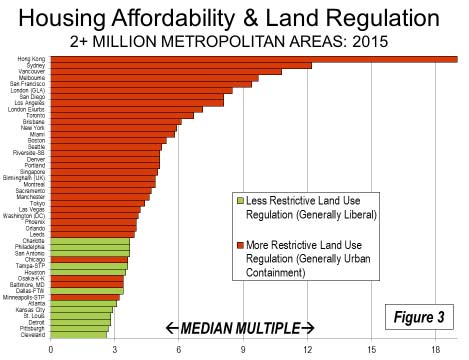
Hong Kong’s Median Multiple of 19.0 was the highest recorded (least affordable) in the 12 years of the Demographia International Housing Affordability Survey. Sydney was the second least affordable major market, with a Median Multiple of 12.2. Sydney’s increase of 2.4 points from its 9.8 Median Multiple in 2014 is the largest year-to-year deterioration ever indicated in the 12 years of the Demographia International Housing Affordability Survey. It is also highest Median Multiple outside Hong Kong in the history of the Survey, exceeding the extremes experienced on the US West Coast during the housing bubble of the last decade. Vancouver was the third least affordable major market, with a Median Multiple of 10.8. Auckland, Melbourne and San Jose all had Median Multiples of 9.7. They were followed by San Francisco at 9.4, and London (Greater London Authority), at 8.5. Two other markets had Median Multiples of 8.0 or above, including San Diego and Los Angeles, both at 8.1.

Virtually all governments consider household economic issues as a top priority, especially increasing the standard of living and reducing or eradicating poverty. Yet economic growth has been laggard, and discretionary income trends are even more concerning. Housing costs, which represent the largest household expenditure category, have been rising much faster than incomes. The resulting stagnation or even decline in household discretionary incomes is at least as much a threat to prosperity and job creation as the limited gross income gains.

The largest losses in housing affordability have been associated with urban containment policy. Severely unaffordable housing (Median Multiple of 5.1 or higher) has occurred only in major metropolitan areas that have strong land use policy, especially urban containment boundaries and variations thereof. Corrective measures that could halt or reverse losses in housing affordability from urban containment policy have either been absent or not been implemented. As a result, urban containment policy has been a profound policy failure, as house prices have doubled and tripled relative to incomes in many metropolitan areas.

In the introduction, Senator Bob Day says:

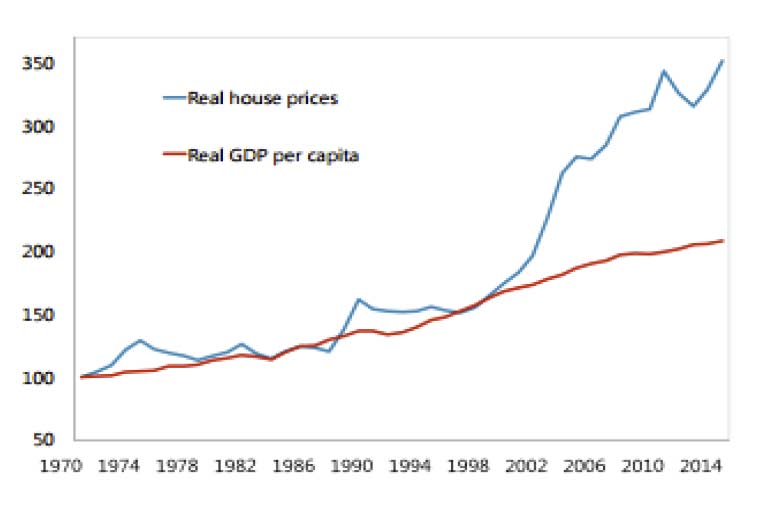
For more than 100 years the average Australian family was able to buy its first home on one wage. The median house price was around three times the median income allowing young home buyers easy entry into the housing market As can be seen from the graph below (“ Real Home Price Index”), the median house price has increased, in real terms, by more than 300% – from an average index of 100 between 1900 and 2000 to an index over 300 by the year 2008.

Relative to incomes, house prices have increased from three times median income to more than nine times income. That’s $600,000 they are not able to spend on other things – clothes, cars, furniture, appliances, travel, movies, restaurants, the theatre, children’s education, charities and many other discretionary purchase options.

It is a similar story in the UK, US, Canada, New Zealand, Ireland and Japan.

The economic consequences of this change have been devastating. The capital structure of these countries’ economies have been distorted to the tune of hundreds of billions of dollars and for those on middle and low incomes the prospect of ever becoming homeowners has now all but vanished. Housing starts are below what they should be and so have all the jobs associated with them – civil construction, house construction, transport, appliances, soft furnishings, you name it. Not to mention billions of dollars in lost taxes and other housing-related revenue to the nation state.

The distortion in the housing market, this misallocation of resources resulting from the supply-demand imbalance is enormous by any measure and affects every other area of a country’s economy. New home owners pay a much higher percentage of their income on house payments than they should. Similarly, renters are paying increased rental costs reflective of the higher capital and financing costs in turn paid by landlords.

Economies have been distorted and getting them back into alignment is going to take some time. But it is a realignment that is necessary. A terrible mistake was made and it needs to be corrected.

Capital gains stall in the final month of the year

According to the CoreLogic RP Data Home Value Index, dwelling values were absolutely flat across the combined capitals during December, with negative movements in Sydney, Adelaide and Canberra being offset by a rise in dwelling values across the remaining five capital cities. The Sydney housing market was the main drag on the December results, with dwelling values down 1.2%, while values were down 1.5% in Adelaide and 1.1% in Canberra. The remaining capitals saw a rise in dwelling values, led by a 2.3% bounce in Perth values and a 1.0% rise in Melbourne values over the month.

Index results as at December 31, 2015

2016-01-04--Dec_Index

After dwelling values had been broadly rising since June 2012, the December quarter results revealed a 1.4% fall in dwelling values across the combined capitals, the largest quarter on quarter fall since December 2011. Six of the eight capital cities recorded a negative result over the December quarter, with weaker conditions in Sydney and Melbourne acting as the greatest drag on capital city performance, according to CoreLogic RP Data head of research Tim Lawless.

The largest quarterly fall was recorded in Sydney, where dwelling values were down 2.3% over the final three months of the year, followed by Melbourne, where dwelling values were 1.9% lower. The only capital cities to show a rise in dwelling values over the December quarter were Brisbane (+1.3%) and Adelaide (+0.6%).

This was in contrast to the first three quarters of 2015, where capital city dwelling values rose by 9.3%, largely driven by a 14.1% surge in Sydney values and a 13.3% increase in Melbourne.  In stark contrast, the final quarter of 2015 showed Sydney as the weakest performer of any capital city, with dwelling values down by -2.3% while Melbourne recorded the second weakest result of -1.9%.

The complete 2015 calendar year results reveal a 7.8% increase in capital city dwelling values which is the lowest rate of capital gain over a calendar year since 2012 when values slipped 0.4% lower over the full year. Highlighting the diversity in the capital city housing markets, dwelling values fell across four of the eight capitals in the 2015 calendar year. The largest of these falls were recorded in Perth, down by 3.7%, and Darwin down by 3.6%. Hobart and Adelaide also showed subtle falls of 0.7% and 0.1%.

Despite the recent weakening of housing market conditions in Sydney and Melbourne, the two largest capital city housing markets still recorded much stronger annual gains than all other capital cities,  11.5% in Sydney and 11.2% in Melbourne. Dwelling values in Brisbane and Canberra were up a more sustainable 4.1% over the year.

Mr Lawless said, “The wealth created from housing in Sydney and Melbourne has been exceptional over the past twelve months.”

“In dollar terms, Sydney home owners have seen approximately $82,000 added to their wealth thanks to the strong capital gains over the year while home owners in Melbourne have seen the value of their dwelling grow by approximately $60,400. Brisbane home owners are $18,560 better off while Canberra owners have seen the value of their homes increase by approximately $21,900.”

“Home owners in the remaining capital cities have seen some erosion of their wealth via falls in the value of their dwelling. The largest losses have occurred in Perth where the average dwelling is now worth approximately $19,970 less than it was 12 months ago, while Darwin home owners have seen the value of their home shrink by a similar $18,150. The annual decline has been milder in Adelaide and Hobart, however dwelling values are still $515 lower in Adelaide over the year and down $2,430 in Hobart.”

“The slowdown in housing market conditions across Sydney and Melbourne in the last half of 2015 is being driven by a range of factors that can best be described as both organic and externally influenced. Organic market conditions have been derived from affordability pressures, rental yield compression and cyclical factors, while factors from external influences largely stem from a change in the regulatory framework introduced by APRA which has made it more expensive and difficult for investors to access housing finance. Added to this is higher mortgage rates and more restrictive credit policies and loan servicing requirements.”

Housing Price and Household Debt Interactions

A newly published IMF working paper looks at the relationship between house prices and household debt, in Sweden. The work is interesting because house prices have risen significantly, and household debt has risen substantially at a time when supply was limited. Australia is not the only country with these synonyms!

Sweden1The swings in house price growth have had wider amplitude than those of credit growth since the GFC. Whilst a loan-to-value ratio cap of 85 percent on all new mortgage loans was introduced in 2010 which may have affected lending growth, they still have tax relief on mortgage repayments.

Sweden-2The question the paper examines is the relationship between these higher prices and household debt levels. A common interpretation of the link between these markets is that mortgage lending drives housing prices up, motivating measures to curb credit. Yet, mortgage lending can also be driven by rising housing prices through the wealth
and collateral channels. Home ownership generally requires debt financing, especially as households usually acquire this major asset early in their life cycle. When house prices appreciate, households who own housing may perceive that their higher wealth allows for greater lifetime consumption, inducing households to borrow and spend more. At the same time, the higher value of housing assets expands the value of collateral against which borrowing is generally much cheaper than unsecured credit. Relaxing this collateral constraint thereby expands households’ borrowing capacity, which could be reflected in a combination of higher consumption and larger asset holdings. For households that do not yet own a house, higher prices increase the need to borrow but also relax collateral constraints.

The paper examines the interactions between housing prices and household debt using a three-equation model, finding that household borrowing impacts housing prices in the short-run, but the price of housing is the main driver of the secular trend in household debt over the long-run. Both housing prices and household debt are estimated to be moderately above their long-run equilibrium levels, but the adjustment toward equilibrium is not found to be rapid. Whereas low interest rates have contributed to the recent surge in housing prices, growth in incomes and financial assets play a larger role. Policy experiments suggest that a gradual phasing out of mortgage interest deductibility is likely to have a manageable effect on housing prices and household debt.

Note that IMF Working Papers describe research in progress by the author(s) and are published to elicit comments and to encourage debate. The views expressed in IMF Working Papers are those of the author(s) and do not necessarily represent the views of the IMF, its Executive Board, or IMF management.

Was the housing boom in Sydney and Melbourne driven by foreign buyers?

From The Conversation.

House prices rose by an average of 64% in Sydney and Melbourne in the decade from 2004 to 2014. At the same time foreign investment proposals in developed real estate rose by almost tenfold. This correlation led to a lot of anecdotal stories of Chinese buyers driving up prices and to a Parliamentary Inquiry.

How much can we attribute the decade-long housing boom in Sydney and Melbourne to foreign buyers? The numbers are hard to find and a little rubbery, but our best econometric estimate is that about one quarter of the growth in house prices in Sydney and Melbourne can be attributed to foreign investment.

This means that if foreign investment had been steady over the period, average house prices would have grown by about 50% compared with the actual growth of 67%. In the other capital cities, by the way, the growth in house prices was much less and it was not possible to find any econometrically significant effect of foreign buyers.

This amounts to a modest effect of foreign investment on house prices in Sydney and Melbourne. The hype about Chinese buyers driving up house prices appears to be overstated – at least in terms of the effect on average house prices – there may have been more significant effects in certain locations.

The quality of data however is a failure of public administration. The Parliamentary Inquiry essentially came to this conclusion. It found that there is no accurate data on foreign investment in Australian real estate and therefore “no-one really knows how much foreign investment there is in residential real estate”.

The Inquiry also noted there had been no court action by the Foreign Investment Review Board (IRB) since 2006 in relation to foreign real estate investment. The Australian Taxation Office has however moved since then to force the sale of a property bought by a foreign buyer without government approval.

The law prevents foreign citizens from purchasing established housing for their own homes or as investment properties, except for one or two narrow exemptions. Clearly there has been inadequate monitoring of purchases to enable this law to be enforced. However if the concern is about house prices and the effect on affordability, then the role of foreign purchases is not at all clear.

If foreigners buy a house to rent out to someone who is already in the housing market such as a non-citizen student in Australia, there is no net increase in the demand for housing and therefore no pressure on house prices. Nor is there any net impact on housing demand and therefore on prices if foreign buyers eventually become foreign sellers. And again, if foreign buyers eventually become permanent residents their purchases represent a shifting forward of housing demand rather than a long run increase in housing demand.

All of which is to say that simply looking at foreign purchases of real estate does not give us a very accurate guide as to the net impact on house prices.

Then there is the tenuous link from house prices to housing affordability. First home buyers generally purchase the cheaper dwellings and established rather than new dwellings, both of which are housing categories where foreign investment is less evident. In any case, other work by the Reserve Bank of Australia finds that house price growth over the past 30 years can be largely explained by fundamental factors such as financial deregulation, the ability of housing supply to respond to demand, and population growth driven by immigration. This suggests that foreign direct investment may have played relatively minor role in explaining house price growth.

If the public policy concern is more about housing affordability, then policies that aim to boost housing supply and that address tax and retirement income policies favouring housing over other asset classes would be more effective than a clamp-down on foreign real estate investment.

Some people seem to worry not so much about housing affordability but about foreigners gaining control over Australian real estate assets. This is hard to fathom because when foreigners buy an asset in Australia, whether it is a real asset like property or a financial asset like shares or bonds, there is no transfer of wealth to foreigners. Indeed quite the reverse – if foreigners are willing to pay more for our assets than any Australian citizen, this cannot be a loss of wealth to Australia.

Despite all of these qualifications and complications, we need to know more about foreign purchases of residential real estate. The Parliamentary Inquiry’s recommendation seems sensible: to establish a national register of land title transfers that records the citizenship and residency status of all purchases of Australian real estate.


uthors: Ross Guest, Professor of Economics and National Senior Teaching Fellow, Griffith University,  Nicholas Rohde, Lecturer in Economics, Griffith University.


Increasing loan size brings housing affordability down

The latest edition of the Adelaide Bank/ REIA Housing Affordability Report shows that overall housing affordability in Australia declined over the September quarter with homes becoming less affordable in five out of the eight states and territories.

The report provides a comprehensive update for the sector using the latest data for the September Quarter 2015.

REIA President Neville Sanders says, “The latest REIA Housing Affordability Report shows that the proportion of median family income required to meet average loan repayments was 31.7%. The figure increased 1.4 percentage points during the quarter and 1.3 percentage points compared to a year ago largely due to the increasing size of new loans.”

“Sadly, the deterioration was seen in most states and territories and the overall level of housing affordability now is at its worst level since March 2013. Western Australia and the Australian Capital Territory were the only jurisdictions to record improvements while the proportion of the median family income required to meet average loan repayments remained unchanged in the Northern Territory.”

“Already the least affordable, New South Wales recorded the biggest fall in housing affordability across the country. New South Wales is still the only state or territory with an average loan size above $400,000, however Victoria follows closely at $390,503.”

“The report shows overall rental affordability improved over the quarter with 24.6% of the median family income now required to pay median rents. The proportion of the median family income required to meet median rents was sitting at 23.4% in Queensland, 23.2% in South Australia and 24.1% in Tasmania.”

IMF Updates Global and National Housing Outlook, Australian Property Overvalued

In the latest release, the IMF have provided data to October 2015, and also some specific analysis of the Australian housing market. We think they are overoptimistic about the local scene, and we explain why.

But first, according to the IMF, globally, house prices continue a slow recovery. The Global House Price Index, an equally weighted average of real house prices in nearly 60 countries, inched up slowly during the past two years but has not yet returned to pre-crisis levels.

chart1_As noted in previous quarterly reports, the overall index conceals divergent patterns: over the past year, house prices rose in two-thirds of the countries included in the index and fell in the other one-third.

house prices around the world_071814Credit growth has been strong in many countries. As noted in July’s quarterly report, house prices and credit growth have gone hand-in-hand over the past five years. However, credit growth is not the only predictor for the extent of house price growth; several other factors appear to be at play.

house prices around the world_071814For OECD countries, house prices have grown faster than incomes and rents in almost half of the countries.

chart2_House price-to income and house price-to-rent ratios are highly correlated, as documented in the previous quarterly report.

chart2_ Turning to the Australia specific analysis, Adil Mohommad, Dan Nyberg, and Alex Pitt (all at the IMF) argue that house prices are moderately stronger than consistent with current economic fundamentals, but less than a comparison to historical or international averages would suggest. Here is just a summary of their arguments, the full report is available.

Argument: House prices have risen faster in Australia than in most other countries, suggesting, ceteris paribus, overvaluation.

OZ-House-Prices-to-GDPCounter argument 1: House prices are in line on an absolute basis – Price-to-income ratios have risen in Australia and now near historic highs. However, international comparisons suggest that Australia is broadly in line with comparator countries, although significant data comparability issues make inference difficult.
Counter argument 2: The equilibrium level of house prices has also risen sharply – Lower nominal and real interest rates and financial liberalization are key contributors to the strong increases in house prices over the past two decades. The various house price modeling approaches indicate that house prices are moderately stronger (in the range of 4-19 percent) than economic fundamentals would suggest.
Counter argument 3: High prices reflect low supply – Housing supply does indeed seem to have grown significantly slower than demand, reducing (but not eliminating) concerns about overvaluation.
Counter argument 4: It is just a Sydney problem, not a national one – The two most populous cities, Sydney and Melbourne, have seen strong house price increases, including in the investor segment. A sharp downturn in the housing market in these cities could be expected to have real sector spillovers, pointing to the need for targeted measures—including investor lending—to reduce risks from a housing downturn.
Counter argument 5: There are no signs of weakening lending standards or speculation – While lending standards overall seem not to have loosened, the growing share of investor and interest-only loans in the highly-buoyant Sydney market, is a pocket of concern.
Counter argument 6: Even if they are overvalued, it doesn’t matter as banks can withstand a big fall – While bank capital levels are likely sufficient to keep them solvent in the event of a major fall in house prices, they are not enough to prevent banks making an already extremely difficult macroeconomic situation worse.

Let us think about each in turn.

Thus, DFA concludes the IMF initial statement is correct, and despite their detailed analysis, their counterarguments are not convincing. We do have a problem.

Home values fall in Sydney and Melbourne as housing market moves through peak of cycle – CoreLogic RP Data

The CoreLogic November Home Value Index out today confirmed dwelling values fell across five of the eight capital cities in Australia over the month, taking the combined capitals index 1.5% lower.

According to CoreLogic RP Data head of research Tim Lawless, slower housing market conditions for Sydney and Melbourne became evident earlier in the year and continued throughout November. Over the month, Melbourne values fell by 3.5 per cent, while Sydney values were down 1.4 per cent.  Hobart dwelling values dropped by 2.4 per cent, Darwin values were down 1.3 per cent and dwelling values moved 0.5 per cent lower in Canberra.   Overall the combined capitals housing index has seen dwelling values drop by 1.5 per cent over November, taking the rolling quarterly rate of change to -0.5 per cent.

Values rose in the remaining three capital cities, with Adelaide showing the highest month-on-month growth rate (0.7 per cent), followed by Brisbane (0.6 per cent) and Perth (0.3 per cent).

Mr Lawless said, “The latest results are now placing downwards pressure on the annual change in dwelling values. The annual rate of growth across the combined capitals index peaked at 11.5 per cent back in April 2014, and has since reduced to 8.7 per cent.”

Sydney maintained the highest annual growth rate at 12.8 per cent, which is down from a peak rate of annual growth of 18.4 per cent in July earlier this year, while Melbourne’s annual growth rate has reduced from a recent peak of 14.2 per cent to 11.8 per cent over the 12 months ending November this year.

The only capital cities where values have declined over the past year are Darwin (-4.2 per cent) and Perth (-4.1 per cent), where weaker economic conditions and a slowdown in population growth contributed to an early peak in housing market conditions in December last year.  The equivalent peak in the cycle for Darwin was May 2014.   Since that time, Perth values are down a cumulative 5.9 per cent and Darwin values have fallen by a larger 6.8 per cent.

Index results as at November 30, 2015

2015-12--indices

“The fact that mortgage rates have risen independently of the cash rate has, in all likelihood,  become a contributor to the slowdown in housing market conditions, as well as tighter lending practices evidenced by a recent reduction in  lender risk appetite for investment loans and high loan to valuation ratio mortgages. Tighter mortgage servicing criteria across the board and affordability constraints in the Sydney and Melbourne markets are also having an impact on market demand.”  Mr Lawless said.

As a consequence of the tighter lending environment for investors, as well as gross rental yields being at near record lows, participation in the housing market from investors has reduced from 54.1 per cent of all new mortgages in May 2015 to 45.4 per cent at the end of September, which is the lowest level since July 2013.   Data released by APRA at the end of last month showed the pace of investment related housing credit growth fell below the APRA 10 per cent speed limit for the first time since September last year, with the monthly change in investment credit growth the lowest since October 2011.

According to today’s results, the slowdown comes after auction clearance rates have moderated back to the low 60 per cent range since the last week of October, whilst average selling time and vendor discounting rates also continue to rise from their record lows.

The 1.5 per cent decline in capital city dwelling values over the month, coupled with a 0.3 per cent rise in weekly rents, has seen the average gross yield record a subtle improvement over the month.  This follows a trend towards lower rental yields which commenced in May 2013.  Gross yields remain close to record lows for houses in Melbourne at an average of 3.0 per cent, while Sydney has overtaken Melbourne to show the lowest yield profile across the capital city unit markets, with an average gross rental yield of 4.1 per cent.

Mr Lawless said, “Slower housing market conditions will likely be a topic of conversation when the Reserve Bank board meets today to deliberate on the cash rate setting.  A less buoyant housing market is likely to provide the Reserve Bank with a greater degree of flexibility in adjusting interest rates without as much risk of overstimulating the housing market.”

“While the Reserve Bank is likely to welcome a slowdown in the rate of home value appreciation, the overriding objective would be to avoid a significant downturn in the housing market, which would act as a weight on economic growth and potentially impact financial system stability.”

“With the housing market moving through the peak of the cycle at a time when there is a large number of new dwellings commencing construction, there is likely to be a heightened level of settlement risk for off the plan purchases.”

“Those purchasers who have recently purchased off-the-plan may face challenges at the time of settlement if the valuation of the property is lower than the contracted price, or if mortgage finance is less freely available, or on more expensive terms.  This would imply that some buyers may have a higher loan to valuation ratio than anticipated, which could require additional funds to bring the LVR down to a level the lender is comfortable with.”

“As a result of slowing housing market conditions, an additional risk for policymakers is where a large number of dwellings approved for construction are postponed or withdrawn as developers face fewer presales or lose confidence in their ability to deliver a profitable project to market,” Mr Lawless said.

A land value tax could fix Australasia’s housing crisis

From The Conversation.

The major cities of Australia and New Zealand are experiencing an extraordinary wave of speculation in their respective real estate markets. Over the past three years, the median house price to median income ratio has increased by 21.2% in Australia and 18.1% in New Zealand, a rate reminiscent of Ireland’s 20.5% before its housing crash at the time of the global financial crisis.

The rapid increase in property unaffordability on both sides of the Tasman has enriched a number of homeowners and speculators and made countless more eager to join the game. But it has had dramatic effects for businesses and landless families who find it exceedingly difficult to afford a place to live, work or operate.

Unsurprisingly, a lot of column space and political deliberation have been dedicated to finding a solution to the problem. Much of the analysis points to a lack of housing supply at a time of increasing demand as being the main driver of rising prices, resulting in a simple policy prescription: increase the supply of housing.

The main problem with this argument is it ignores the fact that it is land, not physical structures, that appreciates in value, making it an obvious area for speculation. Unlike houses or genuine capital, land does not depreciate or require maintenance. Instead, the value of land reflects its economic potential due to public expenditures on infrastructure (such as roads, schools or railway stations) in its vicinity and the effort and entrepreneurship of local workers and entrepreneurs.

When land prices soar, residential real estate becomes a more attractive investment opportunity than productive businesses. Land bubbles tend to produce two seemingly contradictory effects. Firstly, it produces urban sprawl as businesses and families are forced to seek cheaper land outside of the urban centres. Secondly, as owners are more interested in expected capital gains than any productive activities, much valuable land become idle.

Eventually, the burden of debt, lack of affordable land and investments based on wrong signals (e.g. luxurious condominiums promising high-profit margins) start affecting the real economy. As workers lose their jobs, they become unable to repay their debts and are forced to sell. Land prices finally stagnate and then fall, taking leveraged banks, speculators and people’s life savings with them. It is, therefore, clear that to escape this never-ending cycle, we need to focus on land.

Over a century ago, American economist Henry George suggested instead of taxing workers and entrepreneurs, governments should raise their revenue from land via a land value tax (LVT).

Indeed, both Australia (land taxes at the state level) and New Zealand (property rates at the council level) already have some taxation of land in place. But over the last century these taxes have become significantly debased due to the influence of various interest groups that secured exemptions or low rates. It is time to reconsider shifting the fiscal balance back onto land.

Unlike the land taxes already in place or the often suggested capital gains tax, LVT does not punish anyone for constructing houses or factories in the way that our current taxes do. As the supply of land is fixed, LVT becomes a cost of owning it. Consequently, it can bring in a decrease in prices as the owners of inefficiently used sites might feel compelled to sell or lease them to those willing to use them productively. Increasing the cost of owning land would drastically reduce the incentives for speculation.

Imagine central Auckland or Melbourne without vacant sites or dilapidated buildings. What is more, encouraging more efficient use of land is not only beneficial to economic growth and housing affordability, but also has a potential to substantially lower the costs of public infrastructure and encourage more efficient use of space and natural resources.

LVT would be a transparent and efficient alternative to our current taxes which are not only burdensome on businesses and families but also difficult and expensive to administer and enforce. It is impossible to hide land in a tax haven or a trust (trusts are not exempt from the current land taxes). Taxing it can be done cheaply and on the basis of publicly available information.

While LVT might persuade some modest-income earners to sell their valuable properties, most workers and homeowners would get net benefits from a reduction in taxes falling on their income (income taxes) and consumption (GST). Furthermore, a citizen’s dividend could be introduced in which part of the revenue raised from LVT is directly paid out to all citizens on a per-capita basis.

Given the multiple problems stemming from the rapidly expanding housing bubbles in Australia and New Zealand, introducing a tax on unimproved land values makes sense. Not only would it undoubtedly address house price inflation, it could also result in a more efficient use of land, mitigate urban sprawl, lower the burden on the natural environment and reduce the risk of real estate bubbles; all this without undermining the foundations of economic growth.


Author: Nicholas Ross Smith, Professional Teaching Fellow, University of Auckland;  Zbigniew Dumieńsk, Lecturer, University of Auckland.


A Deeper Look at Recent Auckland Housing Market Trends: RBNZ

The Reserve Bank of New Zealand has published an analytic note “A Deeper Look at At Recent Housing Market Trends; Insights from Unit Record Data. It highlights the influence of investors and their impact on the overall market and the impact of LVR controls.

In October 2013 the Reserve Bank placed a temporary ‘speed limit’ on high loan-to-value ratio (LVR) residential mortgage lending, restricting banks’ new lending at LVRs over 80 percent to no more than 10 percent of total residential mortgage lending. This policy was implemented to reduce financial stability risks associated with the housing market, against the backdrop of elevated household debt, high and rapidly rising house prices, and a large share of new lending going to borrowers with low deposits. The policy had an immediate dampening effect on housing market activity and house price inflation, and facilitated a strengthening in bank balance sheets. However, since late 2014, upward pressure on the housing market has re-emerged, predominantly in Auckland, posing renewed risks to financial stability.

With the housing market showing renewed signs of strength, this paper provides a detailed overview of market conditions and examines developments following the imposition of the speed limit on high-LVR lending. We find that increased housing market activity in recent months has been driven by strong investor demand, both within and outside of Auckland, as reflected in increased investor purchases and significant growth in investor-related mortgage credit. Much of the increase in investor purchase shares has coincided with a fall in the share of movers, with the first home buyer share increasing slightly following its decline after the introduction of LVR speed limits.

We also investigate whether the LVR policy has led to an increase in cash buying activity or borrowing from institutions outside of the regulatory. We do not find evidence of the former with cash buyer shares falling in Auckland and remaining broadly flat in the rest of the country. There is some evidence of a modest increase in the share of transactions involving non-banks since October 2013, although non-bank activity remains low.

We then undertake a more detailed analysis of investor activity given their heightened prevalence in the market. The primary driver of their increased market share has been a rising incidence of small investors (that are heavily reliant on credit) in the market, as opposed to greater activity among larger investors. This suggests that the incoming changes to the LVR restrictions could have a significant dampening effect on Auckland housing market activity and house price inflation. We also find that investors are disproportionately represented at both ends of the price spectrum, contrary to popular opinion that investors predominantly buy relatively cheap properties for use as rentals.

Finally, we offer some additional insights into cash buyers, with the evidence pointing towards increased investor leverage relative to other market participants, consistent with the strong growth in investor-related mortgage commitments in recent months.

Will Cameron’s 200,000 starter homes really help solve the housing crisis?

From The Conversation.

British prime minister, David Cameron, has pledged to turn “Generation Rent” into “Generation Buy”, by building 200,000 affordable starter homes for under-40s by 2020. The price of the starter homes will be capped at £250,000 (£450,000 within London), and buyers will not be able to sell the properties on for five years. While the prime minister’s announcement will help address the UK’s chronic housing shortage, it is also likely to have unintended consequences.

We really ought to be building 240,000 new homes each year in England alone, if we are to meet need. Currently, we are only building about half of that amount. In fact, it was as far back as 1978 when we were last building the numbers of new houses we need today.

Challenge accepted

Minister for Housing and Planning Brandon Lewis recently said that building 1m new homes in the life of this parliament would be a good achievement. But, welcome as those homes would be, they are still fewer than we need.

The real challenge is to rebuild the construction capacity that we lost after the credit crunch, when many small and medium sized builders went out of business and many skilled construction workers left the industry as house prices fell and small builders found it hard to raise finance. So building more homes will involve boosting the number of small- and medium-sized construction firms, as well as skilled labour – all of which will take time and money.

As though the challenge of building a million homes wasn’t enough, we also need to ensure these homes are spread across all tenures: we need homes for private and shared ownership, newly built and professionally managed private rental homes and affordable rental homes. The prime minister’s announcement of additional starter homes is a useful contribution to meeting the gap between what we need and what we are currently building.

But these homes are to be secured by relaxing planning obligations for developers. Herein lies the potential for unintended consequences.

Over the last two decades, planning obligations have proved to be a very useful way of securing funds for infrastructure – such as open public spaces, schools, roads and public transport – and new affordable homes, including shared ownership and affordable rental homes.

Local authorities can use planning laws to negotiate with developers to incorporate affordable homes into their projects, and contribute toward the local infrastructure needed to support the new residents they attract. Over the years, large sums have been secured for infrastructure and affordable homes. Developers obviously incur costs when making these provisions. They ensure they can afford these extra costs by paying less for the land they buy than they would have done, if they did not have to comply with these obligations.

Prices for land tend to rocket when planning consent is granted, and it has long been regarded as reasonable for some of this potential increase to be diverted to fund infrastructure and affordable homes. Crucially, planning obligations have enabled private funding to replace publicly funded grants to housing associations, while maintaining the output of new affordable rented homes.

What’s the catch?

Now, developers will be required to provide starter homes at a discount, instead of contributing to infrastructure and affordable rental homes. This trade-off could mean that new starter homes are built, but the supporting infrastructure isn’t. It could also prevent communities from securing the new affordable rental and shared ownership homes they need. This will be a critical loss, especially since the latter have proved an effective way of helping low-income earners to get a foot on the “housing ladder”.

And while financial institutions are keen to invest in newly built privately rented housing, the scale of this activity is still modest and will not be adequate to meet the gaps in rented housing provision in the immediate future.

Perhaps the government has yet to unveil plans to increase public funding for infrastructure and to provide additional grants to build new affordable rental homes. But this seems unlikely, given the cuts to public spending we’re expecting, as we await the outcomes of the public spending review.

What we need, in addition to the government’s aspiration to build 1m new homes by 2020, is clarity about all the resources to be provided. This will allow the house-building and construction industry to gear up with confidence, and aim to reach that target across all tenures. Starter homes will help – but they shouldn’t come at the cost of schools and affordable rental homes.

Author: Tony Crook CBE, Emeritus Professor of Town and Regional Planning, University of Sheffield