Preliminary Results Show 70.2% of Auctions Successful

From CoreLogic.

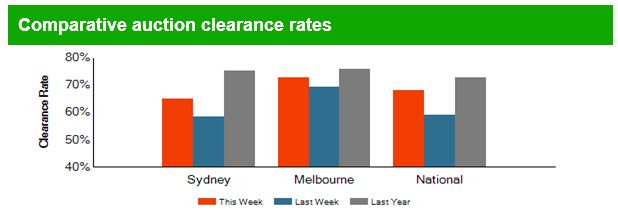
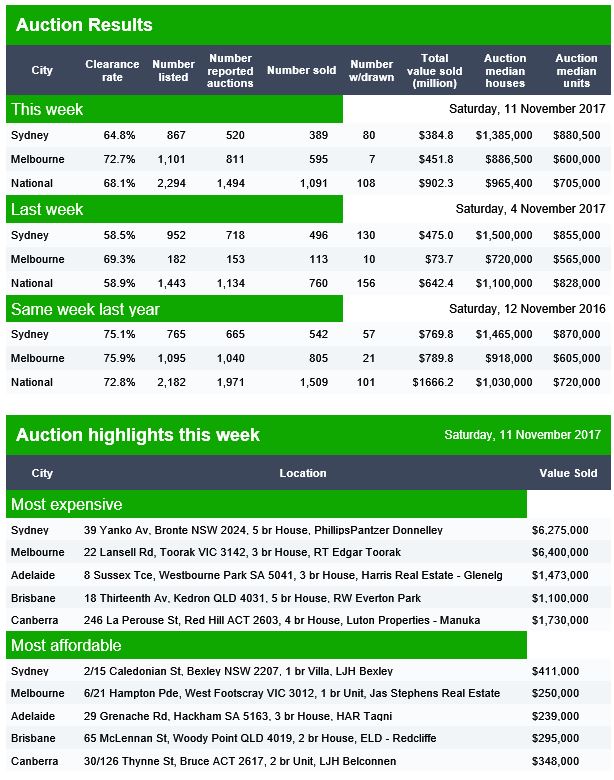
Preliminary figures show 70.2 per cent of auctions were successful across the combined capital cities, while auction activity increases week-on-week.

The combined capital city preliminary clearance rate increased to 70.2 per cent this week, after last week’s revised final clearance rate fell to 66.4 per cent, which was not only the lowest combined capital city clearance rate so far this year, down -0.1 per cent from the previous low seen over the week ending 25 June 2017 (66.5 per cent), but the lowest clearance rate since June 2016 across the combined capitals. It will be interesting to see what the final clearance rate looks like on Thursday once the remaining records have been captured. Auction volumes increased week-on-week with 2,225 properties taken to auction this week, up from 2,074 last week, and higher than this time last year (2,062).

2017-09-11--capitalcityauctionresults

Auction Results 09 Sep 2017

The preliminary auction results are in from Domain.  It looks like a higher listing count and perhaps a higher clearance rate. Further evidence the market is far from dead!

Brisbane though cleared just 47% of 94 scheduled auctions, Adelaide 73% of 56 scheduled auctions (lots of interest from interstate investors) and Canberra 71% of 57 scheduled auctions.

The Light In the Tunnel – The Property Imperative 09 Sep 2017

A bunch of new data came out this week, so we discuss the findings and explore what it means for households and their budgets.

Welcome to the Property Imperative weekly to 9th September 2017, the latest edition of our finance and property news digest.

We released the August edition of our Mortgage Stress research which showed that across the nation, more than 860,000 households are estimated to be now in mortgage stress (last month 820,000) with more than 20,000 of these in severe stress. This equates to 26.4% of households, up from 25.8% last month.

The main drivers of stress are rising mortgage rates and living costs whilst real incomes continue to fall and underemployment is on the rise.  This is a deadly combination and is touching households across the country, not just in the mortgage belts. In August higher power prices, council rates and childcare costs hit home. You can watch our video where we walk through the post codes most at risk.

The latest Adelaide Bank/REIA Housing Affordability Report showed that buying a house became even less affordable during the June quarter with the proportion of median family income required to meet average home loan repayments increasing by 0.2 percentage points to 31.4 per cent.

Research from Mozo.com.au showed that one third of first time buyers were reliant on help from the Bank of Mum and Dad, and the average value of that assistance in NSW was $88,250. This is pretty similar to our own findings on the rise and rise of the Bank of Mum and Dad.

Data from Roy Morgan highlighted the fact that more Australians are now under-employed than at this time last year. 1.24 million (9.5%) Australians are under-employed (which means looking for work or looking for more work), up a significant 324,000 (2.4%) in a year. They also called the “real” unemployment rate at 10.2%, as opposed to the official ABS data of 5.6%.

CoreLogic said that while auction clearance rates were pretty firm, the volume of sales continued to fall.  But there is no stopping the housing train. Demand for property is still strong, but the mix of purchasers is changing as shown by the housing finance from the ABS which came out on Friday.

Owner occupied purchases are steaming ahead, while investment lending is stagnating. A clear reflection of the tightening in investor lending regulation, and the availability of new incentives and grants for first time buyers, alongside the attractor loan rates for new borrowers. We saw first time buyers more active in NSW and VIC, two states where new concessions started in July. The proportion of first home buyer commitments rose to 16.6% in July from 14.9% in June.  Just remember back in 2009 they comprised more than 30% of total transactions, so all the hype about the return of first time buyers is over done in our view.

But in July, trend lending flows were $33 billion, up 0.1% overall, with owner occupied lending up $20.8 billion or 0.7%, and Investment lending down 1% to $12.1 billion.  The number of owner occupied transactions rose 0.6%, construction of dwellings rose 2%, new dwellings 2% and the purchase of established dwellings 0.3%. As a result, total bank home lending stock rose again to $1.61 trillion, another record.

There are some amazing attractor mortgage loan offers in the market right now, as lenders fight for market share. We see significant falls in some investment property loan offer rates, as well as discounts for new owner occupied borrowers, with rates down to as low as 3.65%. These rates of course are not available for existing borrowers, the oldest trick in the book, so this may explain a rise in refinanced transactions.

ASIC launched a series of videos to help consumers make “MoneySmart” decisions when buying a home. Some would say, better late than never! The recommendations on budgeting are especially pertinent.  However, a weakness of the MoneySmart calculators are they are static, we think they need a calculator to show the impact of changing interest rates for example. That said, their TrackMySpend App is a really useful tool to get to grips with what is being spent.

The point is that our research shows households are exposed to potential future interest rate rises, and whilst lenders are required to factor in expense and interest rate buffers, they are probably not sufficient to protect borrowers in a rising rate environment, and in any case, the majority of borrowers do not understand the financial impact of such rises, nor are they planning for them. We think lenders should have an obligation to display the recalculated monthly repayment at an average long term rate, which would be at least 3% above current levels. Households would be shocked to see the impact, and it may reduce the overreach which many are locked into at the moment.  It all depends on when rates rise.

Treasurer Scott Morrison said that interest rates are “obviously” going to rise in the future but that many home owners would be able to avoid mortgage stress thanks to “mortgage buffers”.

It’s worth noting that ASIC is alleging Westpac used an expenditure benchmark that was based on “conservative” estimates of what a household would spend and “represents only an estimate of what Australian families consume”.

APRA said this week it is important that lenders accurately assess borrower income and living expenses. Living expenses, in particular, are difficult to measure, and so banks often utilise benchmarks as a proxy where borrower estimates appear too low. In fact, APRA’s recent work showed the lion’s share of loans by the larger lenders are assessed using expense benchmarks, rather than the borrower’s own estimates. There is nothing wrong in principle with using benchmarks, provided they aren’t seen as a substitute for proper inquiries of the borrower about their expenses.

Actually, in some cases, across the market, loans were being made where the borrower had only the slimmest of spare income.

The RBA Governor also warned that rates will rise at some point and discussed why lenders may trade off risks in their book against market share.  To stress the point about rate rises, Canada lifted their cash rate this week, and already there are signs of home price corrections following there. The RBA held the cash rate again this week, and they highlighted the fact that the growth in housing debt has been outpacing the slow growth in household incomes, as well as poor wage growth. They still hold their view on positive future growth.

Some of the economic news this week was quite positive, with ANZ job ads higher rising 2.0% m/m in August, the sixth straight rise. Job advertisements currently sit 13.3% higher than a year ago.

The current account data from the ABS showed a deficient increase to $9.6 billion, partly due to lower export commodity prices.  Exports grew faster than imports though.

Overall the economy grew 0.8% in the June quarter. This was below expectations and was helped by significant government investment. Household consumption figure were pretty solid, but at the expense of the household savings ratio which dipped to 4.6%, (5.3% in March). As a result, the current savings ratio is the lowest since 2008, thanks to very weak wage growth. The point though is this cannot continue indefinitely, because household savings are not infinite, and they are also skewed in distribution terms towards those with more assets and net worth.  Stress resides among households with lower net worth and little or no savings.

Dwelling construction grew a moderate 0.2 per cent with growth being observed in New South Wales and Queensland. On an annual basis GDP growth is 1.9%, and to meet the RBA’s expectations will need to lift over the next year or so. We are not sure where such growth will come from.  We need new ways to lift productivity.

Finally, Retail turnover was flat in July, further evidence of the pressure on household budgets after stronger growth earlier in the year.

So to conclude, we still see home lending growing faster than inflation or wage growth, lifting household debt higher. This is at a time when interest rates are clearly going to rise higher, later.

Lenders are still trading off risk against market share, because at the end of the day, households will pick up the tab in a crash. But households should not simply rely on an assurance from the bank they can afford a loan, they should do their own work, to calculate the real effect on their budgets of a 3% rate rise.  In fact, borrowing less is the best insurance against future stress.

And that’s the Property Imperative weekly to 9th September 2017. If you found this useful do subscribe to get our updates, and check back next week.


Wall Street landlords are chasing the American dream

From The Conversation.

Owning a family home in the suburbs has been a cornerstone of the American dream for many generations. But in 2008, when the United States’ housing bubble burst and a spate of mortgage foreclosures triggered the global financial crisis, that dream was vanquished, and such houses would instead become the sites of shattered lives.

In the aftermath of the crisis, hundreds of thousands of suburban homes were repossessed and sold at auction. With the market in shambles, prices were low. Tightened credit made it hard for individuals to buy – even for those whose credit was not destroyed by the crisis. Investors saw an opportunity, and began buying up houses.

Though house prices have recovered in many regions of the US, many of the people living in these homes are now renting – and their landlords are some of the biggest investment firms on Wall Street. Of course, small scale, mostly local investors have long owned and rented out individual houses. But it simply wasn’t feasible to manage large numbers of individual homes at a distance. As technology changed, it became much more practical for large corporations to manage individual homes spread across different regions.

With access to credit and funds unavailable to the average home buyer, large investors have been able to enter the landlord market in ways that have never been seen before. Blackstone – the world’s largest alternative investment firm – pioneered new rent-backed financial instruments in 2013, whereby rent checks are bundled up and sold as securities, similar to the way that mortgage payments are turned into financial products bought by investors.

Now, Blackstone’s rental company Invitation Homes looks set to merge with Starwood Waypoint Homes; a move that would create the nation’s largest landlord, with roughly 82,000 homes across the country. Another Wall Street backed firm, American Homes 4 Rent, owns a further 49,000 homes across 22 states.

Renting the American dream

Since 2010, the United States has seen a massive rise in the number of families renting the kind of single-family houses that have long been the desire of would-be homeowners chasing the American dream. While estimates vary, the inventory of single family homes being rented has grown by anywhere from three to seven million (35% to 67%) compared with pre-crisis levels. Single-family houses are now the most common form of rental property in the United States.

Overwhelmingly, the people living in these houses are families. Our ongoing research with Jake Wegmann of the University of Texas and Deirdre Pfeiffer of Arizona State University shows that almost half of Single Family Rented (SFR) households (49%) have at least one child under 18; a far greater percentage than rental properties with multiple units (roughly 25%) and owner-occupied homes (31%).

According to our own analysis of the American Community Survey, in 2015 an estimated 14.5m children in the United States lived in a rented single-family home. Demographically, single-family renters are more likely than owners to be people of colour, and to face moderate or severe housing cost burdens. The upshot of all this is that the 40m or so people living in SFR homes now form the basis of a new asset class of rental-backed securities.

Destination unknown

Scaling up portfolios consisting of thousands or tens of thousands of rental homes has made it possible for Wall Street firms to roll out financial instruments suited to “a rentership society”. Securitisation allows big investors to borrow against the value of the properties, to buy more properties and pay off old debt, and acts as a loan that tenants pay back with their rent checks.

Wall Street is no stranger to the housing business in America. But their involvement as landlords of single-family homes is new, and so are the financial instruments they have developed. The impact of Wall Street’s new role is unclear. While rehabilitating houses and helping to stabilise home values in the hardest-hit markets, they may also be crowding out first-time buyers, creating a lopsided market that shuts out would-be owner-occupiers.

Some Wall Street landlords have been singled out for poor repairs, problems with billing and collections and lacklustre customer service. There is also growing concern about the fact that renters of single-family homes have little protection, even in cities with some form of rent control. A report from the Federal Reserve Bank of Atlanta found that large corporate owners of houses are more likely than smaller landlords to evict tenants; some filed eviction notices on up to a third of their renters in just one year.

Here to stay

Wall Street landlords are also making new political allies, hinting they intend to stick around. The largest single-family rental companies have banded together to form a trade group, the National Rental Home Council, which promotes large-scale, single-family rental housing and advocates for public policies friendly to their interests. And it seems to be working.

In an unprecedented move, just after President Trump’s inauguration, the government-backed mortgage agency, Fannie Mae, agreed to underwrite Blackstone’s initial public offering of Invitation Homes stock, to the tune of a billion dollars. Blackstone’s CEO is Steve Schwarzman, one of the president’s most loyal backers. And Thomas Barrack – the recently departed leader of Colony Starwood Homes, which is preparing to merge with Invitation Homes – is a longtime friend of the mogul-turned-president.

Meanwhile, another government-backed agency, Freddie Mac, has announced that it too was supporting investment in single-family rentals, but with a focus on financing for mid-size investors and with an explicit goal of maintaining rental affordability. Non-partisan organisations like the Urban Institute have also suggested that government-backed financing opportunities could help single-family rental serve as a new affordable housing strategy.

All of these developments suggest that the downward trend in home ownership after the financial crisis could be here to stay. And while there is nothing wrong with renting – just as there is nothing inherently good about owning – the changes we are seeing in the single-family rental market bear ongoing scrutiny, to ensure that Wall Street’s demand for profit does not once again wreak havoc on Main Street.

Authors: Desiree Fields, Lecturer in Urban Geography, University of Sheffield; Alex Schafran, Lecturer in Urban Geography, University of Leeds; Zac Taylor, PhD Candidate in Geography, University of Leeds

A House Divided

From The Real Estate Conversation.

The Bank of mum and dad is growing the divide between those who can and those who can’t buy property. The latest Adelaide Bank/REIA Housing Affordability Report shows affordability is worsening, just as new research from Mozo shows increasing numbers of parents are stepping in to help their children get a foot on the property ladder. This chimes well with our own Bank of Mum and Dad research published recently.

The latest Adelaide Bank/REIA Housing Affordability Report shows affordability is worsening in Australia, just as new research from Mozo shows growing numbers of parents are stepping in to help their children get a foot on the property ladder. The trend is causing “a growing divide between the younger generation who have had assistance and those who have not,” Kirsty Lamont, Mozo Director, told SCHWARTZWILLIAMS.

The latest Adelaide Bank/REIA Housing Affordability Report shows that buying a house became even less affordable during the June quarter.

The deterioration in affordability comes as research from Mozo.com.au shows almost a third of all parents are helping their children to buy their first home.

The Adelaide Bank/REIA Housing Affordability Report shows the proportion of median family income required to meet average home loan repayments increased by 0.2 percentage points to 31.4 per cent.

The share of first-home buyers in the market is at its highest level since 2010

There is a bright spot in the data though. The number of loans to first-home buyers increased by 14.0 per cent, with increases in all states and territories except Tasmania.

“First home buyers now make up 14.3 per cent of total owner occupied housing,” said REIA President Malcolm Gunning.

Darren Kasehagen, Head of Business Development at Adelaide Bank, said, “A slight increase in housing affordability shouldn’t overshadow the welcome news that the number of first home buyers  increased by 14.0 per cent during the quarter.”

The rate of first-home buyers has been dropping steadily over the last five years, but appears to have stabilised over the past 18 months, said Gunning.

Rental affordability improved

In the June quarter, the proportion of median family income required to meet rent payments declined by 0.6 percentage points to 24.3 per cent. The improvement was recorded across all states and territories except in Tasmania and the Australian Capital Territory, said Gunning.

Rental affordability is the best it has been since the March quarter 2010, according to Gunning.

The bank of mum and dad is stepping in, expanding the divide between those who can afford to get into the market and those who can not

With it getting harder for first-home buyers to get into the property market independently, the ‘bank of mum and dad’, as lending from parents has become known, has ballooned to being the fifth largest home lender in Australia, sitting behind, ANZ, the Commonwealth Bank, NAB and Westpac.

New research from financial comparison site, Mozo.com.au, shows 29 per cent of parents, or more than 1 million families, help their children purchase a home. Around $65.3 billion has been lent to children, with 67 per cent of parents not expecting any repayment.

The average amount lent to children is $64,206.

“For many first homebuyers, it takes years to scrimp and save for a home deposit and all the while house prices are continuing to skyrocket, making the great Australian dream exactly that – a dream,” said Lamont.

Australian property prices have risen 618 per cent in the last 30 years; wages growth hasn’t kept pace

“With Australian property prices rising by a staggering 618 per cent over the past 30 years and wages failing to keep up, many mums and dads across the country feel they have no choice but to dip into their own savings to help their children get a foot on the property ladder.”

Lamont said by dipping into their own savings and helping out their children, parents are actually shaping the property market.

“We knew that mums and dads were helping their children out, but the reality is they are actually changing the face of the Australian property market,” she said.

“We expect the Bank of Mum and Dad to remain a major player in the property market for years to come, and it’s likely to cause a growing divide between the younger generation who have had assistance and those who have not.”

“Those young Australians who don’t have access to parental assistance may have to shelve the property dream and consider other ways to invest their money and build wealth,” said Lamont.

“The bank of mum and dad is proof of family generosity, but also points to a broken property market for younger generations.”

  • NSW is the most generous state for parental lending with an average lend of $88,250 per family, totalling $32.7 billion.
  • VIC and SA rank second equal, lending around $63,000 per family.
  • ACT and NT are the least generous, lending $20,083 and $15,000 per family respectively.

The most popular ways for parents to help their kids get a foot on the property ladder is by allowing their children to live at home rent free. Other ways parents help is by acting as a guarantor, helping with repayments, or buying property on behalf of or as a partner with the child.

How Australian parents are helping their kids onto the property ladder

How Australian parents are financing their contribution to their children

Data from the Adelaide Bank/REIA Housing Affordability Report from across the nation

Victoria

The number of loans to first home buyers in Victoria increased by 10.0 per cent in the June quarter. In Victoria, first home buyers now make up 21.1 per cent of the state’s owner-occupier market. Rental affordability improved for the quarter with a decrease of 0.7 per cent of income required to meet median rents.

New South Wales

The proportion of family income required to meet loan repayments is 6.6 per cent higher than the nation’s average. New South Wales remains the least affordable state or territory in which to buy a home. Of the total number of Australian first home buyers that purchased during the June quarter, 18.2 per cent were from New South Wales. First home buyers now make up only 13.0 per cent of the state’s owner-occupier market – the lowest level across the nation. Rental affordability improved for the quarter with a decrease of 0.4 per cent of income required to meet median rents.

Queensland

The proportion of income required to meet home loan repayments increased to 27.2 per cent, a 0.5 percentage point increase over the quarter. Of all Australian first home buyers over the quarter, 25.4 per cent or 6003 were from Queensland while the proportion of first home buyers in the State’s owner-occupier market was 25.3 per cent. Rental affordability improved slightly for the quarter with a decrease of 0.7 per cent to 23.0 per cent of income required to meet median rents.

South Australia

South Australia recorded a decline in housing affordability with the proportion of income required to meet monthly loan repayments increasing to 26.8 per cent, an increase of 0.6 percentage points over the quarter but a decrease of 0.1 percentage points compared to the June quarter 2016. In the national breakdown, 5.8 per cent of first home buyers were from South Australia while the proportion of first home buyers in the State’s owner-occupier market recorded an increase of 12.6 per cent. Rental affordability improved by 0.7 percentage points.


Western Australia

The number of first home buyers in Western Australia increased by 16.0 per cent over the quarter and by 3.8 per cent compared to the same time last year. 17.5 per cent of all Australian first home buyers were from Western Australia. Housing affordability declined with the proportion of income required to meet loan repayments increasing to 23.6 per cent or 0.2 percentage points over the quarter but a decrease of 0.3 percentage points year on year.

Tasmania

Housing affordability in Tasmania declined with the proportion of income required to meet home loan repayments increasing to 23.9 per cent, an increase of 0.3 percentage points over the quarter and an increase of 0.2 percentage points year on year.  Rental affordability in Tasmania improved with the proportion of income required to meet median rents decreasing to 25.8 per cent, a 0.8 percentage point drop over the quarter but an increase of 0.8 percentage points year on year.  First home buyers in Tasmania decreased by 3.3 per cent over the quarter and by 17.6 per cent compared to the same quarter last year.

Australian Capital Territory

The number of loans to first home buyers in the Australian Capital Territory increased to 570, an increase of 49.6 per cent over the quarter and an increase of 21.8 per cent compared to the June quarter 2016. Housing affordability in the Australian Capital Territory improved with the proportion of income required to meet home loan repayments decreasing to 19.8 per cent, a 0.3 percentage point drop over the quarter and a decrease of 0.7 percentage points compared to the same quarter last year.  Rental affordability remained stable. The proportion of income required to meet the median rent remained at 17.9 per cent.

Northern Territory

Housing affordability in the Northern Territory improved with the proportion of income required to meet loan repayments decreasing to 20.3 per cent in the June quarter or 0.8 percentage points. This was a decrease of 1.8 percentage points year on year.  Rental affordability in the Northern Territory also improved with the proportion of income required to meet the median rent decreasing to 23.1 per cent or 0.6 percentage points over the quarter or a decrease of 2.0 percentage points compared to the June quarter 2016.

Auction Volumes Fall Across the Combined Capital Cities Leading into Spring

From CoreLogic.

The combined capital city preliminary clearance rate increased to 70.0 per cent this week, up from 68.3 per cent last week, while auction volumes fell week-on-week. There were 2,060 properties taken to auction this week, down from 2,270 last week, although higher than this time last year, when 1,899 auctions were held and a clearance rate of 77.1 per cent was recorded.

The final clearance rate across the combined capital cities has been sitting in the mid-high 60 per cent range since June and it is likely that this will be the case again on Thursday when our final results are published. All but two of the capital cities saw the clearance rate increase week-on-week.

2017-09-04--auctionresultscombinedcapitalcities

Rates Lower For Longer – The Property Imperative Weekly – 02 Sept 2017

New data out this week gives an updated read on the state of the property and finance market. We consider the evidence. Welcome to the Property Imperative Weekly to 2nd September 2017.

Starting overseas, we saw lower than expected job growth in the USA, and also lower than expected inflation. Overall, the momentum in the US economy still appears fragile, and this has led to the view that the Fed will hold interest rates lower for longer. As a result, the stock market has been stronger, whilst forward indicators of future interest rates are lower. In fact, half of the jump caused by the Trump Effect last November has been given back. In Europe, the ECB said there would be no tapering until later, again suggesting lower rates for longer.

This change in the international rate dynamics is relevant to the local market, because it means that international funding costs will be lower than expected, and so banks have the capacity to offer attractor rates without killing their margins.  The larger players still have around one third of their funding from overseas sources and so are directly connected to these international developments.

Westpac for example decreased rates on its Fixed Rate Home and Investment Property Loans with IO repayments by as much as 30 basis points. This sets the new fixed rates for owner occupiers between 4.59% p.a. and 4.99% p.a. while rates for investors lie between 4.79% p.a. and 5.19% p.a. They also brought in a two-year introductory offer on its Flexi First Option Home and Investment Property Loan for new borrowers. After two years, the loan will roll over to the base rate which may be more than 70 basis points higher. This may create risks down the track.

Mozo the mortgage comparison site said that twenty-three lenders have dropped their home loan rates since 1 July, showing that competition for good-quality borrowers is hotting up in the lead up to spring, with lenders offering lower interest rates, fee waivers, or lower deposits for favoured customers. Mozo’s research found the most competitive variable rate in the market for a $300,000 owner-occupier loan is 3.44 per cent, which is 120 basis points lower than the average Big 4 bank variable rate.  Borrowers should shop around.

Elsewhere, Heritage Bank, Australia’s largest customer-owned bank, said it had temporarily stopped accepting new applications for investment home loans, to ensure they comply with regulatory limitations on growth. They have experienced a sharp increase in the proportion of investment lending in their new approvals recently, partly due to the actions other lenders in the investor market have taken to slow their growth.

APRA’s monthly data for July revealed a significant slowing in the momentum of mortgage lending.  Bank’s mortgage portfolios grew by 0.4% in July to $1.58 trillion, the slowest rate for several months. This, on an annualised basis would still be twice the rate of inflation. Investment loans now comprise 35.08% of the portfolio, down a little, but still a significant market segment.

Owner occupied loans grew 0.5% to $1.02 trillion while investment loans hardly grew at all to $552.7 billion, the slowest growth in investment loans for several years. So the brakes are being applied in response to the regulators, although individual lenders are showing different outcomes.

The ABA released a report showing that Less than one third of those surveyed had high levels of trust in the banking industry. This is below the international benchmark. There are significant differences in attitude between those who have higher levels of trust, and those who do not. Those with low trust scores believed the banks were drive by profit, not focussed on customer needs and had terms and conditions which are not transparent.

APRA also released their Quarterly ADI Real Estate and Performance reports to June 2017.  Overall, major banks are highly leveraged, and more profitable. Net profit across the sector, after tax was $34.2 billion for the year ending 30 June 2017, an increase of $6.5 billion (23.5 per cent) on 2016. Provision were lower, with impaired facilities and past due items at 0.88 per cent at 30 June 2017, a decrease from 0.94 per cent at 30 June 2016. The return on equity was 12.0 per cent for the year ending 30 June 2017, compared to 10.3 per cent for the year ending 30 June 2016. Looking at the four major banks, where the bulk of assets reside, we see that the ratio of share capital to assets is just 5.4%, this despite a rise in tier 1 capital and CET1. This is explained by the greater exposure to housing loans where capital ratios are still very generous, one reason why the banks love home lending. Thus the big four remain highly leveraged.

The APRA Real Estate data shows ADIs’ residential mortgage books stood at $1.54 trillion as at 30 June 2017, an increase of $105.2 billion (7.3 per cent) on 30 June 2016. Owner-occupied loans were $1,006.2 billion (65.3 per cent), an increase of $75.8 billion (8.1 per cent) from 30 June 2016; and investor loans were $535.7 billion (34.7 per cent), an increase of $29.4 billion (5.8 per cent) from 30 June 2016. Whilst APRA use a different and private measure of interest only loans, their data showed a significant fall this quarter, although the proportion of new IO loans is still above their 30% threshold.  High LVR lending was down again, although there was a rise in loans approved outside standard approval criteria. Loans originated via brokers remained strong, with 70% of loans to foreign banks via this channel, whilst the major banks were at 48%.

Separately the RBA released their credit aggregates for July. Overall credit rose by 0.5% in the month, or 5.3% annualised. Within that housing lending grew at 0.5% (annualised 6.6% – well above inflation), other Personal credit fell again, down 0.1% (annualised -1.4%) and business credit rose 0.5% (annualised 4.2%). Home lending reached a new high at $1.689 trillion. Within that owner occupied lending rose $7 billion to $1.10 trillion (up 0.48%) and investor lending rose just $0.09 billion or 0.15% to $583 billion.  Investor mortgages, as a proportion of all mortgages fell slightly. A further $1.4 billion of loan reclassification between investment and owner occupied loans occurred in July 2017, in total $56 billion has been switched, so the trend continues.

Building Approvals for July rose 0.7% according to the ABS, in trend terms, approvals for private sector houses rose 1.0 per cent in July, whilst approvals for multi-unit projects continues to slide. This may well adversely hit the GDP figures out soon.  New home sales also declined in July according to the HIA. Sales volumes declined by 3.7 per cent during July 2017 compared with June 2017. Sales for the first seven months of this year are 4.6 per cent lower than in the same period of 2016.

The debate about mortgage broker commissions continues, with a joint submission from four consumer groups to Treasury arguing that brokers don’t always obtain better priced loans for clients than the banks and they don’t always offer a diverse range of loan options.  They suggested that given the trust consumers place in brokers, they should all be held to a higher standard than arranging a ‘not unsuitable’ loan for their customers. They should be required to act in the best interests of their customers. Most industry players argue for minor tweaks or retaining the current structure, arguing that first time buyers may be hit, and that the current commissions do not degrade the quality of advice. CBA apologised to Brokers this week. Ian Narev, the outgoing chief executive officer of the Commonwealth Bank, has apologised to brokers for some of the “uncertainties” it has caused. He said the bank was very committed to the broker channel, as the Aussie transaction shows.  He acknowledged that while the bank has “never shied away” from wanting to do its own business through its branches and direct channels, using a broker was “good for customers”.

CBA was of course in the news for all the wrong reasons, with APRA saying it would look at the culture of the Bank, following the money laundering claims. The investigation will be run by an independent panel, appointed by APRA for six months after which the regulator will receive a final report, to be made public. Of note is their perspective that capital security is not sufficient to guarantee the long term security of the financial system, – culture and accountability are critical too. Of course the big question will be – is CBA an outlier?  Does this also provide more weight to calls for a broader Royal Commission? The bank may also face big penalties if international regulators are forced to act over its breaches of rules around money laundering and terrorism financing. Moody’s says this is credit negative and could damage the bank’s reputation as well as compel it to incur costs and use resources to address any mandated remedial actions

CoreLogic’s revised home price index for August report a 0.1% rise across the capital cities, while regional values fell 0.2%. This was the lowest rolling quarterly gain since June last year. Sydney’s rolling 3-month gain was just 0.3%, with a 13% annual rise. Melbourne was 1.9% in the quarter with 12.7% over the year and Hobart led the pack at 13.6%. Perth and Darwin continue to fall. So the question now is, will the spring surge in sales, and lower mortgage rates support prices, or will we see a fall in the next few months?  Auction clearances remain quite strong.

It is worth saying that the strong growth in Australian home prices is nothing unusual as the latest data from the Bank For International Settlements shows.  Hong Kong has the strongest growth, and New Zealand and Canada are both well ahead of Australia.  We track quite closely with the USA. Spain sits at the bottom of the selected series. The year on year change shows that Australian residential prices are accelerating, whilst the macroprudential measures deployed in New Zealand is slowing growth there. Iceland, Canada and Hong Kong are all accelerating.

So, standing back we see demand for property remaining strong, even if supply of new property is on the slide. Banks are still willing to lend, but are more selective, meaning that some borrowers will find it hard to get a loan, while others will be greeted with open arms and discounts. Banks have the benefits of falling international funding costs and the war chests created by regulator inspired hikes in investor and interest only loans. So we think home prices will continue to find support, and lending will continue to grow overall, even if the mix changes. In addition, we have revised down our expectation of future mortgage rate rises, leading to an estimated fall in the number of defaults, despite the fact that more households are in mortgage stress. We published our updated figures for August on Monday, so look out for that.

And that’s the Property Imperative Weekly to 2nd September 2017. If you found this useful, do subscribe to get future updates and check back for our latest news and analysis on the finance and property market. Thanks for watching.

Latest Auction Results – On The Skids?

Domain has published their preliminary auction clearance results for 2nd Sept 2017.  Normally the start of spring marks an increase in momentum, but it looks as if weakness in Sydney is starting to show, despite banks cutting their lending rates for some new business. Melbourne continues to look pretty strong, but overall results are likely to be lower than this time last year.

Brisbane cleared 41% of 94 scheduled auctions, Adelaide 61% of 59 scheduled auctions and Canberra achieved 66% of 55 auctions.

Auction Volumes Rise Across the Combined Capital Cities

From CoreLogic.

Auction activity increased across the combined capital cities this week, with 2,239 homes taken to auction; the largest number of auctions held since the first week of June. The larger volume of auctions returned a preliminary auction clearance rate of 71.1 per cent, up from last week’s final results when 2,064 auctions were held and 69.8 per cent cleared.

Over the corresponding week last year, the clearance rate was 74.5 per cent and 2,153 auctions were held. It is expected as more results are collected that the final auction clearance rate will revise lower to remain within the high 60 per cent range, where clearance rates have been tracking since early June. Melbourne saw a higher volume of auctions this week (1,116), however the clearance rate for the city fell to 73.8 per cent, while Sydney’s preliminary clearance rate increased to 71.6 per cent across a higher volume of auctions week-on-week (814).

2017-08-28--auctionresultscapitalcities

What Lies Beneath? – The Property Imperative 26 Aug 2017

Mortgage Stress hit the headlines thanks to the ABC Four Corners programme, which used data from our household surveys. But if the tip of the iceberg is high debt, rising costs and devalued incomes, what lies beneath?

We helped make the news this week, so in this special weekly edition of the Property Imperative to 26th August 2017, we take a deeper dive into the underlying drivers of high home prices, and the resultant massive debt burden.

The ABC Four Corners programme set out the first order issues quite well, and you can even use their interactive map to look at stress and interest rate sensitivity by post code, which is based on our data. But they did not touch on the more fundamental second order issues which need to be understood to explain how we got here. So we will discuss some of these more fundamental factors, and show why the whole housing conundrum is so complex.

There are a number of factors which have worked together to create very high property prices here, and in other countries around the world. The root cause is the shift in attitude towards property from somewhere to live, to seeing it as an asset class ripe for investment – the financialisation of property. Given the availability of cheap finance (thanks to low interest rates and in many economies extra stimulus from quantitative easing), and the high demand from investors, globally, price rises evident in many countries, mirroring high stock prices. Many baby boomers are at the front of the queue, looking for investment opportunities. But such high home prices makes it ever harder for new purchasers to enter the market, so rates of home ownership are dropping.

We also see flows of investment capital crossing international boarders, thanks to financial deregulation. For example, in Australia, last year Chinese investors bought more than $30 billion of property, including in some post codes more than 15% of residential purchases. Around the world there is hot money looking for a home, and the stellar returns on Australian property have made it an attractive target, especially in the light of the relatively stable political environment here, and until recently the ease by which foreign purchasers could enter the market. That said, Beijing has tightened controls on outbound investment, and this move will put pressure on prices in key property markets from New York to London. The top three overseas destinations for Chinese property investors in 2016 were the United States, Hong Kong and Australia.

In Australia, demand has also been stoked by strong migration. The recent census showed that 1.3 million new migrants have come to Australia since 2011. The impact of this is much debated, with many arguing that the floods of new residents moving to Australia is one of the most significant factors in play. The “big Australia policy” which, though not planned, is based on the assumption that we need more people to drive growth and pay tax; and so the current migration settings reflect this. Yet there is little proper planning for this continued lift in numbers. Some are now questioning this approach, which is causing significant congestion in our capital cities. And migration rates seem to be climbing with the fastest net overseas migration in 4 years, according to the ABS.

About one in three Australians are employed in property related industries, from building and construction, real estate, finance and specialist services. Because of this there is strong political and economic support for high levels of ongoing investment. The HIA this week released the latest National Outlook Report which suggests the housing sector will become less of an economic driver of the Australian economy, and also underscores the various regulatory interventions from state taxes, to limiting foreign investment and investor lending.

It is also worth saying that the standard line of there being an under-supply of property is questionable when we look at the census data on number of people per residence. In fact, this metric has remained static at 2.6 since 2000. Yet most households in our surveys believe we need more construction, not less.

Property Investment by local residents continues apace, supported by overgenerous tax concessions, across both negative gearing and capital gains.  Around 36% of mortgage lending is for investment property. Strong continued capital appreciation is driving this, and our recent surveys showed that even first time buyers were motivated by these gains. Property investment is pervasive, and as the Four Corners programme showed, some investors are geared up across multiple properties, with an appetite for more.  Earlier this year the ATO released their summary data which included quite comprehensive view of the range of costs those with rental properties have offset income. They also divide rentals into those functioning at a loss, and those who make a profit.

Of the 2.9 million rentals, 1.1 million made a profit, the rest a loss (which can be offset against other categories of income). That means 60% of rentals are under water.

We also showed this week that the Bank of Mum and Dad is the 11th largest lender in Australia, and that more than half first time buyers are looking to borrow from the family many of whom drew capital from their existing property. The Bank of Mum and Dad provides an average of $88,000, and some of this goes to assist first time buyers to go direct to the investment sector.

Then there is the wealth effect which rising home prices provides. Anyone holding property will benefit, at least on paper from capital appreciation, and so do not want to see prices slide. Two thirds of households own residential property, so the political weight of numbers is on the side of keeping home prices growing. No wonder, politicians do not want to be holding the reins of power when prices go south.  Neither do they want to rock the boat on negative gearing – though Labor says they would tackle it.

Talking of political power, most states are befitting significantly from the stamp duty received on home purchases. For example, NSW enjoyed more than $7bn of receipts from residential transactions last year – a sizable share of their entire revenue budget. So states and territories do not want to turn that off.  In addition, many are slugging foreign investors additional taxes and charges, to further boost revenue.

Then of course, the banks continue to grow residential lending at three times inflation or CPI, creating, as we discussed last week an amazing debt monster.  This is helped by generous capital ratios which makes home lending more capital efficient than lending to business, even of the growth it generates is, well, illusory.  But for lenders, mortgage lending is highly profitable, and remains their primary growth engine. They will continue to lender as hard as they can, targeting lower risk households in particular.

The profitability of the finance industry was underscored by results from two of the aggregators – these players sits between the banks and mortgage brokers. Mortgage Choice delivered a 10.2% growth in cash profit, though revenue was up just 1.1% to $199 million. They have 654 credit representatives and settlements rose to 12.3 billion.

Australian Finance Group (AFG) reported a 2017 net profit of $30.2 million an increase of 33% on FY2016. They now have around 2,900 mortgage brokers, and process on average around 10,000 loan each month with 45 lenders on their panel.

The finance sector is reliant on a buoyant home lending sector, and as Four Corners highlighted, with 60% of their assets in this business, they would be exposed in any downturn. We also saw in the programme some examples of shoddy practices in the sector, and generally we believe that underwriting standards are still too generous.

The regulatory structure in Australia, with the RBA, ASIC and APRA, collectively with Treasury in the Council of Financial Regulators, has been myopic in its focus, not wanting to rock to boat given the high economic impact of the construction sector, with high volumes of apartments coming on stream in the next year or two. They finally got around to pressing down on interest only loans – too little too late in our view, but this has given the banks ample ammunition to lift the interest rates on these loans, and as a result, they are competing for principal and interest loans, especially for owner occupied borrowers below 80%, with keen rates.  Note too, lenders were forced to tighten their controls, which suggests that the risk management processes in the banks is not adequate, we think they are trading volume and profit over prudent behaviour. Overall loan growth is too strong relative to incomes, but no one wants to talk about the risks of this in a low income growth environment. The regulators are trapped because rates are too low, but they cannot raise them because of the pressures this would exert on households. They argue the systemic financial stability risks are being adequately managed, we are not so sure.  Currently loan volumes continue to grow too strongly.

So in summary, if you pile up all the stakeholder groups who benefit from rising prices, ranging from existing owners, investors, lenders, the construction sector, and the political weight of numbers, no surprise that little is being done to tackle the root cause issues – of high migration, poor lending standards and too strong mortgage loan growth.  This underpins the high household debt and rising mortgage stress.

The politicians may play lip service to housing affordability, and lenders still claim they are being disciplined in the current environment. But it could all too easily turn to custard.

We need a focussed policy on controlling migration, effective planning to accommodate growth, tighter lender restrictions and higher interest rates. But the likelihood is we will continue to muddle though, kick the can down the street, and hope it will turn out ok. But, hope, to quote former New York City Mayor Rudy Giuliani, is not a strategy.

And that’s the Property Imperative Weekly to 26th August. If you found this useful, do subscribe to get our latest updates, and check back again for next week’s installment.