The combined capital city preliminary clearance rate increased to 70.7 per cent this week, up from 67.3 per cent last week, while auction volumes fell week-on-week. There were 1,751 properties taken to auction this week, down from 2,001 last week, although higher than this time last year, when 1,399 auctions were held and a clearance rate of 70.6 per cent was recorded.
Over the past 5 weeks, the final clearance rate across the combined capital cities has been sitting in the mid-high 60 per cent range and it is likely that this will be the case again on Thursday when our final results are published.
All but two of the capital cities saw the clearance rate increase week-on-week while Melbourne recorded the highest preliminary clearance rate at 73.9 per cent.
Category: Property Market
Three reasons the government promotes home ownership for older Australians
Government strategies to manage population ageing largely assume that older Australians are home owners. There is often an implied association between home ownership and ageing well: that is, older Australians who own homes are seen as having made the right choices and as being less of a budget burden.
The problem with this approach is that not everyone is or can be a home owner. A great many households are, for many reasons, locked out of home ownership.
My analysis of 20 years of federal government ageing strategies and age-focused analyses of the housing system shows that Australian governments of all persuasions have shared three common beliefs about the economic value of home ownership in later life. They have promoted home ownership as:
- somewhere to live;
- an asset to rent or sell; and
- a way to access and spend equity.
Somewhere to live
Australian governments have valued and promoted home ownership because it provides somewhere to live in later life, with no regular ongoing costs such as rent.
As a 2015 Productivity Commission report argued:
Because the majority of older Australian households own their homes outright, their housing costs are typically very low, yet they enjoy the benefits from continuing to live in their homes. […] This source of value (relative to overall household expenditure) becomes markedly more important with increasing age.
Owning a home is seen as largely cost-neutral, though the costs of maintaining housing are recognised in some documents. In contrast, the privately rented home is discussed as an ongoing financial burden.
Home ownership is seen to provide economic security by freeing up income, so that people have greater disposable income for discretionary lifestyle spending in later life.
In other words, owning a home enables home owners to be consumers. While this can be seen as ensuring quality of life in older age, it also connects strongly with a broader government goal of growth in consumer spending.
An asset to rent or sell
Governments have also valued home ownership as an asset that people can rent out or sell so they can pay for costs associated with moving to “age-appropriate” housing. This includes paying bonds for retirement villages or nursing homes.
It has been suggested that older home owners are better equipped than, say, renters with the financial resources to make “appropriate” choices for housing and care in later life.
For example, they might be able to afford to buy housing within an “active lifestyle community”. And any leftover funds can fund higher levels of consumption in retirement.
So, home ownership has been understood as an individualised way of managing the risks of ageing.
People who own higher-value housing are better off in this scenario, as they will reap greater profits if they sell their home, or secure a higher income if they rent it out.
However, these benefits can be difficult to access. This is due to the very high costs of housing in some cities, and the risks associated with some retirement housing.
Accessing (and spending) housing equity
The third way governments have seen value in home ownership is through new financial products that enable home owners to access – and spend – home equity.
Emphasis is usually placed on the capacity to make a proportion of the home “liquid” while retaining overall ownership and the ongoing right to live in the house. For governments, this has two benefits:
- It enables older people to pay for more of the costs of older age, including for aged care. This is a way of shifting these costs away from the government in situations where people are seen as having the capacity to co-contribute.
- It enables home owners “to pay for additional services over and above the approved care”, according to the Productivity Commission. This supports government goals for economic growth by expanding the aged care market.
Funds released in this way enable lifestyle “choice” and better care in older age.
Home owners are winners
These three benefits suggest a system in which home owners are equipped with greater spending power – and hence choice – in older age. They are likely to have access to higher levels of care, and to be more able to make choices that enable them to age “well”.
Quite curiously, in some documents baby boomers are distinguished as desiring higher-quality services in later life. The capacity to access and spend home equity is seen as enabling this possibility.
The promotion of home ownership as a way of funding care in later life is part of a broader policy trend toward making people personally responsible for the opportunities they have in life. While this may make intuitive sense, it is unjust because it ignores factors that shape income and investment opportunities, including home ownership, over the life course.
Data from the 2016 Census show that households living on the median single-person income could not afford the median rent in Australia, and that home ownership is increasingly out of reach.
Single older women are among the fastest-growing group of homeless people in Australia. And, for non-home owners, poverty in later life is on the rise.
Australia needs ageing strategies that do more than assume everyone is a home owner – or that home ownership is a simple choice.
Author:
Senior Research Fellow, Geography and Urban Studies, Western Sydney UniversityInequality Rules – The Property Imperative Weekly 8th July 2017
The Reserve Bank held the cash rate, more banks hiked mortgage interest rates, household debt rose again and our latest research showed that more than 800,000 households across Australia are experiencing mortgage stress. Welcome to the latest edition of the Property Imperative Weekly.
HSBC said the housing bubble fears were overblown. At a national level, a key reason for rising housing prices has been housing under-supply, Chief Economist Paul Bloxham wrote in a research note on Thursday and suggested that a significant fall in Australian housing prices, as occurred in the U.S. and Spain during the global financial crisis, is unlikely.
But data from CoreLogic showed whilst home prices rose in the last quarter, whilst auction volumes fell, and housing affordability deteriorated. The national price to income ratio was recorded at 7.3 compared to 7.2 a year earlier, and 6.1 a decade ago. It would have taken 1.5 years of gross annual household income for a deposit nationally at the end of the March compared to 1.4 years a year earlier and 1.2 years a decade ago. The discounted variable mortgage rate for owner occupiers was 4.55% and an average mortgage required 38.9% of a household’s income.
New data from the RBA showed that the household debt to income rose to a high of 190.4. Households are more in debt than they have ever been, and the main question has to be, can it all be repaid down the track, before mortgage interest rates rise so high that more get into difficulty.
Our June mortgage stress results showed that across the nation, more than 810,000 households are estimated to be now in mortgage stress up from 794,000 last month, with 29,000 of these in severe stress. This equates to 25.4% of households, up from 24.8% last month. We also estimate that nearly 55,000 households risk default in the next 12 months. The main drivers are rising mortgage rates and living costs whilst real incomes continue to fall and underemployment is on the rise. This is a deadly combination and is touching households across the country, not just in the mortgage belts.
We analyse household cash flow based on real incomes, outgoings and mortgage repayments. Households are “stressed” when income does not cover ongoing costs, rather than identifying a set proportion of income, (such as 30%) going on the mortgage. Stressed households are less likely to spend at the shops, which acts as a drag anchor on future growth. The number of households impacted are economically significant, especially as household debt continues to climb to new record levels.
Census data shows that Home ownership has continued to fall among younger Australians. Only 36 per cent of people aged 25-29 said they owned their home outright or with a mortgage – likely the lowest level since at least the 1960s. Home ownership for the next age group, 30-34, also declined, to 49 per cent, which is likely another record low.
Overall inequality in Australia is rising, between those who have property and those who do not. Australia has prominent examples of economic policies that disproportionately benefit the upper-middle class, such as the capital gains tax discount and superannuation tax incentives. We also have a geographically concentrated income distribution, with the rich living in neighbourhoods with other rich people. The poor are also more likely to live in close proximity to people who share their disadvantage.
There were major changes to mortgage rates and underwriting standards this week, with many following the herd by lifting rates for interest only borrowers, especially investors whilst making small downward movements in principal and interest loan rates, especially at lower LVRs.
NAB will start automatically rejecting customers who want to borrow a high multiple of their income and only pay interest on their home loan, amid concerns over the growing risks created by rising household indebtedness. While NAB already calculates loan-to-income ratios when assessing loans, it has not previously used the metric to determine whether a customer gets a loan, and such a blanket approach is unusual in the industry.
We have maintained for some time that LTI is an important measure. It should be use more widely in Australia, as it is a better indicator of risk than LVR (especially in a rising market).
Several more banks tweaked their mortgage rates this week. Virgin Money for example increased its variable and fixed rates for new owner occupied loans for LVRs of over 90% by 35 basis points or 0.35%, and increased its standard variable rates for owner occupied and investment interest online loans by 25 basis points.
Auswide Bank announced an increase to their reference rates for investment home loans and lines of credit of 25 basis points from 11 July 2017 will result in a new standard variable rate (SVR) of 6.10%. They blamed funding pressures and regulatory limits on investment and interest only lending.
ING Direct changed their reference rates, for owner-occupier borrowers, the principal and interest rates will decrease by 5 basis points. But for owner-occupier borrowers, interest-only rates will increase by 20 basis points and investor borrowers on interest-only loans will cop a 35 basis point rise. They are also encouraging borrowers to switch to principal and interest repayment loans.
Bendigo Bank lifted variable interest rates by 30 basis points for existing owner occupied interest only customers and 40 basis points for existing investment interest only customers. They also lifted business loans with new business interest only variable rates up by 40 to 80 basis points and fixed interest only rates increasing by 10 to 40 basis points. On the other hand, new Business Investment P&I variable rates will decrease by 15 basis points and fixed P&I interest rates decreased by 30 basis points.
The RBA held the official cash rate at 1.5 per cent for the tenth time on Tuesday. It hasn’t moved since a 25 basis point cut in August 2016. But Analysis shows that the gap between the RBA rate and the standard rate banks quote to mortgage borrowers is around the widest in 20 years. The Banks did not pass on the full benefit of the RBA’s record-low rates in order to offset costs and prop up profits. Last year there was a massive race to the bottom in terms of discounts to try to gain volume and share. Many banks dented their margins in the process. But now they’ve now got the perfect cover, thanks to APRA’s regulatory intervention, and so we expect to see mortgage rates continuing to grind higher, particularly for investors and anyone on interest-only. This will simply lead to more mortgage stress down the track whilst the banks rebuild their profit margins. Another example of inequality.
And that’s the Property Imperative to the 8th July. Check back again next week
City planning suffers growth pains of Australia’s population boom
Australia has the highest rate of population growth of all the medium and large OECD countries. And more than three-quarters of the growth is in four cities: Sydney, Melbourne, Brisbane and Perth. But urban planning for this growth is often inadequate.For a start, attempts to reduce infrastructure costs and save agricultural land by imposing urban growth boundaries have foundered.
In Melbourne, the statutory urban growth boundary has repeatedly been pushed outwards. The city is struggling to meet its urban consolidation targets.
In Brisbane, a 2015 University of Queensland study found well-connected individuals own 75% of rezoned greenfield areas but only 12% of comparable land immediately outside the rezoning boundaries. The researchers conclude that rezoning was primarily driven by these landowners’ relationship networks.
In turn, planning is failing to protect high-value environments from urban development. Policies to preserve koala habitat around Brisbane have failed. Land clearing has increased since 2009.
And in Western Australia, under Perth’s draft strategy, 50% of the remaining feeding habitat of the endangered Carnaby’s black cockatoo and 98 square kilometres of banksia woodland will be lost.
Despite their expanding area, Australian cities have less green open space. In attempts to reduce the costs of new infrastructure to meet the needs of increasing populations, average housing block size has been reduced.
New suburbs have virtually no backyards because the planning process has failed to mandate minimum garden areas. The result is urban heat islands that lack greenery and recreation space.
Costly housing of poorer quality
Rising populations require more infrastructure. In Australia, the developer contributions required to fund new local infrastructure are passed on to new home buyers in the form of higher house prices, reducing affordability.
Alternative methods could eliminate up-front hits on new home owners. An example is benefit assessment districts, where infrastructure is funded by bonds and repaid by the beneficiaries over decades. But state governments are resistant to this because new public loans are seen as a threat to state credit ratings.
Governments are also reluctant to use value capture, which involves applying a levy on increased property values arising from greenfield or brownfield rezoning. The levy proceeds pay for infrastructure or affordable housing.
Governments have seen such a levy as increasing developer costs and thus decreasing affordability. However, if value capture is signalled in advance, developers will reduce the price they pay for new sites to take account of the levy. In high-cost London, affordable housing targets of 35% have been applied to developers, compared to the 5% proposed for Sydney.
Furthermore, poor planning for high-density developments in Melbourne has allowed developers to meet increased population demand by constructing “vertical slums” of micro-apartments of under 50 square metres with windowless bedrooms.
Such developments are illegal in comparable world cities. A recent report found that weak planning controls have allowed Melbourne’s high-rise apartments to be built at four times the densities allowed in Hong Kong, New York and Tokyo.
Due to the supposed effects on affordability and saleability, developers are not being required to provide new open space for higher-density urban populations. In some cases, these services aren’t being funded because governments set caps on developer contributions to local infrastructure to reduce dwelling costs.
According to the Local Government NSW association, necessary state government infrastructure for higher population densities is often lacking too.
Politics of traffic
Urban population growth forecasts are driving estimates of huge increases in traffic congestion costs. However, electoral politics are also overriding pro-public transport strategies such as metro rail.
Three major motorway projects initiated during the Abbott era in Sydney, Melbourne and Fremantle cut through left-leaning inner-city electorates, while appealing to outer-suburban swing voters.
Inner-city motorway developments are still proceeding. WestConnex (Sydney), Western Distributor (Melbourne) and Legacy Way (Brisbane) are driving investments in private profit-making transport infrastructure. Comparable cities overseas, such as San Francisco, Toronto, Vancouver and Los Angeles, stopped building inner-city motorways years ago.
The business cases for new motorways also omit significant community costs. In the case of WestConnex, these include:
- the costs of the extra sprawl induced by longer but quicker commuting trips;
- the time and revenue costs of capturing tens of thousands of daily public transport trips; and
- loss in value of properties near to interchanges.
Deficient business cases caused four inner-city motorways – Cross City Tunnel, Lane Cove Tunnel, Clem 7 Tunnel and Airport Link – to go into receivership in the last few years, as the demand was never there.
Overstretched public transport services are a source of rising political tensions. AAP/Joel Carrett
Hostage to the Growth Machine
Part of the problem is Australia’s acute vertical fiscal imbalance.
For instance, 80% of Sydney’s taxes go to the Commonwealth, not the state government. This means the federal government reaps the income gains from bigger city populations, while the states lack the resources to provide adequate urban infrastructure and services for these growing populations.
Perhaps the shortcomings of planning resulting from the need to accommodate fast-growing populations could be mended with reduced growth.
But Australian cities show all the symptoms of Molotch’s notion of a Growth Machine: a large cast of actors – the development industry, property owners and many more – have a vested interest in continued rapid population growth, and lobby to keep that growth going.
Author: Glen Searle; Honorary Associate Professor in Planning, University of Queensland and, University of Sydney
China’s Cooling Housing Market Set to Weigh on Economy
China’s housing market is likely to continue to cool in response to stronger restrictions on home purchases across many cities and tighter credit conditions, say Fitch Ratings. Housing is the key cyclical sector in the Chinese economy, and will weigh on growth in the second half of the year and into 2018.
There is already evidence that the housing market is slowing. Growth in new residential property sales decelerated to 24.0% yoy (on a trailing 12-month basis) in May 2017, down for the fifth straight month from the 36.2% peak in December 2016. Price gains have also moderated. Secondary home prices in Tier 1 cities rose by 28.7% in 2016, but increased by just 3.6% in the first five months of 2017, and fell for the first time since September 2014 in May.
The downturn has been policy driven, with the authorities stepping in to prevent excessive froth in the market. Tightened rules on home purchases and mortgages are curbing buying by speculators and upgraders. Some first-time buyers might also be postponing purchases in the expectation that prices may fall. Meanwhile, the increased focus of the authorities on controlling leverage and limiting financial risks has led to a significant rise in money-market interest rates since last December, and some banks have recently increased mortgage rates.
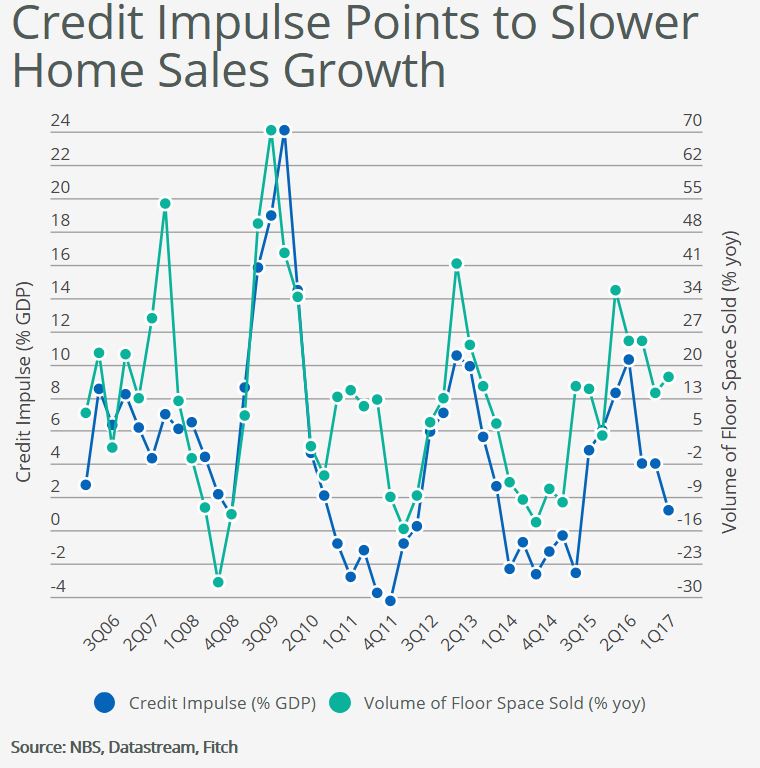
The near-term outlook for China’s housing market is closely linked to the domestic credit cycle. As the chart below shows, housing sales move broadly in line with the “credit impulse” – or the change in the flow of new credit (including local government bonds) as a share of GDP. A weaker credit impulse, along with the tightening of home purchase restrictions, is likely to drag down home sales growth further in 2H17.
That said, the government will want to avoid causing significant volatility in the market. Home sales dropped by 9% yoy in early 2015, following the last tightening of restrictions, which contributed to a strong release of pent-up demand when policies were subsequently relaxed. We expect a more cautious approach this time, which is likely to result in home sales stalling, but not falling, in 2H17.
House prices are likely to decline slightly in 2H17, as demand weakens. We expect prices in Tier 1 cities to hold up better than in lower-tier cities. Prices in Tier 1 cities have risen by almost 90% in the last four years, compared with increases of 10%-25% in lower-tier cities. However, demand in Tier 1 cities remains strong and land supply is tight, which gives the authorities more scope to support the market if the downturn is sharper than expected. In lower-tier cites, demand is weaker and developers’ housing inventories are higher.
A likely weakening in the housing market is one of the main reasons behind our forecast that GDP growth will slow in 2H17. Investment in housing alone accounts for around 10% of GDP, and most estimates place its contribution to GDP much higher once supporting industries are included. There tends to be a six- to eight-month lag from sales to housing investment growth, which means that the economic impact of the housing market slowdown will continue well into 2018, when we expect GDP growth to slip slightly below 6%.
Australian housing `bubble’ fears overblown, HSBC economist says
From Mortgage Professional Australia.
(Bloomberg) — Soaring home prices in Australia’s biggest cities are driven by strong demand and a lack of supply, rather than indicating a “bubble,” according to HSBC chief economist Paul Bloxham.
“At a national level, a key reason for rising housing prices has been housing under-supply,” Bloxham wrote in a research note on Thursday. “This also suggests that a significant fall in Australian housing prices, as occurred in the U.S. and Spain during the global financial crisis, is unlikely.”
Five years of red-hot growth have left prices in Sydney and Melbourne up 80% and 60% since mid-2012, fueling bubble concerns. In June, Moody’s Investors Service cut the long-term credit ratings of the major banks, saying surging home prices, rising household debt and sluggish wage growth pose a threat to the lenders.
Bloxham, a former staffer at the Reserve Bank of Australia, said that “fundamental factors” largely explain the price boom and, “as a result, we do not judge it to be a bubble.”
Demand for housing in Melbourne and Sydney has been supported by domestic and international migration, foreign investment and a lack of new supply, he said. Price increases have been much smaller in places such as Perth, where demand has been weaker amid the waning of a mining boom.
APRA has gradually been ratcheting up restrictions on riskier loans and in recent months the big lenders have all raised interest rates charged on interest-only loans. Bloxham said he believes these regulatory measures will help cool the market, along with lower demand from overseas and increased supply.
Census makes it official: young Australians are priced out of home market
Home ownership has continued to fall among younger Australians, the latest census has revealed.
The Australian Bureau of Statistics provided data to The New Daily on Thursday that confirmed home ownership among the classic ‘first home buyer’ demographic – those aged 20 to 39 – declined again in the 2016 census.
It showed that only 36 per cent of people aged 25-29 said they owned their home outright or with a mortgage – likely the lowest level since at least the 1960s.
Home ownership for the next age group, 30-34, also declined, to 49 per cent, which is likely another record low.
And 35 to 39 year olds also dropped to 58 per cent, down from 61 per cent in the previous census in 2011.
The data is similar to that provided by the ABS to Tim Colebatch at Inside Story.
In fact, rates of fully paid or mortgaged home ownership declined in all groups up to the age of 64.
Overall rates of home ownership did not drop dramatically between the 2011 and 2016 census, as older age groups – which are gradually accounting for a larger share of the population – actually increased their ownership.
The cause may not be as simple as many think.
Similar analysis of home ownership rates by Dr Judith Yates, one of Australia’s leading housing economists, apportioned more than a small part of the blame to growing economic inequality.
Dr Yates provided an estimate of ownership rates to a Senate inquiry in 2015, along with a detailed explanation of the causes.In her submission, she blamed many of the usual culprits, such as declining rates of marriage and fertility among young people (which makes them less eager to buy homes), rising prices, tax concessions for investors, the scarcity of urban land for development, and demand pressures from population growth.
But Dr Yates characterised several of these factors in a way many others had not: as a consequence of worsening income and wealth inequality, beginning in the 1970s, which she dubbed “The Disappearing Middle”.
“Increasing inequality continued through from the mid-1990s until the late 2000s, having accelerated between 2003-04 and 2009-10 as a result of its uneven economic growth generating disproportionate benefits for those in the top half of the income distribution,” Dr Yates wrote in her 2015 submission.
“Disproportionate growth in incomes at the top end of the income distribution meant increased borrowing capacities for households with high home ownership propensities.”
Her submission also blamed the increasing income disparity on uneven economic growth; high inflation and high interest rates in the 1980s; the burden of HECS debts; and the fact that the financial liberalisation of the 1990s “benefited high-income households”.
“Encouraged by persistent and high capital gains from the mid-1990s generated by population and real income growth and underpinned by housing supply shortages, established households – the primary beneficiaries of increasing income and wealth inequalities – increased their demand both for owner-occupied housing and, increasingly, for investment housing.”
Dr Yates noted that tax concessions for landlords, such as negative gearing and the capital gains tax concession, are also “biased towards high-income households”.
In a way, this is good news. The fact that most of Australia’s mortgage debt is held by “high-income, high-wealth households”, as Dr Yates put it, makes the economy less likely to undergo a US-style mortgage crash, as the Reserve Bank has noted many times, because that global crisis was driven by a boom in lending to low-income households.
The bad news, confirmed by the latest census, is that younger Australians are increasingly squeezed out of the market, not just by demographic change, but by the greater accumulation of wealth at the top of society.
As Dr Yates wrote: “These are the households with an economic capacity to outbid many potential first home buyers and who benefit from tax privileges that provide them with an incentive to do so.”
Fintechs warn Domain and REA of mortgage ‘challenges
Two mortgage fintechs have warned that the REA Group and Domain, as well as customers and brokers, could face ‘challenges’ as a result of the property companies’ forays into mortgages.
Last week, both the REA Group and Domain Group revealed plans to break into mortgage broking, with realestate.com.au acquiring a majority stake in mortgage broking franchise business Smartline and entering into a strategic mortgage broking partnership with NAB. Likewise, the Fairfax-owned property classified group announced that it will launch Domain Loan Finder, in partnership with mortgage platform Lendi.
However, Mandeep Sodhi, CEO of online brokerage HashChing, has suggested that the new offerings from Domain and realestate.com.au could upset the market.
He said: “[These sites] have traditionally been seen as helpful, independent websites for consumers to research their next dream home or investment property. However, the most recent partnerships by both with mortgage broking platforms has the potential to restrict choice in the market.
“Pushing borrowers to one group of brokers – who may not have access to all the banks and lenders – means they could unwittingly miss out on home loan products that better suit their needs.”
Mr Sodhi added that brokers could be negatively affected, as the two sites had historically been “strong sources for generating leads for aggregators to date” and brokers who aren’t members of the partnered mortgage broking platforms would have to therefore find new lead sources.
Likewise, the founder and CEO of online brokerage uno. has suggested that while the move by Domain and REA’s realestate.com.au site is “logical”, the companies could face “challenges” while breaking into the mortgage arena.
Speaking to The Adviser, Vince Turner explained: “These guys have a lot of eyeballs, a big audience, and their traditional line of business in terms of advertising [such as website advertising via cost per click] is now going into the nominal value territory. They are not on the way out yet, but they will be soon.
“So, from Domain or REA’s point of view, they have to think what their transactions are that they can monetise … So, you can see why they want to get into transactional mortgages, that’s the logical part.”
However, Mr Turner warned that breaking into a new industry (i.e. mortgages) is not only challenging from a cultural perspective, but also from a customer buy-in perspective.
He explained: “You could argue that it’s pretty hard to get out of bed in the morning and be a media company [publishing company Fairfax owns Domain] and a financial services company. It’s very different culturally and it’s a very different set of skills, so I think that will be part of the challenge… These things are not natural to them.”
The uno. founder said that his company had partnered with several different companies, but that the thinking was that these partnerships would only be around 10 or 20 per cent of its business.
He said a large part of the difficulty would be getting customer buy-in, as users of the realestate.com.au and Domain are not primarily visiting the sites for a mortgage, but for a property listing/rental listing.
“It’s difficult to get a consumer to get onboard with a something that is not what they went to the site for. For example, they are using the sites for real estate, not a mortgage, so it’s challenging to get them onboard with this new side,” Mr Turner said.
“We know it’s challenging because we have been working real estate sites and we operate with other sites that want to bundle mortgages into their consumer experience … [if] the customer didn’t go there for a mortgage, trying to intercept them and say ‘Look at this mortgage over here’, it’s difficult.”
Another obstacle that these sites could face is the customer service side of handling a mortgage, Mr Turner said.
“Consumers who are going to these sites are operating digitally, so convincing them to go through the mortgage process, which needs ‘advice’, is challenging,” he said.
Mr Turner revealed that delivering that support and ‘advice’ had been a challenge for uno. and explained that, although he believes the online brokerage is “leading this space in delivering an advice experience and the support experience digitally”, it had spent the last year trying to solve this conundrum and “still has a long way to go”.
“I think it’s going to be a long road for Domain and REA in getting this to work for them,” he added.
“I think they have the pockets to push it and they have made it a strategic priority (and maybe they will get there in the end), but its not as simple as just bolting on a mortgage broking business. It’s a lot more complicated than that.”
Capital City Dwelling Values Rise 0.8% Over June Quarter
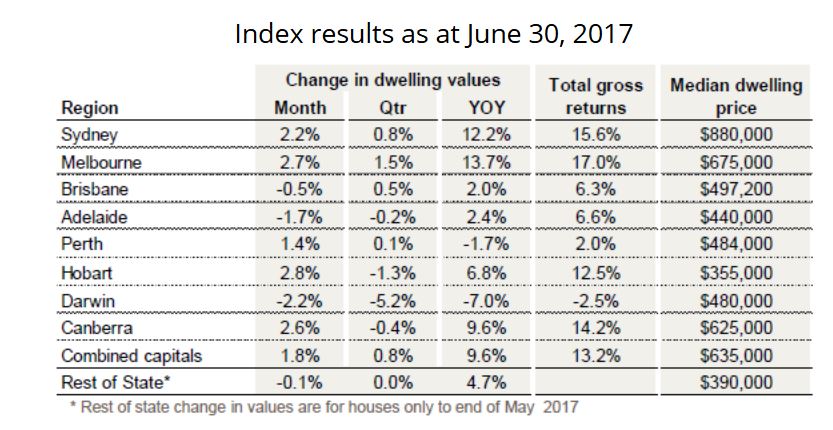
The CoreLogic Home Value Index recorded a recovery from the 1.1% fall in May, with a 1.8% rise in capital city dwelling values over the month of June. According to CoreLogic head of research Tim Lawless, “This stronger month-on-month reading can be partially explained by the seasonality in the monthly growth rates. Adjusting for this effect suggests an easing trend in housing value growth has persisted through the second quarter of 2017.”
The June quarter results showed that capital city dwelling values were 0.8% higher across the combined capitals index; the slowest quarterly rate of growth since December 2015 when the combined capitals index fell by 1.4%.
Index results as at June 30, 2017
Mr Lawless said, “This trend towards lower capital gains across the combined capitals index is mostly attributable to softer conditions across the Sydney housing market, where quarter-on-quarter growth was recorded at 0.8% over the June quarter; down from 5.0% over the March quarter. In contrast, the quarterly trend in Melbourne has been more resilient, with growth easing from 4.2% over the March quarter to 1.5% over the three months ending June.”
Weaker auction results are further evidence of slowing housing market conditions.
For Sydney, Mr Lawless said the more pronounced slowdown is supported by weaker auction clearance rates which have been tracking in the high 60% range across the city over the last three weeks of June, while in Melbourne, clearance rates have moderated but remained above 70%. He said, “Both markets experienced auction clearance rates consistently in the high 70% to low 80% range over the March quarter.”
Slower housing market conditions also reflected in the annual pace of capital gains.
Across the combined capitals, the annual pace of capital gains has eased from 12.9% three months ago to 9.6% at the end of June 2017. Sydney’s annual growth rate has slowed to 12.2% over the twelve months ending June 2017, down from a recent high of 18.9% three months ago. Melbourne’s annual growth rate is now the highest of any capital city, surpassing Sydney’s annual rate of growth despite easing from 15.9% three months ago, to 13.7% over the twelve months ending June 2017.
Outside of Sydney and Melbourne, housing market conditions remain diverse.
Brisbane now has the third highest quarterly pace of capital gains with dwelling values 0.5% higher over the June quarter. Brisbane’s growth is entirely attributable to a 0.8% rise in house values which offset a 2.4% fall in unit values over the quarter. Dwelling values slipped lower across the remaining capital cities, except Perth, which posted virtually flat growth conditions (+0.1%) over the June quarter.
Weekend auctions litmus test of new first-home-buyer benefits
From The Real Estate Conversation.
The 1 July introduction of stamp duty concessions for first-home buyers in New South Wales and Victoria added some warmth to otherwise wintry auction market conditions on the weekend.
Across Australia’s seven capital cities, the clearance rate was 70.3 per cent. The final result for the previous week was 66.5 per cent, the lowest clearance rate since June 2016.
In Melbourne, 619 auctions were held on the weekend, with a preliminary clearance rate of 74 per cent recorded, according to REIV data.
Both figures were up on the same period last year, when 223 homes went to auction and a 70 per cent clearance rate was recorded.
Real Estate Institute of Victoria CEO, Gil King, told SCHWARTZWILLIAMS, “High auction volumes (in Melbourne) coincided with changes to government policy with new stamp duty concessions now available for first homebuyers purchasing under $750,000.”
From 1 July, stamp duty for first-home buyers purchasing properties worth less than $600,000 was abolished, and stamp duty concessions are available for first-home buyers purchasing property valued between $600,000 and $750,000. The exemptions and the concession will apply to both new and established homes.
The Victorian government also removed stamp duty concessions for off-the-plan investment properties, except for those who intend to live in the property or who are first-home buyers.
“This weekend saw a record number of homes go under the hammer for the first week of July with more than 615 auctions held – surpassing the previous 2010 record when 591 homes were auctioned,” said King.
Suburbs in Melbourne’s middle ring dominated, led by Reservoir with 14 auctions and 12 sales. Hoppers Crossing and Sunbury both recorded 100 per cent clearance rates from six auctions. The City of Darebin and Moreland recorded the highest volumes on the weekend, with 38 and 34 auctions respectively.
“Strong auction activity was also recorded in Greater Geelong, with 27 auctions held over the week,” said Gill.
John Cunningham, president of the Real Estate Institute of New South Wales, told SCHWARTZWILLIAMS, “Saturday 1 July was the first real test of the new first-home owners stamp duty concessions and the foreign investor stamp duty surcharge.”
In New South Wales, the government has scrapped stamp duty for first-home buyers for new and existing homes up to a value of $650,000, and delivered stamp duty concessions for first-home buyers for properties up to a value of $800,000.
The government has also doubled the stamp duty surcharge for foreign investors from 4 per cent to 8 per cent, and increased land tax for foreign buyers from 0.75 per cent to 2 per cent. Stamp duty discounts for foreign buyers purchasing off the plan have been removed.
Sydney’s initial clearance rate last week was 72.6 per cent.
Overall, said Cunningham, the market is cooling across NSW, where days on market is growing and price and reserve price discounting is very evident.
Cunningham said the auction reporting ratio of 63 per cent was one of the lowest he has seen. The auction reporting ratio was 74 per cent the previous week.
“Could it just be lazy agents, or is there more to hide than the 69 per cent recorded clearance rate?” asked Cunningham.
“We will have to wait until mid week to find the true result,” he said, referring to the release of the adjusted auction clearance rates.
Chris Wilkins, director of Ray White Drummoyne, told SCHWARTZWILLIAMS the Drummoyne market was “boring” last week.
“We’ve definitely noticed some lack of interest and intensity from buyers,” he said.
At one auction during the week, two buyers turned up, but neither registered to bid.
Wilkins said that rather than underquoting, which receives so much media attention, agents are sometimes overquoting in the current market. With inflated prices there is little buyer interest, and vendors are rushing to accept any offers they receive, rather than the more ideal situation where buyers are competing with each other for desirable properties.
Wilkins also said vendors are holding off selling during winter. “The good properties on the market just aren’t there,” he said.
CoreLogic data shows the stamp duty concessions for first-home buyers will have a bigger impact in regional areas of NSW than in Sydney.
Over the past twelve months, 45.4% of dwellings sold across NSW cost $650,000 or less, and 58% of dwellings were sold for $800,000 or less.
In Sydney, only 25.8% of real estate sales over the past twelve months were priced at $650,000 or less.
The proportions are also different between product types. In the past twelve months, 20.0% of Sydney houses sold for $650,000 or less, while unit sales were 33.5 per cent of all sales.