Auction Results May 20th 2017 Still Hot

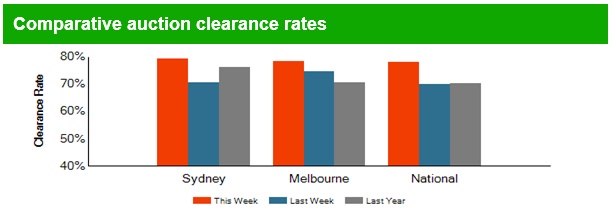
The preliminary results from Domain continue to show strong rates of clearance on good volume. No signs of the main Sydney and Melbourne markets faltering yet.

The national clearance rate was 77.6% compared with 73.9% last week, and 69% a year ago. The number sold was 1,314, higher than last week at 1,286 and last year 984.

Sydney cleared 76.9% with 512 sales, compared with 73.8% on 512 last week and 375 last year. Melbourne cleared 79.2% with 688 sales compared with 75.4% and 654 last week and 497 last year.

Brisbane cleared 62% of 110 scheduled auctions, Adelaide 70% of 86 scheduled auctions and Canberra 75% of 66 scheduled.

The Property Imperative Weekly – May 20th 2017

The latest edition of our weekly roundup of property, finance and economics review is available. We discuss the latest economic news, recent developments in the bank tax debate and the latest mortgage pricing and volume data.

Watch the video or read the transcript.

This week, the latest updates from the ABS showed that the trend unemployment rate stuck at 5.8%, thanks to a large rise in part-time employment. In fact, employment was up by a very strong 37,400 in April after increasing by a massive 60,000 in March but the total hours worked was reported to have fallen by 0.3% in April and was down by 0.1% over the past two months. This may be because of changes in the ABS sampling. Many commentators suggest the true position in worse, but we do know that unemployment was above 7% in South Australia, and the number of older people seeking work also rose.

The latest wages data, showed that the seasonally adjusted Wage Price Index rose 0.5 per cent in the March quarter 2017 and 1.9 per cent over the year, according to ABS figures. This makes a bit of a joke  of the strong wages growth rates predicated in the recent budget.

The seasonally adjusted, Wage Price Index has recorded quarterly wages growth in the range of 0.4 to 0.6 per cent for the last 12 quarters. However, private sector wages rose 1.8 per cent whilst public sector wages grew 2.4 per cent, so public servants are doing better than the rest of the population.

The pincer movement of higher inflation and lower wage growth now means that average wages are falling in real terms, especially for employees in the private sector.  Not good for those with mortgages as rates rise flow though. This aligns with our Mortgage Stress data.

There was further heated debate about the Bank levy, with the Treasurer saying on ABC Insiders that the impost was a permanent measure and linked to the strong profits and competitive advantage the big four have thanks to the “too-big-to-fail” implicit guarantee from the government. He again said the costs of the tax should not be passed on to customers.

On the other hand, the banks put their own slant on the issue, saying that the costs would be passed on, and the levy was bad policy. Ex Treasury Boss Ken Henry, now the Chairman of NAB, suggested there should be an inquiry into the proposed tax and said it looked like something from the eighties, before all the free market reform.

The banks made submissions to the Treasury complaining about the short timeframes, and seeking a delay in implementation.  ANZ suggested a delay till September 2017 to allow sufficient time for design of the legislation and also recommended the tax should be applied to the domestic liabilities of all banks operating in Australia with global liabilities above $100 billion. They concluded “There is no ‘magic pudding’. The cost of any new tax is ultimately borne by shareholders, borrowers, depositors, and employees”.

But the real debate should be framed by the excess profits the big banks make, and the unequal position the big four have thanks to the implicit government guarantee, meaning they can out compete regional and smaller lenders. In fact, the value of this subsidy is significantly higher than the 6 basis points being imposed. These are the very high stakes in play, and the outcome will significantly impact the future shape of banking in Australia.  In fact, you could argue the big four receive the largest subsidies of any industry in the country – way more than, for example, the entire car industry.

In addition, the Australian Bankers Association is caught trying to represent the interest of the big four, and other regional players, including some who have supported the tax on the basis of it helping to level the competitive landscape. The ABA issued a statement to say there was no division, but there clearly is. Not pretty. Some have suggested the smaller players should create their own separate lobby group.

The latest lending data from the ABS showed that the mix of lending is still too biased towards unproductive home lending, at the expense of lending for commercial purposes. Overall trend finance flow in trend terms rose 1.3% to $70 billion, up $691 million. The total value of owner occupied housing commitments excluding alterations and additions rose 0.1% in trend terms, to $20.1 billion, up $26 million. Within the fixed commercial lending category, lending for investment housing fell 0.3%, down $44 million to $13.2 billion, whilst lending for other commercial purposes fell 2%, down $416 million to $20.3 billion. 39% of fixed commercial lending was for investment housing and this continues to climb.  Most of the investment in housing was in Sydney and Melbourne.

The more detailed housing finance data showed that the number of owner occupied first time buyers rose in March by 20.5% to 7,946 in original terms, a rise of 1,350.  In original terms, the number of first home buyer commitments as a percentage of total owner occupied housing finance commitments rose to 13.6% in March 2017 from 13.3% in February 2017.

The DFA surveys saw a small rise in first time buyers going to the investment sector for their first property purchase. Total first time buyers were up 12.3% to 12,756, still well below their peak from 2011 when they comprised more than 30% of all transactions. Many are being priced out or cannot get finance.

Lenders continued to tighten their underwriting standards for interest only loans, with CBA, for example, ending discounts, fee rebates and dropping the LVR to 80%, having in recent months imposed no less than three rate rises on the sector. ANZ tightened their lending parameters too, with the maximum interest only period reduced from 10 years to five years, tightening LVRs and imposing other restrictions.

Overall we think the supply of investor loans will reduce, and that smaller lenders and non-banks will not be able to meet the gap, so we are expecting loan growth to slow further, and the price of loans to rise again.

We also saw auction clearances stronger last weekend, so this confirms our survey results, that households still have an appetite for property, despite tighter lending conditions. Recent stock market falls and greater market volatility will play into the mix now, so we think there will be a tussle between demand for property, especially for investment purposes and supply of finance.

Brokers may well get caught in the cross-fire, and the recent UBS report suggesting that brokers are over-paid for what they do, will not help.  Others have argued UBS got their sums wrong, and denounced the report as “ridiculous”.

It is still too soon to know whether home price growth is really likely to turn, but the strong demand still evident in Sydney and Melbourne suggests momentum will continue for as long as credit is available at a reasonable price. So I would not write off the market yet!

And that’s it from the Property Imperative Weekly this time. Check back for next week’s summary.

The human face of Australia’s housing crisis

From The New Daily.

Chris Radford and Michelle Apostolopoulos are high school sweethearts. They met and fell in love at Northcote public school, which sits on the same main road that runs near both their parents’ fully paid off houses.

They both rent in Melbourne and are fast approaching the age their parents married, bought houses and started families. Repeating that feat in today’s market seems impossible.

Chris, 24, has spent the last six years of his life stacking shelves in a trendy inner-city supermarket, so he knows the price of avocados – that symbol of millennial decadence that is supposedly holding him back from property ownership.

“Four bucks, five bucks each. Yeah, I know how much they cost,” he says. “I don’t eat a lot of avocado to begin with.”

The couple, who plan to marry soon, are exactly who Treasurer Scott Morrison’s latest federal budget was supposed to help: hard-working, hard-saving Australians who want nothing more than a modest home to call their own.

Unlike their parents’ generation, the ‘Australian Dream’ seems to be getting further out of reach, what with rising prices, penalty rate cuts and record-low wage growth.

Chris pays $110 a week for a room in a house he shares with two friends in the Melbourne suburb of Moonee Ponds. When it rains, water drips through the ceiling into a strategically placed pot.

The house will soon be knocked down for apartments, so the landlord has given up on the place.

When his parents bought their house in Thornbury for $80,000 back in 1991 it was not much of a stretch for two people in their mid-20s. It is now worth at least $1 million, probably more.

Because of this enormous increase in value, buying even a more modest house today requires vastly more effort. Chris and Michelle, 23, estimate that a median-priced Melbourne home will require them to save a 20 per cent deposit of $150,000.

Even if they were to save every dollar they earn, it would still take them years to build that much – and that’s without taking price growth into account.

“It’s so unfair, two people should be able to save enough in a few years for a house!” Michelle says.

“Even if we saved hard I know we wouldn’t be able to afford within 32 kilometres of here.”

Part of the reason that saving is so hard for the couple is the new round of attacks on their pay.

Chris has worked his supermarket job all through high school and now into university. He works Sundays and has for years. He also works unpaid at an internship as part of his university degree, which requires him to work full-time on top of his part-time work.

This leaves him relying heavily on weekend penalty rates — which he’ll lose come July 1 because of a recent decision by the Fair Work Commission.

“If I didn’t have to work on Sunday, I wouldn’t,” he says.

Michelle, too, regularly works weekends. But because she works for one of Australia’s two main supermarkets, she’ll be lucky enough to keep her penalty rates.

“People who work weekends miss out on seeing family and friends,” she says.

“You deserve [penalty rates], you’ve busted your arse all weekend.”

They’re both disappointed the government didn’t do more in the budget to make things easier for low-paid workers and aspiring property buyers like themselves. Treasurer Morrison’s plan to allow first home buyers to tip up to $30,000 into their superannuation doesn’t excite them.

“When you really look at the details it starts looking practically impossible,” Michelle says.

“The government isn’t doing anything to make it easier to buy a house.”

To make matters even worse, with the university debt repayment threshold dropping, Chris and Michelle will both have to pay back more to the government each year.

“A lot of people think you’re not working hard enough if you can’t save a deposit. They just pick on young people because we can’t do anything about it,” she says.

“What are you supposed to do? Store everything in a cardboard box, then live in the cardboard box too?”

New $270 levy for WA investors

From The Real Estate Conversation.

The Real Estate Institute of Western Australia has called the government’s expected introduction of a $270 levy for property investors “short sighted” and “irresponsible”.

Details of the levy have not yet been formalised by the Government, but the REIWA understands the levy will be linked to water rates and will apply to properties with a gross rental value of $24,000 or more.

The levy is being considered as a means to raise cash for the troubled state budget.

REIWA Councillor Suzanne Brown said it was extremely disappointing the industry was not consulted about the speculated policy change, and said a levy will make property investment less attractive in Western Australia.

“The private rental market is crucial to the provision of rental accommodation in Western Australia,” she said. “This levy will only increase the cost of owning a rental property, and make it a less viable investment option.”

Brown said the property investment market in the state is already struggling in a weak economy.

“With vacancy rates sitting at an all-time high of 6.5 per cent, Western Australian investors are already doing it tough,” she said.

“Slapping them with an additional cost in an already soft market is a knee-jerk reaction that will do more harm than good,” said Brown.

“The government should be cautious of targeting property investors,” said Brown, as landlords may pass on the levy to tenants in the form of higher rents.

“Not only will it affect owners, but this has the potential to hit tenants if the cost of the levy is passed on,” she said.

“Housing affordability is already a significant concern in Western Australia. Applying additional costs to the property market is not the answer and will only exacerbate the issue,” Brown concluded.

Data confirms houses near jobs are too expensive

From The Conversation.

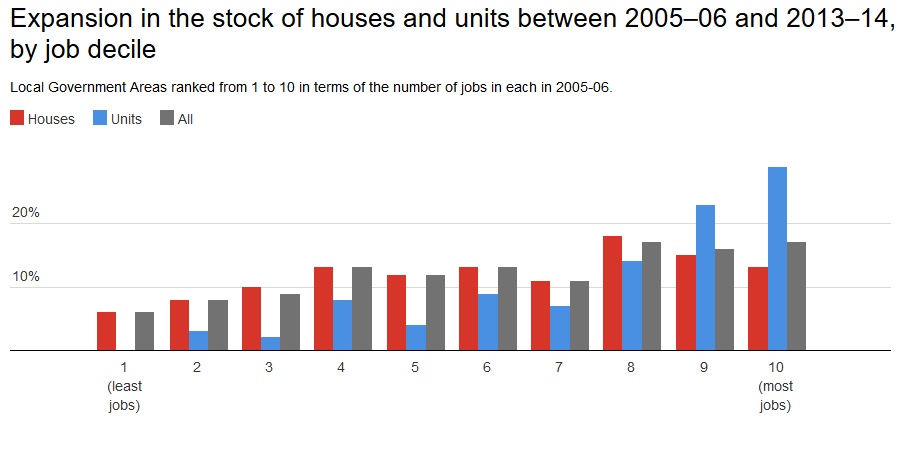
Australia’s capital cities are getting more and more units, that are largely concentrated and come with a hefty price tag, a new report shows. And while these areas also have lots of jobs, the high price for houses means many on low incomes won’t be able to access that employment.

Between 2006 and 2014, more than 50% of new units were built in the 20% of local government areas with the highest number of jobs.

When compared internationally, it would seem that Australian housing supply has not been as weak as is widely believed. However, the report points to some stark differences in housing supply patterns, emerging across Australia’s capital cities.

In Sydney, Perth and Brisbane, new housing supply has lagged slightly behind population growth. In the other capital cities, housing supply actually outpaced population growth between 2006 and 2014.

Housing supply and house prices

The issue of housing affordability has traditionally been pitched in terms of supply failing to keep pace with growing demand, and house prices rising in response to the imbalance.

Yet, house price inflation has surged even in metropolitan areas where housing supply exceeds population growth. The evidence suggests a complex relationship between supply, population growth and price that is shaped by both supply and demand-side factors.

As prices and rents rise, housing costs continue to eat up larger shares of household incomes, particularly in moderate and low-income groups.

The study shows 80% of new unit approvals were located in the top 20% of local government areas with the highest unit prices. This is while 80% of new house approvals were in the top 40% of local government areas with the highest house prices.

There is very little new supply in areas where house prices are lower, where households on low to moderate incomes can afford to live.

Affordable housing, cities and productivity

The lack of affordable housing in the vicinity of employment centres can pose threats to the productivity of our cities. If suburban residents are forced into longer commutes to access employment in the CBD, it can reduce productivity.

A potential consequence is that low-paid workers are deterred from seeking jobs in CBDs. This would then cause certain skills to become unavailable, and businesses to be less efficient, because they cannot quickly fill vacancies with suitable applicants.

Our data shows new units have grown by 30% in areas which have the most jobs, between 2005-06 and 2013-14. In contrast to this new units have only grown by 2.5% in areas with less jobs.

It would appear that unit approvals are concentrated in areas with abundant job opportunities. So productivity could improve, as congestion eases, and commute times lowered, if (and it’s a big if) these dwellings were affordable to those wishing to take advantage of these job opportunities.

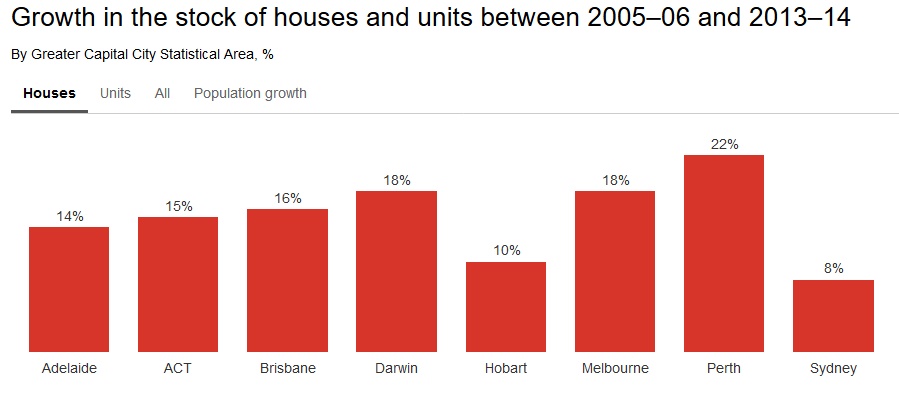
New housing supply has grown at a pace that matches population growth rates, at the national level. However, there is plenty of variation across the capital cities.

The strongest growth in the number of units has been in the territories (though this is from a low base), followed by Melbourne and Brisbane. However, the strongest growth in the number of houses has been in Perth, at around 22%.

Sydney has experienced much lower growth in its number of houses, at less than 10%. This reflects the very different patterns of development in the two cities.

In Perth, Brisbane and Sydney, increases in the supply of housing didn’t keep pace with population growth during, between 2006 and 2014. However, the drivers of this shortfall are varied.

Perth’s population grew very strongly over the period that we studied. The roughly one-quarter increase in population would stretch the capacity of most housing construction sectors.

However, even though Sydney’s population growth (at 14%) is below the average across all capital cities, its housing supply failed to match this growth. These outcomes highlight the different demand and supply side factors operating across states.

We currently have a national housing policy narrative that is dominated by a consensus view that higher levels of housing supply are the solution to housing affordability problems. While increased supply will always help take steam out of pressured markets, our study suggests a more nuanced approach is needed to the supply side, while not ignoring the demand side pressures.

It’s important that we identify those barriers to expanding affordable housing supply that have been impeded in the majority of our cities, especially for low income households.

Authors: Rachel Ong, Deputy Director, Bankwest Curtin Economics Centre, Curtin University; Christopher Phelps, Research assistant, Curtin University; Gavin Wood, Professor of Housing, RMIT University; Steven Rowley, Director, Australian Housing and Urban Research Institute, Curtin Research Centre, Curtin University

Why rent bidding apps will make the rental market even more unaffordable

From The Conversation.

Renters are already the weak party at the negotiating table because they cannot ignore their need for a place to live. But a new series of apps that pit renter against renter will only further tip the balance of power in favour of landlords, making it even harder to get a house.

The fierce competition in the rental market often results in renters paying more than is necessary. Over 150,000 tenants pay more than 50% of their incomes for housing.

These apps may seem like they give renters more power – they are marketed using words like “fairness” and “transparency”, but they also note that landlords are missing out on “millions and millions”.

Renting is a zero-sum game. Every dollar that a landlord gains is a dollar out of the tenant’s pocket. And in a market already tilted in favour of landlords, these apps could further push up rents.

To address the problem of renting affordability we need technologies that promote more cooperation between renters, rather than competition.

The apps

There are several different rent bidding apps, and they all work in different ways.

Live Offer asks prospective tenants to fill out forms and these are then ranked for the landlord to choose. The prospective tenants can see where they are in the rankings, in real time.

Rentberry is more of a real-time auction site. Prospective tenants submit bids, can see what the current highest bid is and how many bids there have been.

With Rentwolf, prospective tenants set up extensive profiles, as they would with AirBnB, and then apply for properties through the marketplace.

What is the right price?

Real estate is worth what people are prepared to pay for it. But tenants will always be the weak party at the negotiating table.

At least as far back as David Ricardo in 1817, economists have theorised that landlords take what is left over once other costs are deducted from the tenant’s income. In other words, rent is as much as tenants are able to pay.

Even before that, Adam Smith recognised that all real estate is a monopoly for landowners. This is because the supply of land is strictly limited, giving excessive negotiating power to whoever owns it.

But these apps overwhelmingly rely on auctions, which can itself be a problem due to what is called the “winner’s curse”.

Studies have shown that so long as there are at least two motivated bidders, the winning bid tends to either equal the value, or be one bid above it. In other words, the winning bidder in an auction will often overpay and will “suffer” for having won.

In the case of renters, this means paying excessive rents throughout the lease. Even worse, as more people bid similarly, the ruinous rents become accepted as normal. They become the market rent.

This same phenomenon has been shown in everything from jars of coins to oil-drilling rights and, yes, real estate.

Some research has further shown that in an auction the second-highest bid could be the “rational price”.

My own controlled experiments have shown that people are easily encouraged by necessity to bid excessively in auctions. This is despite full knowledge of the ruinous consequences.

This is because people have only a limited capacity to vary their needs. We all need to live somewhere, and our culture limits the options. If the option is sharing with relatives or accepting a lower standard of living due to high rents, then our sense of independence will often prompt our willingness to tighten our belts.

These rental apps will play into these stresses and uncertainties, making it more likely people will overbid in the auctions. This is why these rental apps are likely to result in higher rents.

How technology can reduce rents

Some time ago researchers suggested that renters might be able to reduce rents by banding together.

Working together, renters would be able to create the equivalent of there being only one buyer in the market – a monopsony. A monopsony works like a monopoly, but for buyers rather than sellers. For real estate rents, if land owners enjoy a natural monopoly-like advantage, then tenants have to behave like a monopsony to negate the power imbalance.

The current crop of rental apps do not address this imbalance. They only inform bidders as to what other, similarly stressed people, are bidding. It stresses them to bid higher.

Already, we are seeing the power of Facebook to build communities around renting. There are groups that help people find flatmates, for example. If the internet is to tackle the problem of renting affordability, then we need to extend this community, for renters to act in unison on rent.

Without a service that seeks to unite renters, rather than have them compete, housing affordability will only get worse. Rent bidding apps will increase landlord revenues and do so at the expense of tenants.

Fewer Buyers Results in Greater Months of Supply

From CoreLogic.

Based on the relationship between demonstrated housing demand and advertised stock levels we are seeing relatively more stock available for sale compared to demand for that stock across the capital cities at the moment.

The months of supply figure compares the number of unique properties advertised for sale to the number of transactions in the market.  The analysis provides unique insight into how long it should take to clear the volume of stock currently available for sale.  It is important to note that off-the-plan housing stock is typically not advertised for sale as individual properties and as a result is not included within this analysis.

Across the combined capital cities, there is currently 4.4 months’ worth of residential properties being advertised for sale.  As the first chart shows, the months of supply is currently higher at this point of the year than it has been each year since 2012.  The increasing months of supply is largely due to the slowing rate of transaction activity rather than a spike in properties available for sale, indicating demand has diminished relative to advertised supply levels which is pushing the figure higher.

Months of supply, combined capital cities

2017-05-15--image1

Sydney

There is currently 3.0 months of established housing supply available for sale across the city.  The city has seen consistently low months of supply over recent years however, the figure is currently at its highest level for this time of year since 2012.

2017-05-15--sydneyimg

Melbourne

Established housing stock currently sits at 4.2 months of supply for the city.  Supply levels remain quite low but are at their highest levels for this time of year in five years.

2017-05-15--melb

Auction Volumes Rebound

From CoreLogic.

Auction markets have remained resilient, with both volumes and the preliminary clearance rate rising week-on-week. The strong auction results add some complexity to speculation that the housing market is moving through its peak rate of growth.  At face value, auction markets are continuing to indicate continued strength in selling conditions across Sydney and Melbourne, however it’s harder to know whether vendors are adjusting their reserve pricing in order to clear their property. There were 2,376 auctions held across the cities this week, with a preliminary auction clearance rate of 76.2 per cent. Last week, a final clearance rate of 73.0 per cent was recorded across 1,689 auctions. Over the corresponding week last year, auction volumes were lower than this week, with 1,876 properties taken to auction and a clearance rate of 69.5 per cent. Melbourne had the highest number of auctions this week, with 1,092 properties going to market, with a lower preliminary rate of clearance week-on-week (76.8 per cent), however Sydney saw the largest increase in volumes over the week, with 938 auctions held across the city, increasing from last week’s 592.  Final auction clearance rates are published on Thursday and it will be important to monitor whether preliminary clearance rates undergo some revision as more data flows through.


Auction Results For Today

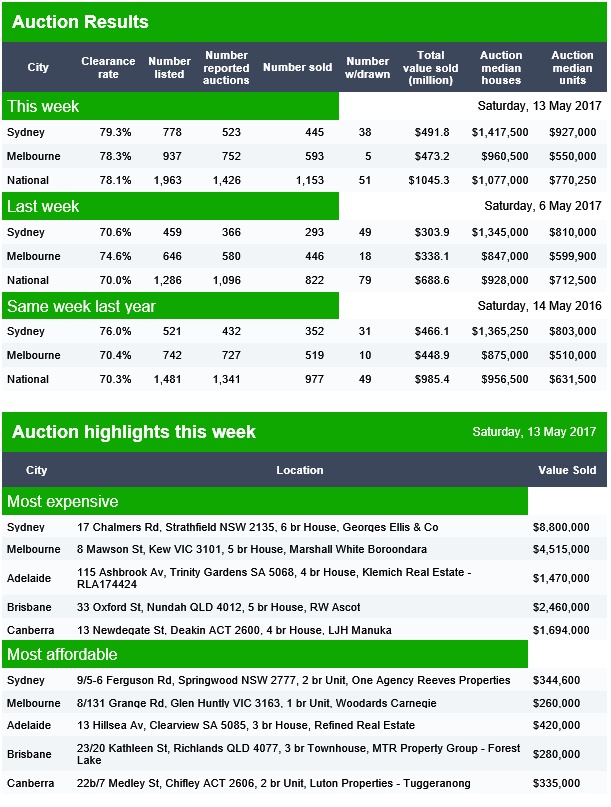
The preliminary auction results from Domain for 13th May 2017 show continuing momentum in the major markets of Melbourne and Sydney.

Melbourne sold 593 properties at a clearance rate of 78.1%, compared with 466 last week at 74.6%. Sydney sold 445 at a rate of 79.3% compared with 366 at 70.6% last week. Both higher than this time last year.

Nationally, 1,153 sold at a rate of 78.1%, compared with 822 at 74.6% last week and 977 at 70.3% last year.

Brisbane cleared 55% of 69 scheduled auctions, Adelaide 62% of 74 scheduled and Canberra 78% of 72 scheduled auctions. So no obvious signs of a serious fall in transactions at the moment.

From price to financial stability: Closing data gaps with regard to real estate markets

Prof Claudia Buch Vice-President of the Deutsche Bundesbank spoke about issues in Germany relating to property prices and financial stability. Sounds familiar, especially about the lack of good data!

One of the lessons of the global financial crisis has been that instabilities in markets for real estate can threaten financial stability. In contrast to price stability, there is no generally agreed metric for “financial stability”. Increases in real estate prices may indicate that risks to financial stability are building up. But other indicators, reflecting credit standards and the build-up of housing debt, need to be considered as well. These include the leverage of households, debt sustainability, amortisation requirements, and loan-to-value ratios.

Traditional statistics often do not reflect these indicators of financial instabilities. The G20 Data Gaps Initiative addresses this.

  • In its first phase, a Handbook on Residential Property Price Indices was published in 2013. With regard to residential property prices, the bulk of the conceptual work has been done, and the focus has shifted to compilation and dissemination. Quality adjustment remains a controversial topic and is still a major source of deviations across residential property price indices.
  • The initiative is currently in its second phase. Its main objective has shifted to implementing the regular collection and dissemination of reliable and timely statistics for policy use.

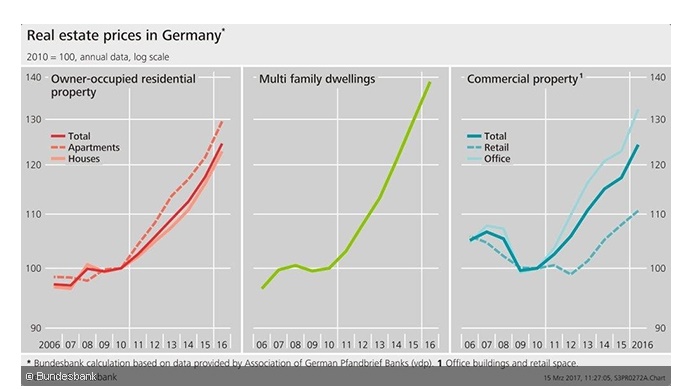
In Germany, prices of real estate property are available from several official and private providers. These indicators differ in terms of representativeness, periodicity, timeliness, breakdowns, and length of the time series. These data show that the prices of both residential and commercial property have risen considerably since 2010. Owner-occupied housing is currently about 25 per cent more expensive than in 2010, and prices for multi-family dwellings have increased by about 40 per cent. On average, commercial property prices have also increased by 25 per cent since 2010, driven mostly by prices for office space.

As regards commercial property prices, however, many conceptual issues still need to be clarified. For example, while office buildings, retail space, and industrial structures are classified as “commercial real estate”, the classification of multi-family dwellings is not clear and depends on whether one follows the perspective of users or investors. Data availability remains challenging, too. The number of transactions is lower than for residential real estate, and heterogeneity is more pronounced. In the absence of official data, analysts rely on private data provided by market observers.

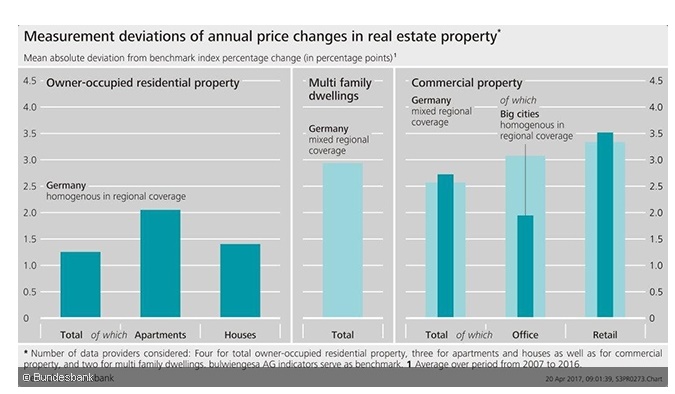
The figure below depicts deviations in the measurement across indicators for price changes in German property markets. With regard to residential property prices in Germany, analysts may consider four main indicators published by different data providers. In this case, they are confronted with measurement deviations of about 1 percentage point for the annual price change of the total market on average (left-hand column). For office and retail space, the mean absolute deviation is considerably larger at 2½ percentage points. This is one of the underlying challenges of assessing such data.

Given that real estate prices have increased strongly, are risks to financial stability building up? Two issues need to be considered.

First, changes in prices need to be compared to changes in fundamentals such as income expectations, demographics, and the macroeconomic environment. These factors may indeed explain a significant share of the price increases in Germany. But there is still an unexplained component, and that component seems to have increased over time.

Second, risks to financial stability emerge if a strong rise in real estate prices coincides with a strong expansion in credit volumes and an easing of credit standards. The house price momentum has caused credit growth, too, to accelerate since the beginning of the upswing on the German property market. Housing credit to households increased by 3.7 per cent in 2016. This is lower than the long-run average: since the early 1980s, the growth rate of housing credit has been about 5 per cent annually.

It is important to note that Germany currently has no consistent reporting on credit standards, eg the loan-to-value ratio or the debt service-to-income ratio.

The relevance of and urgent need for progress in the measurement of real estate prices is widely acknowledged. I am looking forward to the contributions that will be presented at this conference and encourage the statistical community to push ahead with this strand of research and practical implementation