NZ Reserve Bank Consults On DTI Restrictions

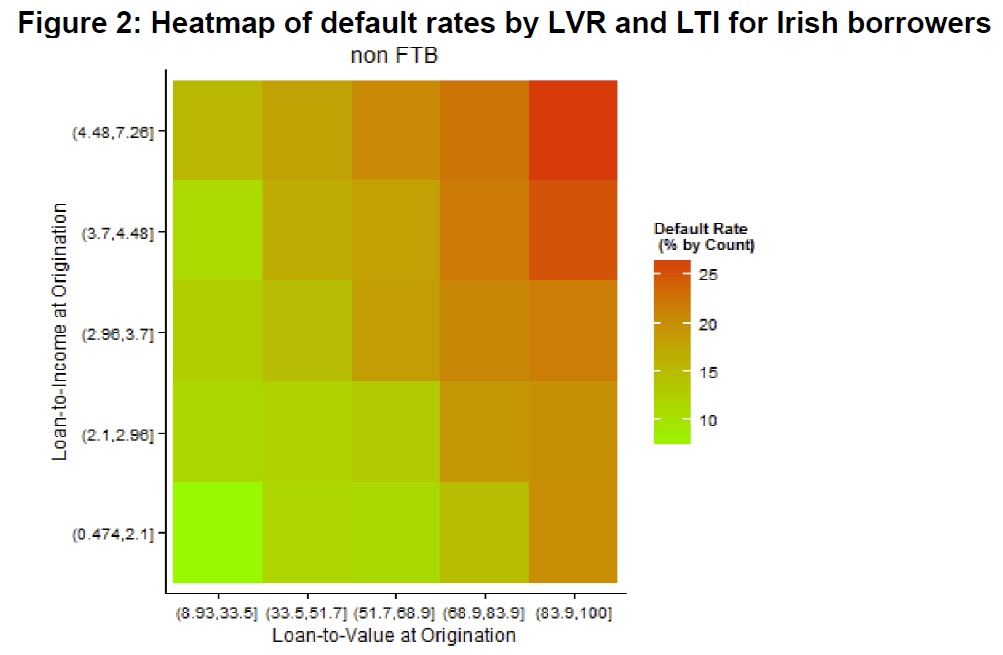
The NZ Reserve Bank has released its consultation paper on possible DTI restrictions. The 36+ page report is worth reading as it sets out the risks ensuring from high risk lending, leveraging experience from countries such as Ireland.

Interestingly they build a cost benefit analysis, trading off a reduction in the costs of a housing and financial crisis with a reduction in the near-term level of economic activity as a result of the DTI initiative and the cost to some potential homebuyers of having to delay their house purchase.

Submissions on this Consultation Paper are due by 18 August 2017.

In 2013, the Reserve Bank introduced macroprudential policy measures in the form of loan to-value ratio (LVR) restrictions to mitigate the risks to financial system stability posed by a growing proportion of residential mortgage loans with high LVRs (i.e. low deposit or low equity loans). This increase in borrower leverage had gone hand-in-hand with significant increases in house prices, particularly in Auckland. The Reserve Bank’s concern was the possibility of a sharp fall in house prices, in adverse economic circumstances where some borrowers had trouble servicing loans. Such an event had the potential to undermine bank asset quality given the limited equity held by some borrowers.

The Reserve Bank believes LVR restrictions have been effective in reducing the risk to financial system stability that can arise due to a build-up of highly-leveraged housing loans on bank balance sheets. However, LVRs relate mainly to one dimension of housing loan risk. The other key component of risk relates to the borrower’s capacity to service a loan, one measure of which is the debt-to-income ratio (DTI). All else equal, high DTI ratios increase the probability of loan defaults in the event of a sharp rise in interest rates or a negative shock to borrowers’ incomes. As a rule, borrowers with high DTIs will have less ability to deal with these events than those who borrow at more moderate DTIs. Even if they avoid default, their actions (e.g. selling properties because they are having difficulty servicing their mortgage) can increase the risk and potential severity of a housing related economic crisis.

While the full macroprudential framework will be reviewed in 2018, the Reserve Bank has elected to consult the public prior to the review. This consultation concerns the potential value of a policy instrument that could be used to limit the extent to which banks are able to provide loans to borrowers that are a high multiple of the borrower’s income (a DTI limit). A number of other countries have introduced DTI limits in recent years, often in association with LVR restrictions. In 2013, the Bank and the Minister of Finance agreed that direct, cyclical controls of this sort would not be imposed without the tool being listed in the Memorandum of Understanding on Macroprudential Policy (the MoU). Hence, cyclical DTI limits will only be possible in the future if an amended MoU is agreed.

The purpose of this consultation is for the Reserve Bank, Treasury and the Minister of Finance to gather feedback from the public on the prospect of including DTI limits in the Reserve Bank’s macroprudential toolkit.

Throughout the remainder of the document we have listed a number of questions, but feedback can cover other relevant issues. Information provided will be used by the Reserve Bank and Treasury in discussing the potential amendment of the MoU with the Minister of Finance. We present evidence that a DTI limit would reduce credit growth during the upswing and reduce the risk of a significant rise in mortgage defaults during a subsequent severe economic downturn. A DTI limit could also reduce the severity of the decline in house prices and economic growth in that severe downturn (since fewer households would be forced to sharply constrain their consumption or sell their house, even if they avoided actual default). The strongest evidence that these channels could materially worsen an economic downturn tends to come from countries that have experienced a housing crisis in recent history (including the UK and Ireland). The Reserve Bank believes that the use of DTI limits in appropriate circumstances would contribute to financial system resilience in several ways:

– By reducing household financial distress in adverse economic circumstances, including those involving a sharp fall in house prices;
– by reducing the magnitude of the economic downturn, which would otherwise serve to weaken bank loan portfolios (including in sectors broader than just housing); and
– by helping to constrain the credit-asset price cycle in a manner that most other macroprudential tools would not, thereby assisting in alleviating the build-up in risk accompanying such cycles.

The policy would not eliminate the need for lenders and borrowers to undertake their own due diligence in determining that the scale and terms of a mortgage are suitable for a particular borrower. The focus would be systemic: on reducing the risk of the overall mortgage and housing markets becoming dysfunctional in a severe downturn, rather than attempting to protect individual borrowers. The consultation paper notes that DTIs on loans to New Zealand borrowers have risen sharply over the past 30 or so years, with further increases evident since 2014. This partly
reflects the downward trend in interest rates over the period. However, interest rates may rise in the future. While the Reserve Bank is continuing to work with banks to improve this data, the available data also show that average DTIs in New Zealand are quite high on an international basis, as are New Zealand house prices relative to incomes.

Other policies (such as boosting required capital buffers for banks, or tightening LVR restrictions further) could be used to target the risks created by high-DTI lending. The Bank does not rule out these alternative policies (indeed, we are currently undertaking a broader review of capital requirements in New Zealand) but consider that they would not target our concerns around mortgage lending as directly or effectively. For example, while higher capital buffers would provide banks with more capacity to withstand elevated housing loan defaults, they would do little to mitigate the feedback effects between falling house prices, forced sales and economic stress.

The Reserve Bank has stated that it would not employ a DTI limit today if the tool was already in the MoU (especially given recent evidence of a cooling in the housing market and borrower activity), it believes a DTI instrument could be the best tool to employ if house prices prove resurgent and if the resurgence is accompanied by further substantial volumes of high DTI lending by the banking system. The Reserve Bank considers that the current global environment, with low interest rates expected in many countries over the next few years, tends to exacerbate the risk of asset price cycles arising from ‘search for yield’ behaviour, making the potential value of a DTI tool greater.

The exact nature of any limit applied would depend on the circumstances and further policy development. However, the Reserve Bank’s current thinking is that the policy would take a similar form to LVR restrictions. This would involve the use of a “speed limit”, under which banks would still be permitted to undertake a proportion of loans at DTIs above the chosen threshold. By adopting a speed limit approach, rather than imposing strict limits on DTI ratios, there would be less risk of moral hazard issues arising from a particular ratio being seen as “officially safe”. Exemptions similar to those available within the LVR restriction policy would also be likely to apply.


Three looming changes all investors must prepare for

From MPA.

What type of property will be in strong demand in the future?

Now that’s a good question for property investors to ponder, because the way we live and where and how we live is evolving.

It wasn’t all that long ago that buying a house and land in the suburbs was considered an indisputable truism of property investing. Investing in a house on a large block was considered ‘safe as houses’ (pardon the pun), and still today you’ll hear investors talk about a property asset’s value being “all in the land”.

But what was accurate only a decade or two ago is now becoming less so, particularly when it comes to real estate. For instance, while it is true that a house will depreciate in value while the land appreciates, that doesn’t mean apartments and units make terrible investments.

That’s because apartments also have an articulable land value underneath them.

And in certain markets an apartment investment makes much more investment sense than a freestanding home. This is because demographics – or the composition of Australian households – is evolving.

More of us are now trading a backyard for a courtyard or balcony due to a range of factors, including shifting family dynamics, increasing divorce rates and a growing tendency towards single-person households.

This scratches at the surface of the many evolutions that investors must prepare for if they want to enjoy long-term success in real estate. These changes include:

  1. Our demographics are changing

In my mind our changing demographics will have more influence on the long-term performance of our property markets than the short-term influences of interest rates, bank lending policies or supply and demand.

It’s no secret that our nation is ageing, but the latest Australian Intergenerational Report reveals the significance and depth of this trend, forecasting that by 2055 the number of people aged over 65 will double.

Perhaps a bigger threat is that over the same time the ratio of people in the workforce compared to retirees will almost halve, from 4.5:1 to 2.7:1, as the baby boomers retire. In the 1970s, it was 7.5:1. This means the government will have to keep migration levels high to top up our workforce.

Another critical demographic trend is the Australian Bureau of Statistics forecast that lone-person households will see the most rapid increase of all household types — up by 65% in the next 25 years.

That means there will be about 3.4 million people living on their own, and most of these people will still want to live close to the big cities.

Let’s turn our attention back to that big house on the big block – the one that was as ‘safe as houses’.

In light of these demographic changes, how does that type of property stack up as likely to be in strong demand in the future?

  1. The economy is changing

The mining building boom is well and truly over, and we’re becoming less of a manufacturing country.

In the future our economy will be driven by services, IT and education, which means the economic centres of growth – which will translate to wages growth and the ability to pay more for properties – will be

in our capital cities and, in particular, locations close to the CBD in our three east coast capital cities.

Furthermore, with so many Australians exiting the workforce as baby boomers retire, the government will need to address the issue of skill shortages somehow, so, as I said, it’s likely that migration of skilled workers will only increase in the future.

  1. Our property markets are changing

Owing to the factors outlined above, the Australian property market is expected to experience increasing fragmentation, with the disparity between capital growth in cities and regional areas (and even within cities as the population grows) widening further.

Properties situated closer to the CBD, where robust economic activity, jobs and lifestyle amenities are easily accessible, will increase in value at a disproportionately higher rate than dwellings in the outer suburbs.

At the same time, there will be increased demand for apartments and townhouses as we’ll have more one- and two-person households edging out the stereotypical ‘husband, wife and two kids’ household structure.

What’s more, to cope with forecast population growth – which is tipped to almost double to around 40 million by 2055 – the Master Builders Association of Australia estimates we will need to build nine million new homes over the next 40 years.

This significant population growth will lead to a number of social issues and infrastructure challenges, and the consequential impact on Australia’s property market shouldn’t be underestimated.

Ultimately, there will always be a requirement for detached houses, but it’s becoming evident that there will also be increasing demand for medium-density and high-density apartments as retiring baby boomers trade their backyards for courtyards or balconies.

For property investors, the key to success is adopting a long-term view by seeking out properties that will be in continuous strong demand now, in the next decade, and 40 years from now.

Mortgage Stress Accelerates Further In May

Digital Finance Analytics has released mortgage stress and default modelling for Australian mortgage borrowers, to end May 2017.  Across the nation, more than 794,000 households are now in mortgage stress (last month 767,000) with 30,000 of these in severe stress. This equates to 24.8% of households, up from 23.4% last month. We also estimate that nearly 55,000 households risk default in the next 12 months.

The main drivers are rising mortgage rates and living costs whilst real incomes continue to fall and underemployment is on the rise.  This is a deadly combination and is touching households across the country,  not just in the mortgage belts.

This analysis uses our core market model which combines information from our 52,000 household surveys, public data from the RBA, ABS and APRA; and private data from lenders and aggregators. The data is current to end May 2017.

We analyse household cash flow based on real incomes, outgoings and mortgage repayments. Households are “stressed” when income does not cover ongoing costs, rather than identifying a set proportion of income, (such as 30%) going on the mortgage.

Those households in mild stress have little leeway in their cash flows, whereas those in severe stress are unable to meet repayments from current income. In both cases, households manage this deficit by cutting back on spending, putting more on credit cards and seeking to refinance, restructure or sell their home.  Those in severe stress are more likely to be seeking hardship assistance and are often forced to sell.

Martin North, Principal of Digital Finance Analytics said “Mortgage stress continues to rise as households experience rising living costs, higher mortgage rates and flat incomes. Risk of default is rising in areas of the country where underemployment, and unemployment are also rising. Expected future mortgage rate rises will add further pressure on households”.

“Stressed households are less likely to spend at the shops, which acts as a drag anchor on future growth. The number of households impacted are economically significant, especially as household debt continues to climb to new record levels. The latest housing debt to income ratio is at a record 188.7* so households will remain under pressure.”

“Analysis across our household segments highlights that stress is touching more affluent groups as well as those in traditional mortgage belts”.

*RBA E2 Household Finances – Selected Ratios Dec 2016.

Regional analysis shows that NSW has 216,836 (211,000 last month) households in stress, VIC 217,000 (209,000), QLD 145,970 (139,000) and WA 119,690 (109,000). The probability of default has also risen, with more than 10,000 in WA, 10,000 in QLD, 13,000 in VIC and 15,000 in NSW.

Probability of default extends the mortgage stress analysis by overlaying economic indicators such as employment, future wage growth and cpi changes.  Regional analysis is included in the table below.

Are first home buyers locked out of housing?

According to UBS, first time buyers are pretty much locked out of the property market. ‘Typical’ first home buyers are facing ~11 years to save; and ~40 years in Sydney!

Housing affordability is extreme as house price-income surged to a record 6.5x

UBS already ‘called the top’ of housing, with a key reason being that affordability is stretched, as the house price-income ratio surged to a record high of 6.5x, up sharply from 4.5x in 2012 (& >doubling from 3x in 1996). While interest rates have fallen to a record low, the mortgage repayment share of income still lifted to a near decade high, & the key issue for first home buyers (FHBs) is the ‘deposit gap’ even before buying.

‘Typical’ first home buyers facing ~11 years to save; and ~40 years in Sydney

UBS have now created a new and dynamic interactive model to estimate how long it would take a FHB to save a deposit to buy a home (click here for the model). The findings are confronting. We estimate a ‘base case’ scenario for a ‘typical’ FHB would take ~11 years to save for a home based on assumptions including: 1) a 10% deposit is required; 2) individual income is AWOTE of ~$80k per year; 3) saving rate is 5% of gross income (i.e. $4k per year); 4) home price today is $400k (~average FHB price); 5) home prices grow in line with household income ahead at 3% per year. However, given recent macroprudential tightening including for high-LVR loans, if we instead assume a 20% deposit is now required, then the time to save more than doubles (due to compounding) to ~24 years. Alternatively, saving a 10% deposit to buy at the average Sydney house price of $1.2mn would take an incredible ~40 years to save.

If house price vs income growth repeats, FHBs likely never can save enough Importantly, the key driver of time to save is house price growth vs income.

In the last 5 years, house price growth averaged 7%, but income only 4%. If this were to be repeated ahead, a FHB would likely never be able to save a 10% deposit – unless they were given (at least part of) the deposit (i.e. from the ‘bank of mum and dad’). Note that due to the frequent changes of Government policy on housing incentives/taxes (& other costs), our model purposely excludes these factors. However, they can be input to the model directly by the user by adjusting the required deposit or purchase price. For instance, the recent FHB super saver scheme potentially reduces the required time by up to several years (contributions are capped at $15k/year and $30k in total).

Preliminary clearance rate holds above 70% as the number of auctions held slips lower

Confirming the Domain data we reported on Saturday, CoreLogic says the first week of winter saw auction volumes fall, with 2,545 homes taken to auction, compared to 2,885 the previous week.

The preliminary clearance rate across the combined capital cities was higher (73.9 per cent) compared with last week’s finalised result, which was the third lowest clearance rate so far this year (71.3 per cent). With auction clearance rates typically revising lower as more results flow through, the final clearance rate is likely to be lower than what was recorded last week.  At the same time last year, both the combined capital city clearance rate and the number of auctions were lower, with 2,008 auctions held and 68.2 per cent reported as successful. The two largest auction markets, Melbourne and Sydney, saw their preliminary clearance rates rise compared with last weeks finalised results, with Sydney at 77.5 per cent and Melbourne at 75.4 per cent. Across the smaller capital city markets, week-on-week results show mixed results with clearance rates falling in Brisbane and Canberra.

Government may water down private super borrowing restrictions

From The NewDaily.

The Turnbull government has taken planned restrictions to borrowing by self-managed superannuation funds off the agenda in the short-term in a move that may presage a weakening of the proposals.

Under a plan announced in April, debt on the books of SMSFs would be added to fund values when calculating the new $1.6 million limits for tax-free super pensions.

The move was designed to stop people effectively getting around the cap by using borrowings to reduce asset values and paying the debts off over time.

The initial consultation period for the move expired on May 3 but the government has opened discussions again with the superannuation industry.

A spokesperson for acting Financial Services and Revenue Minister Mathias Cormann said: “Following stakeholder feedback, the government will consult further with stakeholders on the proposal to add the outstanding balance of a limited recourse borrowing arrangement (LRBA) to a member’s total superannuation balance measure in conjunction with consultation on the non-arm’s length income integrity measure announced in the 2017-18 budget.”

The SMSF industry has kicked back on the moves, saying they may force some investors to sell properties because they won’t be able to make extra non-concessional contributions to their fund needed for debt repayments once it has hit the $1.6 million limit.

“Some self-managed funds may not be able to use limited recourse borrowing arrangements if they will be relying on non-concessional contributions to repay some or all of the loan interest and capital because the gross value of the asset(s) will take them over the $1.6 million total superannuation balance and they will be unable to make further non-concessional contributions to service the debt,” the SMSF owners alliance said in a submission on the issue to Treasury.

The opposition has not expressed a view on the legislation, saying instead it would like to ban SMSF’s borrowing altogether.

“Labor has previously stated that we will restore the general ban on direct borrowing by superannuation funds, as recommended by the 2014 Financial Systems Inquiry, to help cool an overheated housing market partly driven by wealthy Self-Managed Super Funds,” a spokesman for Labor’s shadow Financial Services Minister Katy Gallagher said in response to questions from The New Daily. 

“This has seen an explosion in borrowing from $2.5 billion in 2012 to more than $24 billion today.” 

Stephen Anthony, chief economist for Industry Super Australia, said there was an argument for leaving out existing arrangements from the changes.

“I’d be happy to see transition arrangements put in place and allowing the restrictions to apply to arrangements from here on in,” he said.

“But if the outcome of the consultation is just to water down what I see as a useful structural reform, I’d be very disappointed.”

The industry fears that introducing the new restrictions to existing arrangements would mean some SMSF owners would be forced to sell properties held in their funds because they would not be able to make loan repayments.

The explosion of SMSF property debt has been a concern for regulators, with the Murray inquiry into the financial system in 2014 recommending SMSF borrowing be banned, warning “further growth in superannuation funds’ direct borrowing would, over time, increase risk in the financial system”.

The Reserve Bank concurred.

Auctions – High Clearance Rate On Lower Volumes Today

The preliminary results from Domain are out and show continuation of trend with high clearance rates, but on lower volumes.

Sydney cleared 74.3% compared with 70.6% last week, with 445 sold. Melbourne cleared 75.9% compared with 73% last week, with 602 sold, and nationally, 74.2% or 1,139 sold compared with 70.1% 1,423.

Brisbane cleared 50% of 104 scheduled auctions, Adelaide 73% of 74 scheduled and Canberra 73% of 65 scheduled auctions.

The Great Rotation – The Property Imperative Weekly 3rd June

The great rotation is well underway as investors vote with their feet whilst first time buyers are getting greater incentives to buy into the market at its peak. Welcome to the Property Imperative Weekly for 3rd June 2017.

In this weeks review we look at changes to mortgage interest rates, new first time buyer incentives and new findings from our core market model, freshly updated to end of May.

We saw a litany of rate hikes during the week, and other changes to lending conditions. On Monday NAB reduced the maximum LVR for interest only loans from 95% to 80% for both owner occupied and investor purchasers.  They also reduced the LVR for construction loans to 90%.

On Tuesday, AMP bank lifted its variable interest rate for owner occupied loans by 28 basis points and the bank also hiked fixed rates for owner-occupied and investment interest-only loans by 20 basis points. They dropped the maximum loan-to-value ratio for interest-only loans from 90 per cent to 80 per cent. On the other hand, fixed rates for owner-occupied principal and interest loans have decreased by 10 basis points.

On the same day Westpac reduced the LVR for new and existing interest only loans to 80%, across the board including both owner occupied and investment loans. They also said they would no longer accept new standalone refinance applications from external providers. But they waived the switching fees for borrowers who wanted to shift from interest only to principal and interest loans.

On Wednesday NAB offered new white label principal and interest mortgages through its Advantedge wholesale funder, with a maximum LVR of 80%, including at 4.24% loans to residential investors.

On Thursday, Teachers Mutual brought out a new hybrid combination mortgage, which limits the amount of the loan which can be interest only.  They also increased the interest only loan rate by 40 basis points.

And on Friday, Bank West, the CBA subsidiary announced a new LVR band at 95% plus, with a mortgage rate of 5.29%, up by three quarters of a percent. Other lending will be capped at 95% LVR.

So mortgage rates continue to rise, especially for interest only loans, and investors; and underwriting standards continue to tighten.  Many households will see their repayments rise, again, despite no change in the RBA cash rate, so adding to their financial stress.

This week we got the April lending data from the RBA and APRA. The Reserve Bank said housing lending rose 0.5% in the month, or 6.5% over the past year to $1.66 trillion dollars. Within this, owner occupied loans rose 0.55% whilst investment loans grew 0.36%, and another $1.1 billion were reclassified by the banks, making a total of $52 billion which is nearly 10% of the investment loan book. This ongoing switching should be concerning the regulators because it means that either the bank data is just wrong, or borrowers are deciding to switch an investment loan to an owner occupied loan to get a lower rate, but we wonder what checks are being done when this occurs.

The proportion of lending to productive business fell again, so housing lending is still dominating the scene to the detriment of the broader economy and sustainable long term growth.

APRA showed that the banks lifted their investor loans by $2.1 billion in April though all the majors are well below the 10% speed limit. The quarterly property exposures showed a fall in higher LVR lending, but interest only loans still well above the 30% threshold APRA set. But weirdly APRA warned that we should not use these statistics to access the impact of their latest moves, because the reported data is based on approved loans, whereas their measure is on funded loans. So plenty of wriggle room and more fog around the data.

Talking of wriggling, Wayne Byres gave evidence to the Senate Economics Legislation Committee and under sustained questioning said alarm bells were ringing on home prices and that we had entered a high risk phase.  It is worth watching the video of the session, which is linked on the DFA Blog.  The regulators continue to be coy about the issue, which by the way is confronting many other countries too. The truth is the financialisation of property is the root cause of the property bubbles around the world, and it will be very hard to tame. Australia is not the only country with a bubble.

Amid all this mayhem, and with bank stocks under pressure relative to the rest of the market, New South Wales released their housing affordability plan. NSW has perpetuated the “quick fix” approach to housing affordability, alongside taxing foreign investors harder and making changes to planning. The removal of stamp duty concessions to property investors may slow that sector, but the fundamental issue is that supply is not the problem many claim it to be.

First time buyers are potentially able to get up to $34,360, but we think this will just push prices higher. The new arrangements start 1 July, so we expect a slow June. With the enhanced incentives in Victoria and Queensland also coming on stream, we are expecting a pick-up in first time buyer demand as investor appetite slows. Our latest surveys show this rotating trend, and we will publish the detailed finding over the next few days. But already we see some investors are selling, to lock in capital growth, and some first time buyers have renewed their search to buy, on the back of the new incentives, and greater supply.

Meantime there was further evidence that property prices are indeed drifting lower . According to CoreLogic’s Home Value Index they fell in Sydney and Melbourne over the month of May, by 1.3% and 1.7% respectively.  It is becoming increasingly clear the momentum is easing, so it now is a question of how far it eases down, and whether prices go sideways, or fall significantly.

We expect mortgage rates to continue to rise. ANZ said their new APRA risk weight for mortgages was now 28.5%, which was at the top end of expectations.  But whilst this is higher than the sub-20 lows, it is still significantly lower than the regional banks capital weights, and even allowing for the bank tax, they remain at a capital disadvantage.  We think APRA will lift capital weights further down the track, and when we take account of expected US rate rises also, mortgage rates will continue to climb. This feeds into, and reinforces the potential slide in prices. Whilst first time buyers may take up some of the slack, we think the market dynamic is morphing into something rather ugly.

And that’s the latest Property Imperative Weekly. Check back next week for the latest installment.

Tales Of The Pilbara Property Bust

The West Australian featured a story of two brothers who rode the wave of the Pilbara property boom to become multimillionaires but who are now facing a potential financial headache, with a bank foreclosing on part of their property portfolio after they allegedly failed to pay their mortgages.

At the height of the Pilbara property peak in 2012, rental prices in Port Hedland were nearing $2600 a week on average, while the median house price was upwards of $1.2 million, according to Pilbara Development Commission figures.

Property prices in Karratha and Port Hedland have fallen dramatically over the past five years, with Landgate records showing the Crawfords have sold property for hundreds of thousands of dollars less than the buying price.

Ryan and Morgan Crawford claimed to have made millions of dollars from investments in Pilbara towns when property and rent prices reached astronomical levels during the mining boom.

But in a spectacular example of the Pilbara property crash, part of the Crawford property empire has been sold for a fraction of the buying price, according to Landgate records, with documents filed in the Supreme Court last week revealing the proceeds fell well short of what was owed.

The ANZ Bank wants to repossess one property owned by Ryan Crawford, and has demanded the balance of the outstanding debt, plus interest and costs.

In total, the brothers and former colleague Mark Pages-Oliver borrowed more than $5.5 million from ANZ in four years.

Ryan Crawford, who described himself on social media as “an active entrepreneur” who rose “to the rank’s of the State’s 1 per cent” of personal property investors, at one time claimed to have a portfolio valued at $35 million.


Australia isn’t the only country caught in a housing bubble

Property bubbles have been created by a combination of ultra-low interest rates, easy lending, rapid population growth, and an openness to foreign investment. Underlying it all is the financialisation of property.

From The NewDaily.

It’s only natural for Australians to be obsessed with our own property market woes, but there is a whole world of bubbles out there waiting to be popped.

We chatter endlessly about prices in Sydney and Melbourne, which is unfair to the other capital cities. But it’s understandable, as 57 per cent of the nation lives in Victoria and New South Wales, according to Australia’s statistics bureau.

And we’re right to be concerned. Only this week, Citigroup chief economist Willem Buiter said Australia is in the midst of a “spectacular housing bubble”. He joined a great host of experts worried that our two main property markets have been running way too hot.

The numbers back him up. CoreLogic, one of our most widely cited property pricers, says Australian houses now cost 7.2 times the yearly income of a household, up from 4.2 times income 15 years ago.

Between the global financial crisis and February 2017, median dwelling prices almost doubled (+99.4 per cent) in Sydney, bringing them to $850,000, and in Melbourne (+85 per cent to $640,000), according to CoreLogic.

But we should not delude ourselves that a housing crisis is a uniquely Australian phenomenon. Cries of “Bubble!” are ringing out across the globe.

Sweden’s central bank boss Stefan Ingves this week issued a warning about sky-rocketing household debt and soaring property prices. Sound familiar?

In Switzerland, the cities of Zurich, Zug, Lucerne, Basel, Lausanne and Lugano face similar risks.

Then there’s Ottawa, Vancouver and Toronto in Canada – an economy comparable in size and composition to our own. As it has for Australia, the International Monetary Fund has told the Canadian government to intervene or risk an economic crash.

The International Monetary Fund (IMF) has issued similar warnings for Denmark, which is battling soaring prices in the capital of Copenhagen.

Most important of all is China. Prices rose 22.1 per cent in Beijing, 21.1 per cent in Shanghai and 13.5 per cent in Shenzen between March 2016 and March 2017, CNBC reported.

The warnings are familiar. “If young people lose hope, the economy will suffer, as housing is a necessity,” Renmin University president Wu Xiaoqiu said recently.

The difference is, if the Chinese economy crashes because of a housing market correction, it will echo throughout the world.

Hong Kong is fighting bubbles, too. Reports on its property market are full of “handsome gains” and an impending “burst“.

Closer to home is Auckland in New Zealand, where prices have also doubled since the GFC.

Despite Brexit, the mother country is hurting, too. There are periodic predictions that London will “finally burst” after years of rampant price growth.

So what’s going on? The consensus is that these bubbles have been created by a combination of ultra-low interest rates, easy lending, rapid population growth, and an openness to foreign investment.

Saul Eslake, a renowned Australian economist, told The New Daily there are “common factors” across these affected nations, including immigration. But he cautioned against shutting the borders.

“It’s wrong, it’s factually incorrect to deny that immigration has contributed to rising house prices. It has contributed to it. But I would argue that to respond to it by, as Tony Abbott among others has advocated, cutting immigration would be the wrong approach.”

Dr Ashton De Silva, a property market expert at RMIT University, also blamed demographic change across the globe.

However, Dr De Silva said each country’s unique factors should not be ignored.

“The fact that it’s happening the world over is important to note because there are many countries going through a very similar cycle, such as China,” he said.

“However, whilst we can take this overarching view, we need to be mindful that there is a very important local story going on. And that story is not always consistent.”

If Australia wants to beat its bubble, perhaps it should look to Singapore.

It was fighting rampant prices too until the government intervened and did two things: boosted supply by building a whole bunch of new apartment buildings, and dampened demand by hiking stamp duty and cracking down on foreign buyers.