Mounting concerns over Australian housing bubble

From WSWS.Org.

The Reserve Bank resisted calls for an interest rate hike last week, amid growing fears that the continuing rise of house prices is creating the conditions for a crisis across the property market that would have far broader ramifications.

On Tuesday, the bank’s governor, Philip Lowe, announced that rates would remain at a historic low of 1.5 percent, after a series of cuts last year.

The decision followed reports last month that house prices continued their historically unprecedented ascent in 2016, with average value increases of 7.7 percent across the country. Average prices in Sydney and Melbourne, the centre of the property boom, rose by 19 and 14 percent respectively, and increased by around 6 percent in the December quarter alone. The median house price in Sydney is almost $1 million. In Melbourne, it is over $900,000.

In contrast, national wage growth was at its lowest level last year since records began in 1969, at just 1.8 percent across the private sector.

The divergence between the growth in property prices and the stagnant or declining incomes of millions of working people is fueling concerns that the housing bubble, built on a mountain of mortgage and household debt, to which the banks and financial institutions are heavily exposed, could collapse. Private debt across Australia is estimated at 187 percent of income. According to a report by the AustralianFinancial Review, mortgages make up around 62 percent of the assets of the major banks.

The Reserve Bank and other policymakers are trapped in an intractable dilemma. Any rise in interest rates could lead to a rapid fall in borrowing, posing the risk of a precipitous fall in house prices.

According to Digital Finance Analytics, mortgage stress rose by 1.5 percent between February and March, and is now affecting 22 percent of the country’s 3.1 million mortgaged households. The rise was partly on the back of relatively small increases to home loan interest rates by the major banks.

Further cuts, however, or the maintenance of the current rates, will encourage a continuation of the risky lending practices that have contributed to the dramatic inflation of the market. Numbers of commentators in the financial press denounced the reserve bank for its “inaction” and “indecision” this week.

In his remarks on Tuesday, Lowe warned of interest-only loans, in which borrowers only pay interest on their mortgage for a fixed-term of up to seven years, before paying off the principal of the loan. Lowe described the prevalence of interest-only loans, which make up as many as 40 percent of housing loans, as “unusual.” According to the Australian, as many as 60 percent of housing loans to investors are interest-only.

“Too many loans are still made where the borrower has the skinniest of income buffers,” Lowe said. “In some cases, lenders are assuming that people can live more frugally than in practice they can, leaving little buffer if things go wrong.”

Amid fears that the situation will lead to a growth in mortgage arrears and defaults, the Australian Prudential Regulation Authority (APRA) introduced new guidelines last week, aimed at forcing the banks to limit interest-only loans to 30 percent of their new transactions. There are also indications that APRA will move to lift the capital-to-loan ratios for banks. Currently, the banks are only required to hold 25 percent of capital compared to housing loans, on the basis that they are low risk.

Numbers of commentators have stated that the actions of regulatory authorities will change little.

The Australian Broadcasting Commission’s business editor Ian Varrender wrote on Monday: “The problem, as is usually the case with bubbles, is that no-one really wants it to deflate, let alone allow it to burst. The consequences are unthinkable. And all the action so far taken to slow it has failed.”

Varrender warned that the situation was a “perfect storm” and noted that shocks stemming from the global economic crisis could tip the housing market over the edge. “As one of the world’s most trade exposed nations, any major global upheaval would filter through to us,” he wrote.

Martin North, a property analyst, told an Australian Financial Review’s banking summit last week that he did not think a slowdown in the housing market would be “orderly.”

“Regulators have come to the party three or four years too late,” North said, adding, “I have a nasty feeling we are past the point of being able to manage this. There are not enough levers available to regulators to pull it back in line. I can’t see anything other than a significant correction. It’s not a question of if, but when.”

The situation has intensified the crisis confront the federal Liberal-National government of Malcolm Turnbull, which is riven with conflicts amid a slump of the Australian economy, and incessant demands from the corporate and financial elite for the imposition of sweeping austerity measures.

There are reportedly divisions within the government over proposals to reduce the 50 percent capital gains tax concessions for investors. While proponents of a cut are arguing that it could curb speculative and risky investments, any move would come up against the interests of the major property developers, who form a key constituency of the government. At the same time, surging housing prices have underpinned claims of continued economic growth, amid a slowdown of the mining and resources sector and slump in manufacturing.

For its part, Labor has issued populist demagogy, denouncing capital gains tax concessions. Successive governments, however, Labor and Liberal alike, have retained policies of negative gearing, capital gains concessions and the gutting of public housing stocks, which have provided a boon for property developers and investors, and contributed to a housing crisis for millions of working people.

A report in January found that 33 of 51 Australian housing markets surveyed were severely unaffordable, with Sydney deemed the second-most unaffordable market in the world. An entire generation of young people has been denied the prospect of buying a home. Just 29 percent of 25–34 years-old own their own home, compared to rates of over 60 percent in the early 1990s.

Workers have also been priced out of the market. From 2010 and 2015, the length of time it took for a two-income household, on average full-time wages, to save a median house deposit, rose from 5.8 to 7.9 years. Average mortgages are $381,000, up from $81,000 in the early 1980s.

Any “correction” of the market, let alone a full-scale collapse of the housing bubble, would see broad sections of the population left with debts and mortgages worth more than the value of their home.

Britain’s housing market is in poor health, but it’s not just a shortage – here’s why

From The UK Conversation.

The UK’s housing market is in critical condition. The symptoms are stark: demand in several regions far outstrips supply, prices relative to earnings in many major cities are beyond the reach of most people, home ownership is increasingly unobtainable, the homeless population is growing and low-income households are too often having to settle for substandard homes.

Yet so far, an exact diagnosis has proved elusive and, as a result, effective treatment has not been administered. The problem is that the housing sector is often described in shorthand – the housing market, “affordable” housing, the neighbourhood, or council housing, to name just four such ways of talking about housing. Each is quite different and even just looking at any one masks more than it illuminates – there is considerable variation in the quality and attractiveness of council housing, for instance.

Housing is a complex, interdependent system, with many components of different types and scales. Its function isn’t isolated from its environment – the operation of the housing system is closely connected to the land market and planning mechanismsas well as the construction and development industries. And housing exists across a range of jurisdictions and tenures, each accompanied by different laws, rights and obligations.

Living history

The mind behind Right to Buy. Nationaal Archief/Wikimedia Commons, CC BY

The housing system has also been moulded by history. For one thing, much of the UK’s housing stock is with us as part of a long-established and enduring built environment. It has also been shaped by extensive and overlapping sets of more or less effective government interventions over time: from the garden city movement, to post-war slum clearance, Margaret Thatcher’s Right to Buy and many others. These policies are situated amid shifts and changes in cultural beliefs about housing, aspirations and material constraints.

Housing systems are affected by economic change and income growth at local and regional levels – as well as interest rates, regulation of mortgage lending, housing taxes and other policies that privilege one set of housing arrangements over another. Demography – encompassing trends in migration, household size and ageing – also contributes to the shape and size of housing demand.

Yet these relationships run both ways. Housing is such a critical consideration for political and economic decisions that the state of the sector directly affects the economy and demography of the UK, as well as being affected by them. In a housing bust, for instance, falling incomes can reduce demand and house prices. But if house prices continue to fall, this can also reduce consumption and spending, as people feel worse off.

Unpicking the threads

When you think about housing as a system, it becomes clear that the “housing crisis” is actually a collection of symptoms from several chronic, overlapping problems. The UK housing market has experienced decades of privileged taxation treatment. Consecutive governments have been obsessed with boosting rates of home ownership. Meanwhile, the development industry’s business model is based on lifting land value, with planning permission from local authorities, which results in the construction of more expensive properties. And there has been long-term under-investment in social and affordable housing, combined with an over-reliance on welfare benefits to offset rising rents.

We know that the housing system is dominated by the existing stock, so it stands to reason that it will take a long time to untangle and address these issues, which have built up over the decades. That is, assuming that political consensus is strong enough to allow coherent long-term policy to move forward in step. This is a fair definition of a “wicked” problem.

To build consensus and tackle these issues, housing policy and practice need to be based on evidence, which is grounded in this systemic point of view. The evidence will need to be nuanced, according to the great variety in the sector across the UK: after all, housing is largely devolved, and significant differences between the situations and approaches in Scotland, Northern Ireland, England and Wales are already apparent. For instance, there is no Right to Buy in Scotland – instead, a new private tenancy law will produce longer-term tenancies that may yet encourage more families into the rented sector.

To this end, the University of Glasgow, together with eight other UK universities and four non-academic partners, is embarking on an ambitious programme: the UK Collaborative Centre for Housing Evidence (CaCHE). Our aim is to put evidence and analysis back at the heart of this complex social and economic problem. This research will provide the ammunition to influence and transform housing policy and practice through better problem diagnosis, policy evaluation and appraisal of new opportunities, in order to generate improved housing outcomes for all.

Pre Easter Auction Clearances Still Strong

The preliminary auction clearance results for today from Domain shows clearance rates and listings remained strong.

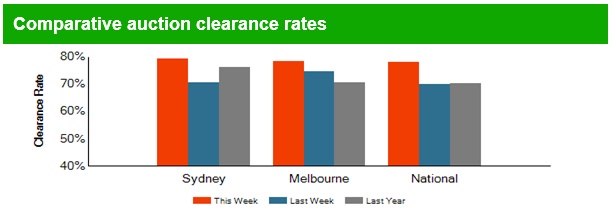
Sydney cleared 80.9% on 700 sales, compared with 549 last week. Melbourne cleared 768 compared with 655 last week, at a rate of 81.4%. Nationally, 1,601 sales were reported, compared with 1,309 last week, representing 79.9% of listings.

Canberra cleared 70% of 115 listed, Adelaide 86% of 112 listed and Brisbane 56% of 140 listed.

Housing correction ‘won’t be orderly’

From The AFR.

Ask respected property analyst Martin North what form the coming downturn in the housing market might take and “orderly” is not the description he uses.

Instead North anticipates a much more significant downturn in the investor-driven, debt-laden markets like Sydney and Melbourne.

“Orderly” is how S&P Global Ratings director Sharad Jain described the likely unwinding of the overheated housing market, where annualised house price growth is running close to 20 per cent in Sydney and Melbourne.

“It could unwind in an orderly manner as we are seeing in parts of Western Australia and Queensland,” Mr Jain said at the Australian Financial Review Banking and Wealth Summit this week.

But according to Mr North, whose says his view on the housing market has turned increasingly gloomier, Australia could be at the very early stages of where the US housing market was in 2008 before it crashed.

“Regulators have come to the party three or four years too late. They should have tackled negative gearing, not cut rates as much and focused on mortgage underwriting standards. Had they done so we would be in a position to manage the situation,” said Mr North, who runs research house Digital Finance Analytics.

“I have a nasty feeling we are passed the point of being able to manage this. There are not enough levers available to regulators to pull it back in line. I can’t see anything other than a significant correction. It’s not a question of if, but when.”

But SQM Research managing director Louis Christopher, the country’s most accurate forecaster of house price growth, said it was “too early to call what type of correction we will have”.

“The last downturn in Sydney was in 2004, where the market did correct a little bit that year and then stayed flat for an extended period of time.

“On balance you would say the odds favour a similar type of downturn, where the market corrects by 4-5 per cent and thereafter does not do anything for a long time.

“Perth’s correction has been kind of orderly. Not in its rental market where rents are down 20 per cent, but orderly for prices,” he said.

According to Mr Christopher, continued strong population growth in Sydney and Melbourne will continue to drive underlying demand for housing and should act as a buffer against any major correction.

But, he cautioned, the longer house prices continued to rise, the less likely any unwinding will be orderly. “If prices rise another 20 per cent, that increases the risk of a sharper correction,” he said.

CoreLogic figures going back to 2000 show that most housing booms have been followed by shorter periods of correction and then followed by elongated periods of little or no growth.

Even in Perth, where house prices have been correcting since late 2014 and have hardly moved in the past four years, they are still up more than 200 per cent since 2000.

Corelogic’s head of research, Cameron Kusher, said the “great unknown” in how the current house price cycle will play out is what investors will do when the growth is no longer there.

“If investors stay, the correction should not be too bad. But if they go away like they did in Adelaide, Brisbane and Perth and dump property for other asset classes, it could be much worse.”

Were that situation to play out, Mr Kusher said the Brisbane and Melbourne unit markets – where investors have dominated – could be the worst affected.

Based on the latest NAB Residential Property Survey of 250 property professionals, most investors appear to have no intention to quit the market.

The latest quarterly survey shows a surprise rise in housing market confidence despite mortgage rates going up and APRA turning the screws on lending to investors.

NAB chief economist Alan Oster believes an orderly unwinding of the current boom is the most likely outcome, pointing to the bank’s own forecasts of a slowdown later this year with annualised house price growth halving to about 7 per cent and then dropping to 4 per cent in 2018.

With the demand still strong and interest rates to remain low, Mr Oster said unemployment was the critical factor.

“We don’t see an unorderly correction unless unemployment hits 8.5 per cent and that would take a major global shock most likely coming out of the US or China,” Mr Oster said.

Having witnessed numerous housing cycles in his 30 years in real estate, John McGrath says he does not subscribe to the “housing bubble theory”.

Mr McGrath believes that if there is a correction it is likely to be modest with the recent tightening of lending acting as a “natural economic firebreak” to any collapse in prices.

“Historically if and when there is a correction the market gives back about half of the prior years growth which would suggest that when prices stop rising we are likely to see either a stabilisation at that point or perhaps a 5 per cent correction.

“Sydney and Melbourne are now major international cities and an ideal alternate address for those living or doing business in Asia. Compared to values in other great cities of the world, many overseas buyers and expats still see our two biggest cities as good value globally and a very safe place to invest,” he says.

But, Mr North sees things differently: “We have about 22 per cent of households in mortgage stress, which will continue to rise. There’s flat employment growth and no wages growth. I can’t see how you can hold all those elements together.”

And he believes the wealthier end of town could be most at risk: “My data shows the highest levels of immediate problems are not in the suburban fringe, but in the affluent suburbs, where people are really geared up with multiple properties.”

Investor Property Footprints And Negative Gearing

The argument trotted out to defend negative gearing from reform is that the bulk of investors are “typical mum and dad” households.

Of course it depends on how you look at the data, but lets look at output from our core market model.

What we have here is the relative VALUE distribution of investment property held by our core household segments, based on marked to market values.  We see that whilst some households in most segments are represented, the relative value is massively skewed towards more wealthy segments. Exclusive Professionals, our most wealthy segment holds 27% of all investment property by value, Mature Stable families hold 18%, Suburban Mainstream 15% and Wealthy Seniors 9%.

Another way to look at the data is through the lens of our property segmentation. Here investor only segments (they have no owner occupied property) hold 33% of investment property. Within that Portfolio Investors who hold multiple properties hold 3% by value. Those holding property but with no plans to move – Holders – have 20% by value, whilst those trading down hold 19%.

When we look at households by employment type, we see that employed workers hold 62% by value, whilst 17% are help by those not working, 10% managers, 9% expert professionals, and 2% by executives.

But if we look at the use of negative gearing, we see that three segments, by value have the largest footprint. Exclusive Professionals have 42% of negatively geared property, Mature Stable Families 27%, and Wealth Seniors 14%. Other segments are much less likely to negatively gear.

Looking again by Property Segments, Investors and Portfolio Investors have 32% of all negative gearing by value, but other segments also use this technique.

From this we conclude that it is important to separate the holding of an investment property from the use of negative gearing against that property. In fact we think negative gearing is predominately used by more affluent households, and they get the biggest tax breaks as a result, which of course other tax-payers have to subsidise.

There is, in our view, overwhelming evidence that curtailing the excesses in negative gearing (for example, a $ limit) would assist in cooling the market and inject needed cash into the budget.

But as we pointed out the other day, if the political agenda wins out, this just will not happen.

Mortgage Stress Rises Again

The latest results from the Digital Finance Analytics mortgage stress modelling, released today, reveals another rise in the number of households experiencing mortgage stress.

Martin North, Principal of Digital Finance Analytics said “of the 3.1 million mortgaged households, latest results from the DFA surveys of 52,000 households reveals an estimated 669,000 are now experiencing mortgage stress. This is a 1.5% rise from the previous month and maintains the trends we have observed in the past 12 months. The rise can be traced to continued static incomes, rising costs of living, and more underemployment; whilst mortgage interest rates have risen thanks to out-of-cycle adjustments by the banks and bigger mortgages thanks to rising home prices. With the latest housing debt to income ratio at a record 188.7*, households will remain under pressure”.

Within the 669,000 households, which represents 21.8% of borrowing households, 20.8% are in mild stress, meaning they are managing to make their mortgage repayments by cutting back on other expenditure, putting more on credit cards and generally hunkering down. However, the remaining 1% of households are in severe stress, meaning they are behind with their repayments, are trying to refinance, or sell their property or seeking hardship assistance.  Households are “stressed” when income does not cover ongoing costs, rather than identifying a set proportion of income, (such as 30%) going on the mortgage.

Regional analysis showed that 193,000 households are from NSW, 175,000 from VIC, 122,000 from QLD and 85,000 from WA.  However, the largest relative proportion of households in stress are found in the smaller states of SA and TAS, where the impact of sustained low wage growth and underemployment is strongly felt.

Looking ahead, the probability of 30-day mortgage default has also risen to 1.64%, with the highest risks residing in WA where it is more than 3% in the mining belts.  “We expect mortgage stress rates to climb through 2017 as mortgage rate rise, whilst slow wage growth, and underemployment will continue to bite” concluded Martin North.

Detailed analysis shows mortgage stress continues to touch some more affluent households, who are highly leveraged, as well as the more traditional “battler” groups in the urban fringe. Younger families and recent first time buyers are under the most pressure.

*RBA E2 Household Finances – Selected Ratios Dec 2016

Preliminary clearance rate remains strong, while auction volumes fall

From CoreLogic.

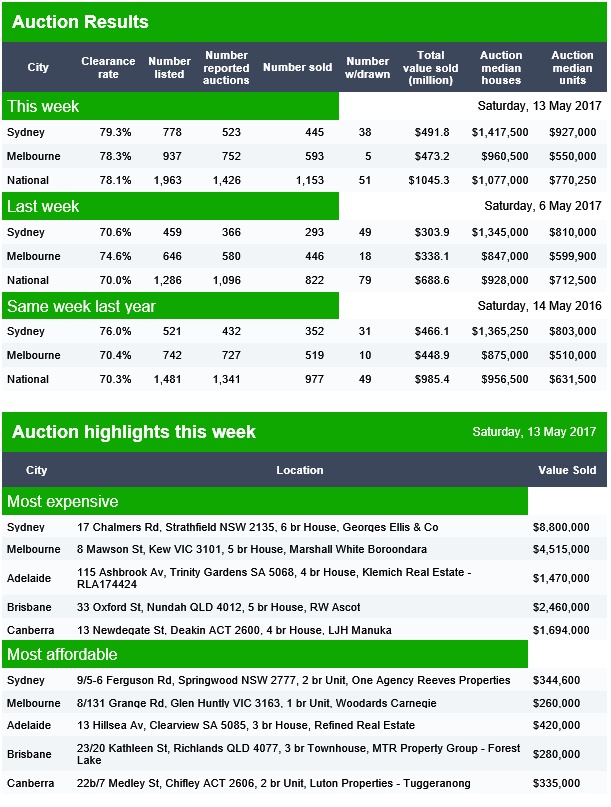
The combined capital city preliminary clearance rate remains in the mid-high 70 per cent range for another week, while auction volumes decrease week-on-week. There were 2,646 properties taken to auction this week, down from 3,171 last week, when auction volumes reached their second highest level so far this year. Despite auction volumes shifting generally higher over the last few weeks, the weighted average clearance rate has remained relatively consistent, with preliminary results this week showing 78.1 per cent of the 2,121 reported auctions were successful, increasing from 74.5 per cent last week and also higher than the corresponding week last year when a 66.6 per cent clearance rate was recorded across a significantly lower volume of auctions coming out of the Easter period (1,582).

Latest Auction Results Still Uptempo

The preliminary auction clearance results today from Domain continue the trend of high clearance rates, even if absolute volumes were down a little from the highs of last week.

Sydney achieved 81.3% with 479 sales, compared with 74.4% last week on 591 sales. Melbourne achieved 80.5% on 627 sales, compared with 75.9% last week on 975 sales. The national clearance rate was 79.4%, compared with 73.7% last week and 65% last year.

Brisbane cleared 62% of 99 scheduled auctions, Adelaide 79% of 73 scheduled and Canberra 60% of 48 auctions.

Global House Prices—Where is the Boom?

From iMFdirect.

While house prices around the world have rebounded over the last four years, a closer look reveals that this uptick is dependent on three things: location, location, location.

The IMF’s Global House Price Index—an average of real house prices across countries—has been rising for the past four years. However, house prices are not rising in every country. As noted in our November 2016 Quarterly Update, house price developments in the countries that make up the index fall into three clusters: gloom, bust and boom, and boom.

The first cluster—gloom—consists of countries in which house prices fell substantially at the onset of the Great Recession, and have remained on a downward path.

The second cluster—bust and boom—consists of countries in which housing markets have rebounded since 2013 after falling sharply during 2007–12.

The third cluster—boom—consists of countries in which the drop in house prices in 2007–12 was quite modest, and was followed by a quick rebound.

This chart shows that house prices varies within a cluster and within a country. Recent IMF assessments provide a more nuanced view of the within-country house price developments.

For example, in Australia, the strongest house price increases continue to be recorded in Sydney and Melbourne, where underlying demand for housing remains strong.

In Austria, the cumulative increase in the house price index over 2007–2015 was nearly 40 percent. To a large extent, this increase was driven by price dynamics in Vienna.

Looking at Turkey, the housing market exhibits significant variations across cities. Regional variations have been further accentuated by the presence of almost 3 million Syrian refugees since March 2011. Cities near the Syrian border, which have absorbed larger masses of Syrian refugees, have seen significant rises in local housing prices since 2011, though they have moderated in recent years.


Country/region and city clusters

Gloom = Brazil (Rio de Janeiro); China (Shanghai); Croatia (Zagreb); Cyprus (Nicosia); Finland (Helsinki); France (Paris); Greece (Athens); Macedonia (Skopje); Netherlands (Amsterdam); Russia (Moscow); Singapore (Singapore); Slovenia (Ljubljana); and Spain (Madrid).

Bust and Boom = Denmark (Copenhagen); Estonia (Tallinn); Hungary (Budapest); Iceland (Reykjavik); Indonesia (Jakarta); Ireland (Dublin); Japan (Tokyo); Latvia (Riga); New Zealand (Auckland); Portugal (Lisbon); South Africa (Johannesburg); United Kingdom (London); and United States (San Francisco).

Boom = Australia (Melbourne); Austria (Vienna); Belgium (Brussels); Canada (Toronto); Chile (Santiago); Colombia (Bogota); Hong Kong, SAR (Hong Kong); India (New Delhi); Israel (Tel Aviv); Korea (Seoul); Malaysia (Kuala Lumpur); Mexico (Mexico City); Norway (Oslo); Slovakia (Bratislava); Sweden (Stockholm); Switzerland (Zurich); and Taiwan, Province of China (Taipei City).

Read more on IMF global house price studies and check out the Global Housing Watch site.

Property prices continue to soar in an already hot market

From The NewDaily.

Latest property price figures have given home owners reason to celebrate and first home buyers even more reason for despair.

Latest data from CoreLogic Home shows prices in Australia’s main cities have leapt 3.7 per cent since the start of the year, with Sydney and Melbourne predictably higher than the national average.

Residential prices in the already-hot Sydney market jumped 5.3 per cent since January 1, with the median price hitting $950,000, and the median price for units now $740,000.

Melbourne property prices have risen 4.4 per cent this year, with the median house price at $710,000 and the unit price at $525,000.

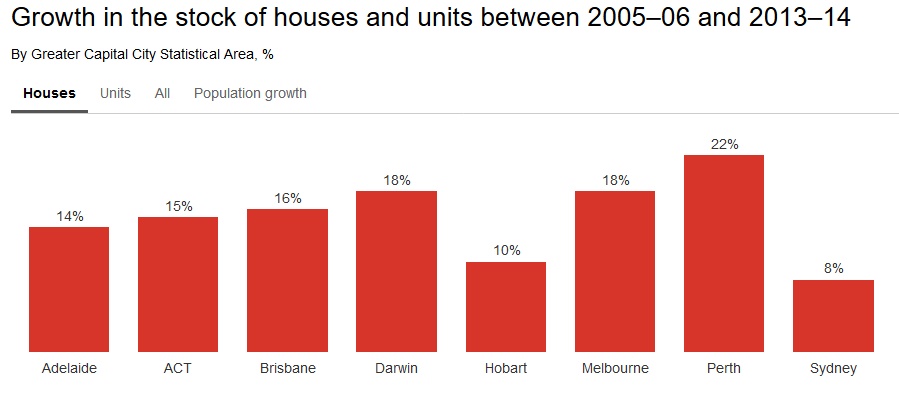
Perth was the only capital where prices have fallen, down 1.1 per cent.

Meanwhile, Hobart remains the cheapest market with median house prices at $365,000 and unit prices at $306,500.

The news comes a week after former Liberal leader John Hewson declared Australia was experiencing a property bubble and also follows a Reserve Bank statement noting there had been “a build-up of risks associated with the housing market”.

The bank referred to rising property prices in Melbourne and Sydney, the “considerable” number of apartments coming onto the market over the next few years, resurgent growth in investor lending, and household debt rising faster than household income.

CoreLogic also reported that the proportion of settled auctions — a key benchmark of demand — was also up.

The national auction clearance rate jumped to 77.1 per cent in the week to March 26, from 74.1 per cent the previous week and well up from the 70.9 per cent in the same week in 2016.

But home buyers could soon find themselves squeezed from two sides, as interest rates rise for both owner-occupiers and investors.

“There’s only one way for interest rates to go in my reading, and that’s up,” Martin North, analyst with Digital Finance Analytics, told The New Daily.

“I’ve believed for some time that by the end of the year interest rates on owner occupied housing loans will rise by 25 to 50 basis points and for investor housing it will be between 75 to 100 basis points. That is irrespective on any moves the Reserve Bank might make on rates.”

The escalation that has seen mainland capital house prices rise 13.1 per cent in a year and as much as 19.8 per cent in Sydney is putting pressure on buyers despite low rates.

“Around 20 per cent of all owner-occupiers are suffering mortgage stress, and if rates were to rise one percentage point that would rise to 24 per cent, Mr North said.

CoreLogic’s data also showed that there were 3147 auctions last week— the second highest so far in 2017, and up from 2916 the previous week.

 – with AAP