Housing correction ‘won’t be orderly’

From The AFR.

Ask respected property analyst Martin North what form the coming downturn in the housing market might take and “orderly” is not the description he uses.

Instead North anticipates a much more significant downturn in the investor-driven, debt-laden markets like Sydney and Melbourne.

“Orderly” is how S&P Global Ratings director Sharad Jain described the likely unwinding of the overheated housing market, where annualised house price growth is running close to 20 per cent in Sydney and Melbourne.

“It could unwind in an orderly manner as we are seeing in parts of Western Australia and Queensland,” Mr Jain said at the Australian Financial Review Banking and Wealth Summit this week.

But according to Mr North, whose says his view on the housing market has turned increasingly gloomier, Australia could be at the very early stages of where the US housing market was in 2008 before it crashed.

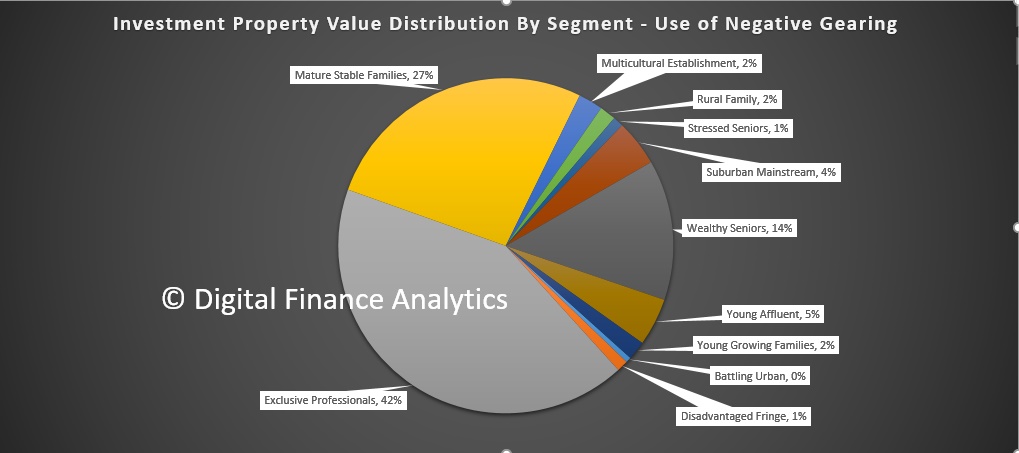
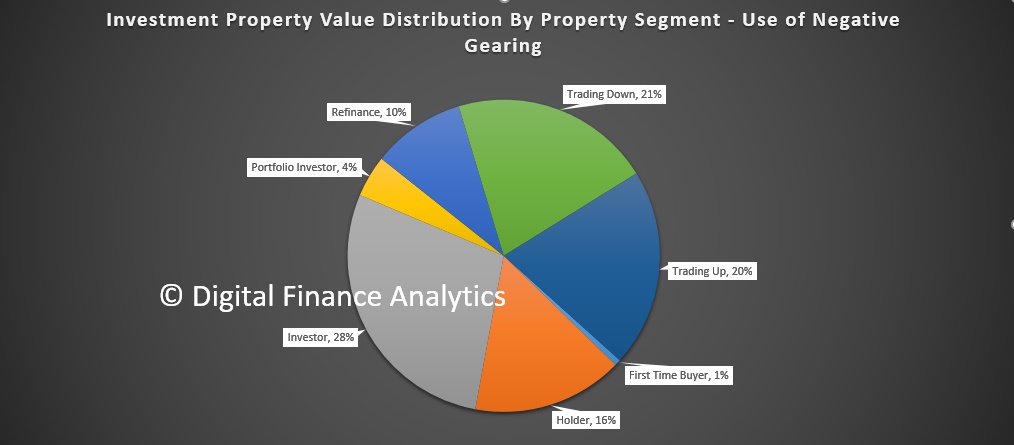
“Regulators have come to the party three or four years too late. They should have tackled negative gearing, not cut rates as much and focused on mortgage underwriting standards. Had they done so we would be in a position to manage the situation,” said Mr North, who runs research house Digital Finance Analytics.

“I have a nasty feeling we are passed the point of being able to manage this. There are not enough levers available to regulators to pull it back in line. I can’t see anything other than a significant correction. It’s not a question of if, but when.”

But SQM Research managing director Louis Christopher, the country’s most accurate forecaster of house price growth, said it was “too early to call what type of correction we will have”.

“The last downturn in Sydney was in 2004, where the market did correct a little bit that year and then stayed flat for an extended period of time.

“On balance you would say the odds favour a similar type of downturn, where the market corrects by 4-5 per cent and thereafter does not do anything for a long time.

“Perth’s correction has been kind of orderly. Not in its rental market where rents are down 20 per cent, but orderly for prices,” he said.

According to Mr Christopher, continued strong population growth in Sydney and Melbourne will continue to drive underlying demand for housing and should act as a buffer against any major correction.

But, he cautioned, the longer house prices continued to rise, the less likely any unwinding will be orderly. “If prices rise another 20 per cent, that increases the risk of a sharper correction,” he said.

CoreLogic figures going back to 2000 show that most housing booms have been followed by shorter periods of correction and then followed by elongated periods of little or no growth.

Even in Perth, where house prices have been correcting since late 2014 and have hardly moved in the past four years, they are still up more than 200 per cent since 2000.

Corelogic’s head of research, Cameron Kusher, said the “great unknown” in how the current house price cycle will play out is what investors will do when the growth is no longer there.

“If investors stay, the correction should not be too bad. But if they go away like they did in Adelaide, Brisbane and Perth and dump property for other asset classes, it could be much worse.”

Were that situation to play out, Mr Kusher said the Brisbane and Melbourne unit markets – where investors have dominated – could be the worst affected.

Based on the latest NAB Residential Property Survey of 250 property professionals, most investors appear to have no intention to quit the market.

The latest quarterly survey shows a surprise rise in housing market confidence despite mortgage rates going up and APRA turning the screws on lending to investors.

NAB chief economist Alan Oster believes an orderly unwinding of the current boom is the most likely outcome, pointing to the bank’s own forecasts of a slowdown later this year with annualised house price growth halving to about 7 per cent and then dropping to 4 per cent in 2018.

With the demand still strong and interest rates to remain low, Mr Oster said unemployment was the critical factor.

“We don’t see an unorderly correction unless unemployment hits 8.5 per cent and that would take a major global shock most likely coming out of the US or China,” Mr Oster said.

Having witnessed numerous housing cycles in his 30 years in real estate, John McGrath says he does not subscribe to the “housing bubble theory”.

Mr McGrath believes that if there is a correction it is likely to be modest with the recent tightening of lending acting as a “natural economic firebreak” to any collapse in prices.

“Historically if and when there is a correction the market gives back about half of the prior years growth which would suggest that when prices stop rising we are likely to see either a stabilisation at that point or perhaps a 5 per cent correction.

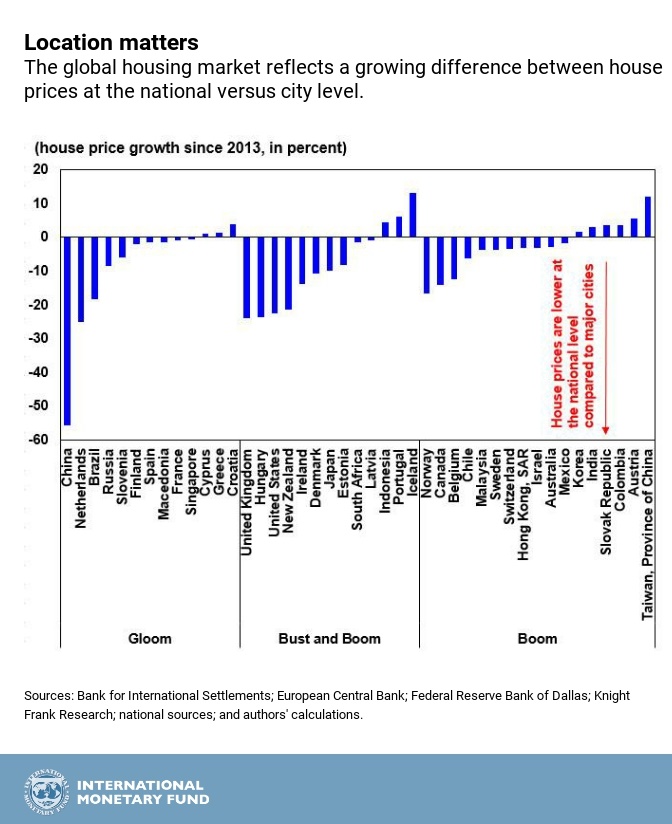
“Sydney and Melbourne are now major international cities and an ideal alternate address for those living or doing business in Asia. Compared to values in other great cities of the world, many overseas buyers and expats still see our two biggest cities as good value globally and a very safe place to invest,” he says.

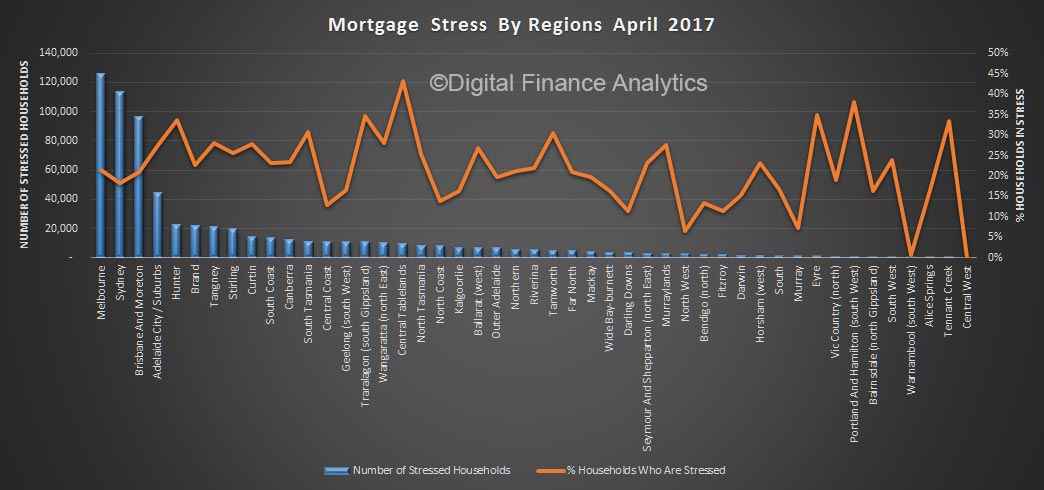
But, Mr North sees things differently: “We have about 22 per cent of households in mortgage stress, which will continue to rise. There’s flat employment growth and no wages growth. I can’t see how you can hold all those elements together.”

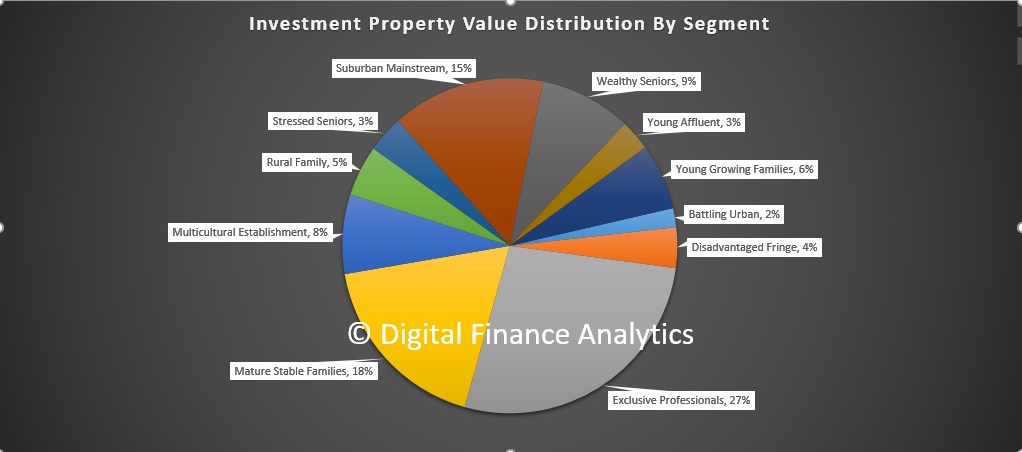
And he believes the wealthier end of town could be most at risk: “My data shows the highest levels of immediate problems are not in the suburban fringe, but in the affluent suburbs, where people are really geared up with multiple properties.”

Investor Property Footprints And Negative Gearing

The argument trotted out to defend negative gearing from reform is that the bulk of investors are “typical mum and dad” households.

Of course it depends on how you look at the data, but lets look at output from our core market model.

What we have here is the relative VALUE distribution of investment property held by our core household segments, based on marked to market values.  We see that whilst some households in most segments are represented, the relative value is massively skewed towards more wealthy segments. Exclusive Professionals, our most wealthy segment holds 27% of all investment property by value, Mature Stable families hold 18%, Suburban Mainstream 15% and Wealthy Seniors 9%.

Another way to look at the data is through the lens of our property segmentation. Here investor only segments (they have no owner occupied property) hold 33% of investment property. Within that Portfolio Investors who hold multiple properties hold 3% by value. Those holding property but with no plans to move – Holders – have 20% by value, whilst those trading down hold 19%.

When we look at households by employment type, we see that employed workers hold 62% by value, whilst 17% are help by those not working, 10% managers, 9% expert professionals, and 2% by executives.

But if we look at the use of negative gearing, we see that three segments, by value have the largest footprint. Exclusive Professionals have 42% of negatively geared property, Mature Stable Families 27%, and Wealth Seniors 14%. Other segments are much less likely to negatively gear.

Looking again by Property Segments, Investors and Portfolio Investors have 32% of all negative gearing by value, but other segments also use this technique.

From this we conclude that it is important to separate the holding of an investment property from the use of negative gearing against that property. In fact we think negative gearing is predominately used by more affluent households, and they get the biggest tax breaks as a result, which of course other tax-payers have to subsidise.

There is, in our view, overwhelming evidence that curtailing the excesses in negative gearing (for example, a $ limit) would assist in cooling the market and inject needed cash into the budget.

But as we pointed out the other day, if the political agenda wins out, this just will not happen.

Mortgage Stress Rises Again

The latest results from the Digital Finance Analytics mortgage stress modelling, released today, reveals another rise in the number of households experiencing mortgage stress.

Martin North, Principal of Digital Finance Analytics said “of the 3.1 million mortgaged households, latest results from the DFA surveys of 52,000 households reveals an estimated 669,000 are now experiencing mortgage stress. This is a 1.5% rise from the previous month and maintains the trends we have observed in the past 12 months. The rise can be traced to continued static incomes, rising costs of living, and more underemployment; whilst mortgage interest rates have risen thanks to out-of-cycle adjustments by the banks and bigger mortgages thanks to rising home prices. With the latest housing debt to income ratio at a record 188.7*, households will remain under pressure”.

Within the 669,000 households, which represents 21.8% of borrowing households, 20.8% are in mild stress, meaning they are managing to make their mortgage repayments by cutting back on other expenditure, putting more on credit cards and generally hunkering down. However, the remaining 1% of households are in severe stress, meaning they are behind with their repayments, are trying to refinance, or sell their property or seeking hardship assistance.  Households are “stressed” when income does not cover ongoing costs, rather than identifying a set proportion of income, (such as 30%) going on the mortgage.

Regional analysis showed that 193,000 households are from NSW, 175,000 from VIC, 122,000 from QLD and 85,000 from WA.  However, the largest relative proportion of households in stress are found in the smaller states of SA and TAS, where the impact of sustained low wage growth and underemployment is strongly felt.

Looking ahead, the probability of 30-day mortgage default has also risen to 1.64%, with the highest risks residing in WA where it is more than 3% in the mining belts.  “We expect mortgage stress rates to climb through 2017 as mortgage rate rise, whilst slow wage growth, and underemployment will continue to bite” concluded Martin North.

Detailed analysis shows mortgage stress continues to touch some more affluent households, who are highly leveraged, as well as the more traditional “battler” groups in the urban fringe. Younger families and recent first time buyers are under the most pressure.

*RBA E2 Household Finances – Selected Ratios Dec 2016

Preliminary clearance rate remains strong, while auction volumes fall

From CoreLogic.

The combined capital city preliminary clearance rate remains in the mid-high 70 per cent range for another week, while auction volumes decrease week-on-week. There were 2,646 properties taken to auction this week, down from 3,171 last week, when auction volumes reached their second highest level so far this year. Despite auction volumes shifting generally higher over the last few weeks, the weighted average clearance rate has remained relatively consistent, with preliminary results this week showing 78.1 per cent of the 2,121 reported auctions were successful, increasing from 74.5 per cent last week and also higher than the corresponding week last year when a 66.6 per cent clearance rate was recorded across a significantly lower volume of auctions coming out of the Easter period (1,582).

Latest Auction Results Still Uptempo

The preliminary auction clearance results today from Domain continue the trend of high clearance rates, even if absolute volumes were down a little from the highs of last week.

Sydney achieved 81.3% with 479 sales, compared with 74.4% last week on 591 sales. Melbourne achieved 80.5% on 627 sales, compared with 75.9% last week on 975 sales. The national clearance rate was 79.4%, compared with 73.7% last week and 65% last year.

Brisbane cleared 62% of 99 scheduled auctions, Adelaide 79% of 73 scheduled and Canberra 60% of 48 auctions.

Global House Prices—Where is the Boom?

From iMFdirect.

While house prices around the world have rebounded over the last four years, a closer look reveals that this uptick is dependent on three things: location, location, location.

The IMF’s Global House Price Index—an average of real house prices across countries—has been rising for the past four years. However, house prices are not rising in every country. As noted in our November 2016 Quarterly Update, house price developments in the countries that make up the index fall into three clusters: gloom, bust and boom, and boom.

The first cluster—gloom—consists of countries in which house prices fell substantially at the onset of the Great Recession, and have remained on a downward path.

The second cluster—bust and boom—consists of countries in which housing markets have rebounded since 2013 after falling sharply during 2007–12.

The third cluster—boom—consists of countries in which the drop in house prices in 2007–12 was quite modest, and was followed by a quick rebound.

This chart shows that house prices varies within a cluster and within a country. Recent IMF assessments provide a more nuanced view of the within-country house price developments.

For example, in Australia, the strongest house price increases continue to be recorded in Sydney and Melbourne, where underlying demand for housing remains strong.

In Austria, the cumulative increase in the house price index over 2007–2015 was nearly 40 percent. To a large extent, this increase was driven by price dynamics in Vienna.

Looking at Turkey, the housing market exhibits significant variations across cities. Regional variations have been further accentuated by the presence of almost 3 million Syrian refugees since March 2011. Cities near the Syrian border, which have absorbed larger masses of Syrian refugees, have seen significant rises in local housing prices since 2011, though they have moderated in recent years.


Country/region and city clusters

Gloom = Brazil (Rio de Janeiro); China (Shanghai); Croatia (Zagreb); Cyprus (Nicosia); Finland (Helsinki); France (Paris); Greece (Athens); Macedonia (Skopje); Netherlands (Amsterdam); Russia (Moscow); Singapore (Singapore); Slovenia (Ljubljana); and Spain (Madrid).

Bust and Boom = Denmark (Copenhagen); Estonia (Tallinn); Hungary (Budapest); Iceland (Reykjavik); Indonesia (Jakarta); Ireland (Dublin); Japan (Tokyo); Latvia (Riga); New Zealand (Auckland); Portugal (Lisbon); South Africa (Johannesburg); United Kingdom (London); and United States (San Francisco).

Boom = Australia (Melbourne); Austria (Vienna); Belgium (Brussels); Canada (Toronto); Chile (Santiago); Colombia (Bogota); Hong Kong, SAR (Hong Kong); India (New Delhi); Israel (Tel Aviv); Korea (Seoul); Malaysia (Kuala Lumpur); Mexico (Mexico City); Norway (Oslo); Slovakia (Bratislava); Sweden (Stockholm); Switzerland (Zurich); and Taiwan, Province of China (Taipei City).

Read more on IMF global house price studies and check out the Global Housing Watch site.

Property prices continue to soar in an already hot market

From The NewDaily.

Latest property price figures have given home owners reason to celebrate and first home buyers even more reason for despair.

Latest data from CoreLogic Home shows prices in Australia’s main cities have leapt 3.7 per cent since the start of the year, with Sydney and Melbourne predictably higher than the national average.

Residential prices in the already-hot Sydney market jumped 5.3 per cent since January 1, with the median price hitting $950,000, and the median price for units now $740,000.

Melbourne property prices have risen 4.4 per cent this year, with the median house price at $710,000 and the unit price at $525,000.

Perth was the only capital where prices have fallen, down 1.1 per cent.

Meanwhile, Hobart remains the cheapest market with median house prices at $365,000 and unit prices at $306,500.

The news comes a week after former Liberal leader John Hewson declared Australia was experiencing a property bubble and also follows a Reserve Bank statement noting there had been “a build-up of risks associated with the housing market”.

The bank referred to rising property prices in Melbourne and Sydney, the “considerable” number of apartments coming onto the market over the next few years, resurgent growth in investor lending, and household debt rising faster than household income.

CoreLogic also reported that the proportion of settled auctions — a key benchmark of demand — was also up.

The national auction clearance rate jumped to 77.1 per cent in the week to March 26, from 74.1 per cent the previous week and well up from the 70.9 per cent in the same week in 2016.

But home buyers could soon find themselves squeezed from two sides, as interest rates rise for both owner-occupiers and investors.

“There’s only one way for interest rates to go in my reading, and that’s up,” Martin North, analyst with Digital Finance Analytics, told The New Daily.

“I’ve believed for some time that by the end of the year interest rates on owner occupied housing loans will rise by 25 to 50 basis points and for investor housing it will be between 75 to 100 basis points. That is irrespective on any moves the Reserve Bank might make on rates.”

The escalation that has seen mainland capital house prices rise 13.1 per cent in a year and as much as 19.8 per cent in Sydney is putting pressure on buyers despite low rates.

“Around 20 per cent of all owner-occupiers are suffering mortgage stress, and if rates were to rise one percentage point that would rise to 24 per cent, Mr North said.

CoreLogic’s data also showed that there were 3147 auctions last week— the second highest so far in 2017, and up from 2916 the previous week.

 – with AAP

Auction Clearances Higher

CoreLogic says the amount of auction activity across the capital cities increased this week, up from 2,916 last week to 3,147 this week; the largest number of auctions since the last week of February 2017 when 3,301 auctions were held. This time last year was the Easter long weekend, so auction volumes were substantially lower, with 554 homes taken to auction across the combined capital cities. This week’s preliminary weighted average clearance rate across the combined capitals was 77.1 per cent, increasing from 74.1 per cent over the previous week and up from 70.9 per cent one year ago. Sydney saw the highest preliminary clearance rate across the cities at 81.1 per cent, while across the remaining cities; clearance rates increased week-on week with the exception of Brisbane and Perth where clearance rates fell.

Auction Run Continues

The latest preliminary data from Domain shows continuing momentum in today’s auction results.

Sydney achieved a clearance of 80.2% compared with 76.7% last week, and 61.4% last year. The volumes are also up. In Melbourne, clearance was 79.5%, higher than the 75.3% last week and nationally, clearances were at 78% compared with 73.8% last week.

Our surveys suggest that investors are rushing to purchase ahead of the upcoming budget in May, as they fear the generous tax breaks may disappear. First time buyers are being beaten to the punch.

Brisbane achieved 47% on 138 auctions, Adelaide 64% on 79 scheduled and Canberra 77% on 78.

Capital gains tax concession is too generous: economists poll

From The Conversation.

As the federal budget approaches, the government is grappling with ways to enhance housing affordability, including reforming the current 50% capital gains tax (CGT) deduction on property investment.

The Economics Society of Australia (ESA) Monash Forum polled economists on this proposition:

Capital gains tax deductions for housing investment should be removed because they overstimulate the housing market, contributing to rising house prices.

This is a deliberately more extreme measure than the proposal reportedly being considered by the federal government, which is to cut the current discount to 25%. But we wanted to assess more generally the effect of capital gains taxes on the housing market.

The poll found 44.4% of economists agreed with a statement that the tax deduction should be removed entirely (22.2% agreeing and 22.2% strongly agreeing). But 40.7% disagreed with the statement (22.2% disagreeing and 18.5% strongly disagreeing); while 14.8% of respondents were uncertain.

While some economists support the current role of the CGT discount to avoid taxing the capital gains that arise as a result of inflation increasing house prices, as opposed to the valuation in the land or property due to development (Saul Eslake, Rodney Maddock, Nigel Stapledon and Doug McTaggart), others believe the tax should also apply to the gains as a result of inflation (Kevin Davis and Margaret Nowak).

Many argued the principle of the CGT discount is not a bad policy, however the level of the discount is generous and is open for abuse.

They also pointed out that changes in one type of tax will distort the economy, especially if it is only targeted to one type of asset, in this case property. Instead some economists suggested the approach should be a holistic reform to fix tax inefficiencies, and tax treatment should be equal between all forms of investment and saving.

Most of the economists agreed housing affordability policies should be focused mainly on housing supply and housing market constraints (as well as transport and infrastructure) to solve the crisis. Other policies such as shared-ownership schemes and government-backed bonds are also being considered.

Capital gains tax

The capital gains tax (CGT) is calculated at the effective marginal tax rate of the investor, on the capital gains made at the time of sale of the asset. Investors who hold an asset for longer than 12 months receive a 50% discount on the CGT liability, at the time of sale. For superannuation funds, the discount rate is 33.3%.

Owner-occupiers are fully exempt from capital gains tax on the sale of their primary residence.

Some of the options reportedly being considered by the federal government include decreasing the CGT concession to 25%, decreasing it to 40% discount (as recommended in the Henry Tax Review) only for property investments, or some other reduction in the CGT discount for property investments.

Another option is completely removing the concession if the property is sold in the initial investment years; and phasing the discount in after the investment has been held for some specified number of years.

The economists’ arguments for and against

Economists who supported removing capital gains tax deductions for housing investment said the discount provides incentives to over-invest in property rather than other assets that provide income. So by eliminating or reducing the CGT discount, the cost of capital will increase and buyers will reduce their demand for property, resulting in lower, more affordable house prices.

Those who agreed with the statement argue any change in the CGT discount to address property speculation should also be accompanied by reforming negative gearing. They argue that eliminating the CGT discount for property only would push residential investors towards cheaper properties or towards investing in other assets that maintain the CGT discount.

Most studies find no evidence of capital gains advantages being a main incentive for investors holding residential property. However it appears to be a small factor in the intention of investing in residential property.

Those against the statement argue the timing may not be right as the housing cycle is currently at its peak, and the double digit house price appreciation rates are only seen in the inner-ring suburbs of metropolitan cities and only for houses and not apartments.

Economists would expect to see only a short-term drop in house prices if the CGT deductions are eliminated, as investors switch away from property and into other assets. So the remaining residential investors in the market would purchase cheaper properties, potentially still crowding out first-home buyers.

They would also hold the property for a longer period. In the medium to long-term, the reduction in residential investment would impact on the new and existing supply of housing, resulting in housing shortage and rising house prices.

You can read the economists’ individual answers by clicking below.


The ESA Monash Forum is a joint initiative between Monash Business School and the Economic Society of Australia. Maria Yanotti was a guest writer for the Forum.