APRA On The Countercyclical Capital Buffer

APRA released a brief update to support their zero Countercylical Capital Buffer setting. As they say “the countercyclical capital buffer is designed to be used to raise banking sector capital requirements in periods where excess credit growth is judged to be associated with the build-up of systemic risk. This additional buffer can then be reduced or removed during subsequent periods of stress, to reduce the risk of the supply of credit being impacted by regulatory capital requirements”.

APRA may set a countercyclical capital buffer within a range of 0 to 2.5 per cent of risk weighted assets. On 17 December 2015, APRA announced that the countercyclical capital buffer applying to the Australian exposures of authorised deposit-taking institutions (ADIs) from 1 January 2016 would be set at zero per cent. An announcement to increase the buffer may have up to 12 months’ notice before the new buffer comes into effect; a decision to reduce the buffer will generally be effective immediately.

APRA reviews the level of the countercyclical capital buffer on a quarterly basis, based on forward looking judgements around credit growth, asset price growth, and lending conditions, as well as evidence of financial stress. APRA takes into consideration the levels of a set of core financial indicators, prudential measures in place, and a range of other supplementary metrics and information, including findings from its supervisory activities. APRA also seeks input on the level of the buffer from other agencies on the Council of Financial Regulators.

A range of core indicators are used to justify their position. Here are their main data-points.

Credit growth

Credit-to-GDP ratio (level, trend and gap)

The credit-to-GDP gap is defined as the difference between the credit-to-GDP ratio and its long-run trend. The long-run trend is calculated using a one sided Hodrick-Prescott filter, a tool used in macroeconomics to establish the trend of a variable over time. The credit-to-GDP gap for Australia is currently negative at -3.9. The Basel Committee suggests that a gap level between 2 and 10 percentage points could equate to a countercyclical capital buffer of between 0 and 2.5 percent of risk-weighted assets.

Housing credit growth

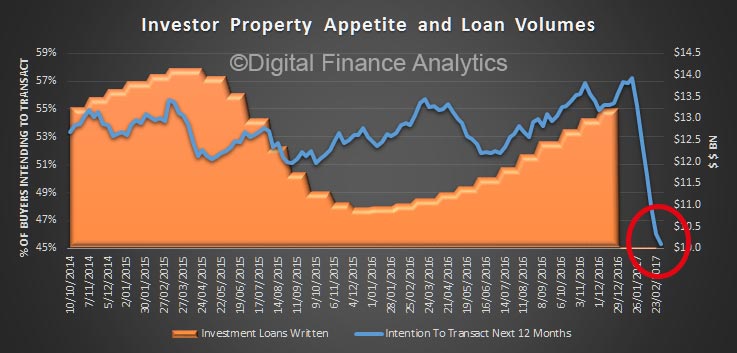
The pace of housing credit growth has slowed this year, growing at 6.4 per cent year on year as at September 2016, down from 7.5 per cent at the time the buffer was initially set. Investor housing credit growth fell from 10 per cent to 4.9 per cent over the same period, however the pace of growth has been increasing again more recently. APRA has identified strong growth in lending to property investors (portfolio growth above a threshold of 10 per cent) as an important risk indicator for APRA supervisors.

Business credit growth

Business credit growth increased marginally in the first half of 2016. However, business credit growth has fallen over recent quarters; annual growth in business credit was 4.8 per cent over the year to end September 2016, down from 6.3 per cent as at September 2015. Notwithstanding the lower overall rate of growth, commercial property lending growth (not shown) has remained strong, growing 10.5 per cent year on year as at September 2016.

Asset Prices

National housing price growth remains strong, but has slowed relative to 2015 peaks, growing nationally at around 3.5 per cent over the 12 months to September 2016. However, over a shorter horizon, prices have been reaccelerating recently with six month-ended annualised price growth of 7.2 per cent nationally as at September 2016 (albeit still a slower pace than 2015 peaks). Conversely, rental growth and household income growth have been relatively weak. Looking beyond the national averages, conditions vary significantly across individual cities and regions. In particular, housing price growth has strengthened in Sydney and Melbourne over recent months with six month-ended annualised growth rates of 11.4 per cent and 9.0 per cent respectively.

Non-residential commercial property has also been exhibiting strong price growth, though this has moderated somewhat in recent months (not shown).

Lending indicators

APRA monitors a range of data and qualitative information on lending standards. For residential mortgages, the proportion of higher-risk lending is a key metric. Over the past few years, APRA has heightened its regulatory focus on the mortgage lending practices of ADIs in order to reinforce sound lending practices. This has included, but not been limited to, the introduction of benchmarks on loan serviceability and investor lending growth, and the issuance of a prudential practice guide on sound risk management practices for residential mortgage lending.

In general, higher-risk mortgage lending has been falling recently with the share of new lending at loan-to-valuation ratios greater than 90 per cent falling from 9.5 per cent to 8.1 per cent over the year to September 2016. Other forms of higher-risk mortgage lending including high loan-to-income and interest-only lending (not shown) have also moderated from 2015 peaks, although there has been some pick-up in the share of interest-only lending recently.

In business lending, banks have showed some evidence of tightening lending standards more recently, in particular for commercial property lending, with the lowering of loan-to-valuation and loan-to-cost ratios on certain development transactions (not shown).

Lending rates had been steadily falling for both housing and business lending to historical lows. More recently however, lending rates have fallen by less than the cash rate, with banks passing on around half of the August cash rate reduction. Lending rates have also risen in recent weeks in response to higher costs in wholesale funding markets. In particular, a number of ADIs have recently announced increases to their mortgage lending rates with some ADIs specifically targeting investor and interest-only loans.

APRA’s confidential quarterly survey of credit conditions and lending standards provides qualitative information on whether conditions are tightening or loosening in the industry.

Financial Stress

Indicators of financial stress are used in informing decisions to release any countercyclical capital buffer. While a wide range of indicators could signify a deterioration in conditions, APRA has identified non-performing loans as its core indicator of financial stress.

The share of non-performing loans remains low, though it has increased moderately over 2016, to 0.93 per cent as at September 2016, largely driven by increases in regions and sectors with exposures to mining.

So, everything is looking rosy, in their view. However, the high household debt to income ratio and the fact that debt servicing is supported by ultra low interest rates is not included adequately in their assessment – seems myopic in my view, but then this continues the regulatory group-think.  In addition the use of “confidential quarterly survey data” highlights the lack of industry disclosure.

The Definitive Guide To Our Latest Mortgage Stress Research

We have had an avalanche of requests for further information about our monthly mortgage stress research which is published as a series of blog posts plus coverage in the media, including Four Corners. Here is the timeline of recent posts, which together provides a comprehensive view of the work.

Check out our media coverage.

US Mortgage Rates Add Stress for Millennial Homebuyers

Fitch Ratings says the recent rise in US interest rates adds another obstacle for millennials seeking to enter the housing market.

Based on our calculations, the rate increase means the average US millennial borrower now has lost 9% in mortgage capacity since the beginning of October 2016. This leaves more millennials out of what has historically been one of the most important wealth-creation mechanisms, and could contribute to long-term shifts in savings and consumption.

Mortgage rates nearly hit a two-year high during the week of Jan. 5, 2017 according to Freddie Mac. The interest rate on a 30-year mortgage at the beginning of October 2016 was 3.42%. Last week, the rate climbed to 4.20%. The maximum loan a homebuyer could afford in September 2016 was $120,000 (the current median mortgage for borrowers under 35 according to the Federal Survey of Consumer Finances), all else being equal, the size of that loan would have dropped to approximately $109,000 by last week.

Historically low rates have been one of the few factors that have helped young adults to buy homes. If rates continue to rise, particularly if the rise occurs rapidly over a short time period, this could add yet another obstacle to homeownership. Many first-time homebuyers have seen mortgage capacity eroded by tight loan underwriting standards, rising student loan payments, high rents and stagnant wages.

The growth in the cost of higher education outpaced consumer price inflation for several decades. This led to an increase in both the number of student loan borrowers and the average amount owed. The median student loan monthly payment in 2016 was $203, according to the Federal Reserve Bank of Cleveland.

Tight underwriting played a significant role. Banks remain vigilant over regulatory risk, repurchase risk and the increased cost of servicing of delinquent loans. This means FICO scores for conventional loans to first-time homebuyers remain notably above the 720-730 range level typical prior to the crisis, although the scores have begun trending back toward historical averages.

The stresses are reflected in the US homeownership rate and increases in the portion of millennials who live at home. The homeownership rate for under 35-year-olds experienced a large drop, declining to 35% in 2016, from 41% in 2000, according to the US Census Bureau. During this time, rental costs increased faster than the incomes millennials earn.

For younger Americans forced to defer or abandon plans to buy a first home, the long-term financial effect of missing out on home-equity creation could be significant. Long-lasting shifts in savings and consumption patterns, while difficult to isolate now, will likely emerge more prominently in the coming years. This could mean other long-run affects including downward pressure on durable goods consumption, urban population growth and a decline in affluence, translating into lower birth rates and less secure retirements.

Confidence in Property at Two-year High Says Survey

From The Real Estate Conversation.

A survey of industry participants shows confidence in the property sector is at a two-year high, despite the prospect of higher interest rates and the slowing trend in building approvals.

Confidence in the property sector is at a two-year high at the beginning of 2017, according to the latest ANZ Property Council Survey.

The survey of more than 1,500 property professionals showed that confidence rose 2 points to 132 for the March 2017 quarter.  A score of 100 is considered to be neutral confidence.

“This is good news to start 2017,” said Ken Morrison, Chief Executive of the Property Council of Australia.

Despite the prospect of higher interest rates and the recorded slowdown in building approvals, Morrison said the outlook is optimistic for “economic growth, capital values, and forward work schedules.”

However, Morrison recognised that the situation varies across the country.

“Naturally there are state by state variations,” he said, “but taken together this is good news during a somewhat uncertain time.”

NSW’s reading jumped from 142 to 149, the highest result in the country.

“We see in NSW a strong surge in confidence underpinned by expectations for economic growth, housing, forward work expectations as well as confidence in the government itself,” said Morrison.

“Likewise, we are seeing consistent and strong growth expectations in Victoria and the ACT.  We are also seeing a pickup in confidence in South Australia and Queensland.”

Morrison said Western Australia remains a weak spot. The confidence index showed a decline from 104 to 98.

“Western Australia is still coming to terms with the end of the mining moon,” he said, “and confidence did slip back into negative territory.”

Morrison said it’s important that governments do all they can to facilitate growth in the uncertain economic climate.

“Given the trifecta of deficits, ratings agency reviews and negative growth data from the ABS, it is vital that industries that are growing be encouraged to flourish,” said Morrison.

“Tackling our byzantine planning systems, cutting unnecessary delays costs Federal and State budgets nothing,” he said, will “spur investment, jobs and growth.”

Richard Yetsenga, ANZ Chief Economist said the March quarter survey showed that firms are optimistic around the outlook for the property sector.

“Much of the improved outlook for the property market came from the residential segment, supported by improved expectations of capital price growth, forward work schedules and construction activity,” he said.

Yetsenga said strong levels of property investment were also buoying the sector, and the commercial sector was doing well.

“Sentiment in the commercial property segment is still stronger than in residential property,” he said.

“Net confidence in the commercial offices segment has been steadily rising for two years now, reflecting an improving outlook for price growth and construction activity. The result is in line with ongoing absorption of office space, as white-collar employment continues to rise across the major capital markets.”

A Cumulative View Of Mortgage Rate Sensitivity

We had significant interest in our recent posts on mortgage rate sensitivity in a rising market. One recurring request was for a cumulative view of rate sensitivity. So today we post these views on a segmented basis, using our master household segmentation.

A quick recap, we updated our analysis of how sensitive households with an owner occupied mortgage are to an interest rate rise, using data from our household surveys. This is important because we now expect mortgage rates to rise over the next few months, as higher funding costs and competitive dynamics come into pay, and as regulators bear down on lending standards.

To complete this analysis we examine how much headroom households have to rising rates, taking account of their income, size of mortgage, whether they have paid ahead, and other financial commitments. We then run scenarios across the data, until they trip the mortgage stress threshold.

At this level, they will be in difficulty.  The chart shows the relative distribution of borrowing households, by number. So, around 20% would have difficulty with even a rise of less than 0.5%, whilst an additional 4% would be troubled by a rise between 0.5% and 1%, and so on. Around 35% could cope with even a full 7% rise.

The chart below shows a segment view of this sensitivity. We add the score for each interest rate band. Young Affluent households are most sensitive to rate rises, thanks to large mortgages and static incomes. Young Growing Families are not far behind, but their household budgets are quite different. Other segments are more resilient, though a proportion of Exclusive Professionals are also highly leveraged. This first view takes account only of the owner occupied mortgages.

We can also overlay investment mortgages, and this changes the picture somewhat, when combined with owner occupied statistics. We see that the extra commitments have lifted the rate sensitivity, for example moving Exclusive Professionals from 36% to 54% exposed to a small rate increase.

Overall we see that some households really have very little headroom to cope with rising rates, a symptom of high household indebtedness.  Others are well protected and are also paying ahead.

US Housing Finance Agencies Will Benefit from Cut in FHA Mortgage Insurance Premiums

Moody’s says on Monday, the US Department of Housing and Urban Development (HUD) announced that the Federal Housing Administration (FHA) will reduce by 25 basis points insurance premiums that borrowers pay on single-family mortgages. The premium cut is credit positive for US state Housing Finance Agencies (HFAs) because it will make FHA-insured mortgage loans more affordable to borrowers and increase HFA loan originations. The premium reduction will apply to new loans closing on or after 27 January.

HFAs are charged with providing and increasing the supply of affordable housing in their respective states for first-time homebuyers. The FHA, unlike other mortgage insurance providers, insure loans with loan-to-value ratios of up to 97%, which is key to the HFA lending base, given that first-time homebuyers often have limited funds for down payments.

The 25-basis-point decrease in the FHA’s insurance premium, which we expect will save new homeowners as much as $500 a year, also increases the competitiveness of HFA mortgage products. A lower FHA cost will attract more borrowers and stimulate stronger FHA loan originations at a time when mortgage interest rates are rising. As of 30 June 2016, FHA mortgage insurance provided the biggest share of the insurance on HFA pools, constituting approximately 38% of Moody’s-rated HFA whole-loan mortgages (see Exhibit 1), compared with 17% of mortgages utilizing private mortgage insurance.

HFA portfolio performance will strengthen because more loans will benefit from FHA insurance coverage. FHA insurance offers the deepest level of protection against foreclosure losses relative to other mortgage insurers because they cover nearly 100% of the loan principal balance plus interest and foreclosure costs. Additionally, the FHA provides the strongest claims-paying ability relative to private mortgage insurers. Although private mortgage insurers maintain ratings of Baa1 to Ba1, FHA insurance is backed by the US government.

The reduced FHA premiums will also benefit HFA to-be-announced (TBA) loan sales, which are secondary market sales using the Ginnie Mae TBA market. All loans utilizing Ginnie Mae must have US government insurance, and the FHA provides a substantial share of this insurance. Higher TBA sales will increase in HFA margins given that TBA sales have been a major driver of loan production and volume, contributing to an all-time high 17% margin in fiscal 2015, which ended 30 June 2015 (see Exhibit 2).

Housing affordability is in dire straits

Good article from Julia Corderoy, news.com.au.

THIS map is a homebuyer’s worst nightmare.

It is no secret that housing affordability in many parts of Australia absolutely sucks, especially in Sydney. And it looks like it’s getting worse.

Since 2009, house prices in the Harbour City have almost doubled, rising by 97.5 per cent, according to CoreLogic data. In 2016 alone, Sydney property prices jumped 15.5 per cent.

“Sydneysiders saw dwelling values increase by approximately $10,000 per month over the past year, creating a significant boost in wealth for homeowners; at the same time we’ve seen mounting affordability challenges for aspiring homeowners,” CoreLogic head of research Tim Lawless said.

But new graphs released by the data company show in graphic detail just how hot the property market has been and how many areas have been affected.

The number of Sydney suburbs where house prices are now at least seven figures is astonishing and depressing. Graph: CoreLogic. The red in the graph illustrates suburbs where the median house price is $1 million or above. In December 2011, the red was concentrated in those suburbs within 10km or 20km of the CBD, as you would expect.

Six years ago, only two suburbs outside of a 50km radius of the CBD had median prices of at least seven figures. Most of the graph is coloured bright green or pale green, indicating median house prices of a substantially more acceptable $300,000 to $500,000.

Juxtapose that against December 2016 and the realisation is terrifying. Red is the dominate colour and many suburbs more than 50km from the city have crept into the red zone.

Those green suburbs with homes of $500,000 or less are almost exclusively located in fringe suburbs more than 50km from Sydney’s centre.

Not depressing enough? Buying an apartment isn’t necessarily that affordable now either. In this graph, which compares house prices to apartment prices in Sydney, it shows a considerable number of suburbs more than 10km from the CBD that now have apartment median prices of $1 million or more.

Even the number of suburbs where apartments are reaching $1 million is astonishing. Graph: CoreLogic.

Some suburbs more than 20km outside of the city centre even have apartments with price tags of at least seven figures. In fact, buying an apartment in 2016 doesn’t look dissimilar to buying a house in 2011 — and that’s just a difference of a bit over five years.

Another recent CoreLogic report put Sydney house prices at a whopping 8.3 times higher than annual household incomes and found households were dedicating an average of 44.5 per cent of their income to service a mortgage.

Broadly, a homeowner is considered to be under “mortgage stress” if they have to devote more than 30 per cent of their household income to repayments. So Sydneysiders are paying 1.5 times the amount already considered as being under “mortgage stress”.

But even being able to pay a mortgage on a Sydney home is a luxury, considering high prices are locking people out altogether as they struggle to save the deposit. To secure a mortgage and avoid Lenders Mortgage Insurance (LMI) you need to save a 20 per cent deposit.

This means, according to a recent Bankwest report, the average Sydney couple faces a gruelling 8.4 years of saving to front the deposit on a median-priced home.

Nationally, the average Australian couple spent 4.4 years saving up for a 20 per cent deposit to buy a median-priced house in 2016.

It isn’t just a Sydney problem either, albeit it is the worst in the New South Wales capital. In Melbourne, where house prices rose 13.7 per cent in 2016, prices have increased by a mammoth 83.5 per cent since 2009.

And when it comes to saving a deposit, Melburnian couples aren’t far behind Sydney. They are scrimping and saving for an average of 6.2 years to afford a deposit on a median priced home.

Even house prices in our nation’s humble capital of Canberra have risen by a third (32.6 per cent) post GFC, and 9.3 per cent over the past 12 months.

PRICES TO RISE FURTHER

There has been plenty of debate about the future of Australia’s house prices, particularly in notoriously hot Sydney and Melbourne, and whether it is time for some reprieve. What goes up must come down, right?

Monthly CoreLogic data has shown the rate of growth is easing. The annual rate of capital growth in Sydney, for example, has eased to 15.5 per cent as at December 2016 from its cyclical high of 18.4 per cent annual growth recorded at the end of July 2015.

However, according to research from HSBC released this month, Sydney and Melbourne house prices will rise “solidly” again in 2017.

The bank’s view is that capital city house prices will rise a further 3.4 per cent in 2017 before easing to 1.7 per cent in 2018. And this is in a year in which it expects the Reserve Bank to lift interest rates by 50 basis points to a 2 per cent cash rate.

But while house price growth will remain strong in 2017, HSBC chief economist Paul Bloxham noted the housing construction boom was “now near its peak” with significant falls in building approvals in recent months indicating an impending downturn.

He said we can expect construction will start to drop in late 2017.

“Like ships passing each other in the night, we expect housing construction to start falling around the time that mining investment stops its decline,” Mr Bloxham wrote.

“Australia’s investment outlook is then expected to be supported by mine maintenance and repair, infrastructure investment and the business investment needed to support services exports, such as tourism and education — Australia’s next growth engine.”

HSBC’s forecasting says investment in housing will serve a positive contribution to Australia’s GDP in 2017, with a predicted 4.4 per cent in the year — following a 9 per cent gain in 2016 — but will then fall 5.7 per cent in 2018.

ENDANGERED FIRST HOME BUYERS

So perhaps the collective complaint from millennials that it is much harder to get on the property ladder now than ever before shouldn’t be dismissed so quickly by their Baby Boomer parents as nothing more than a whinge.

According to the latest edition of the Adelaide Bank and Real Estate Institute of Australia (REIA) Housing Affordability Report, released in December, the average loan size to first home buyers increased by 1.5 per cent over the September quarter, to $319,633, thanks to ever-rising house prices.

First home buyers now make up just 13.2 per cent of the owner-occupier market nationally. This is the lowest representation since the Australian Bureau of Statistics (ABS) series was commenced in June 1991 and compares to the long-run average of 18.5 per cent.

All states and territories but two — Queensland and the Northern Territory — recorded decreases in first home buyers over the September quarter 2016.

Speaking of the results, Damian Percy, general manager of Adelaide Bank, likened this dwindling group of buyers to an endangered animal.

“The number of Australian first home buyers decreased by 6.7 per cent during the quarter, to 21,825 — a decline of 5.8 per cent compared to the September quarter 2015. To give this some sense of perspective, the number of first home buyers for the quarter has dwindled to a figure now equivalent to the number of lions believed to be left in the wild,” he said.

And it’s a group of lions which desperately needs to be saved from a bleak future.

“Home ownership is the third leg of the stool — along with superannuation and affordable healthcare — that enables people to enjoy a secure and dignified retirement. It is to be hoped that real solutions will emerge to the affordability issue from this gathering of treasurers, and not just agreeance to keep having more meetings.”

The rest of CoreLogic’s report, which graphs Australia’s other capital cities, will be released in the full report later this month.

Rates set to rise further in 2017 – Mortgage Choice

Mortgage Choice chief executive officer John Flavell believes Australia’s lenders will continue to lift interest rates throughout 2017 against a backdrop of increasing funding costs and possible increases in the local cash rate.

Mr Flavell’s comments come just hours after the US Central Bank announced it would increase its benchmark short-term interest rate.

“Yesterday, the Central Bank said the recent progress of the economy gave them the impetus they needed to increase the Federal Funds rate by 25 basis points to 0.75%.

“The Bank also indicated that the Federal Funds rate could rise by a further 75 basis points throughout 2017 – through three separate rate increases.

“This announcement, combined with the fact that many of Australia’s lenders have started to raise rates across their suite of home loan products, would suggest a cash rate increase by the Reserve Bank of Australia is now more of a possibility than not in 2017.

“The Reserve Bank of Australia had previously stated that the easing bias has passed and the latest changes by the US Central Bank would support this.

“Of course, even if rates rise, it is important for borrowers (and potential borrowers) to keep in mind that interest rates will still be very low by historical standards.

“Any rate rises are likely to be small, which will help keep the cost of borrowing incredibly affordable. As a result, I would expect certain parts of the property market to remain strong.

“Property prices are driven by four key factors: supply versus demand; the cost of credit; access to credit; and overall employment levels.

“Across the country, property demand remains relatively strong. In Sydney and Melbourne specifically, the level of stock coming onto the market has fallen over the last 12 months, with listings in Sydney and Melbourne down 9.4% and 2.9% respectively.

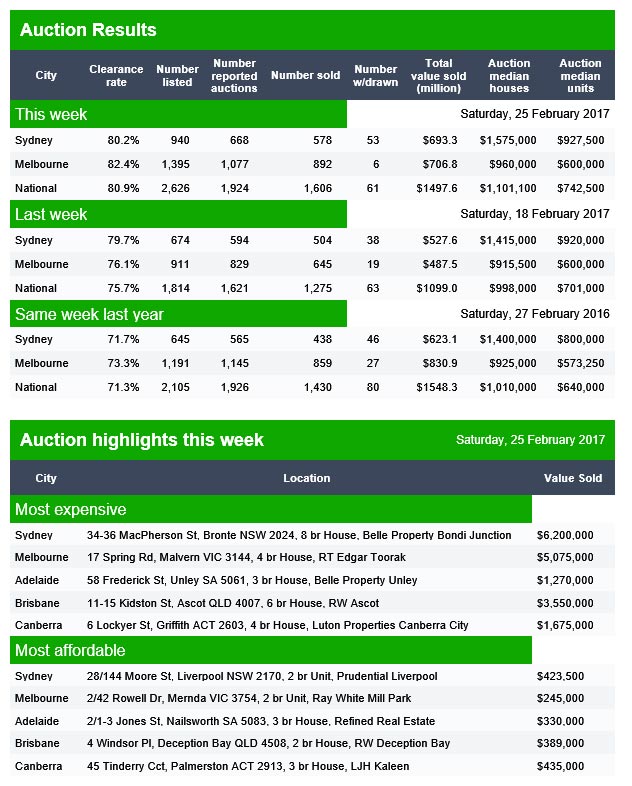
“When you combine falling stock levels with clearance rates above 75%, it is clear that demand remains strong in both of the capital cities.

“Furthermore, despite the latest spate of interest rate increases, home loan rates remain historically low, keeping the cost of credit at affordable levels.

“And, while many of Australia’s lenders have tightened their lending policy over the last 12 months, they remain hungry for business in both the owner occupied and investor space – a trend that will continue as we head into 2017.

“Furthermore, unemployment remains low by long-term standards. Latest data from the Australian Bureau of Statistic shows the unemployment rate is currently sitting at 5.7% – which is a positive sign for the economy as a whole.

“With all of this in mind, I wouldn’t be surprised to see continued growth in property prices across some markets – specifically Sydney and Melbourne. While the level of growth may not be as strong as we have seen in recent years, overall, we can expect to see growth continuing.”

Subdued price growth expected early in 2017 – REA Group

Demand for property on realestate.com.au skyrocketed in 2016, with the REA Group Property Demand Index increasing by 16.2% across the year.  The REA Group Property Demand Index is produced by the REA Group, owner and operator of realestate.com.au.

After peaking in October and November, demand for property dropped slightly to close out 2016, with the index falling 6.6% nationally in December. Victoria saw the largest decline over the month, driven by low levels of demand for both houses and apartments. New South Wales followed closely, suggesting the housing boom may be over, or at the very least slowing quickly, in both Sydney and Melbourne.

Despite December declines, Tasmania, New South Wales and Victoria continue to see the highest levels of demand in Australia with Western Australia and Northern seeing the lowest
While still early into the new year, the easing of demand nationally suggests that the record price rises we saw in Sydney and Melbourne last year are likely to be more subdued as we move further into 2017.

The key drivers of this demand decline are likely due to Australian banks increasing interest rates for buyers independently of the Reserve Bank of Australia in late November and early December and continuing affordability issues across the Eastern seaboard.

Given the RBA has indicated that it may still cut the cash rate further, the banks have sent strong signals that they will respond by not passing cuts onto borrowers and we expect out of cycle interest rate rises by banks to continue. This will be a key issue for borrowers this year, especially first home buyers and investors, with access to cheap money becoming more difficult.

The states which saw the largest declines in demand in December were New South Wales and Victoria. Continued concerns about apartment over supply are starting to cause concern in these markets with demand for apartments dropping by more than 7% in both states.

Western Australia and Northern Territory remain the lowest in-demand markets on realestate.com.au, however Western Australia’s demand index was relatively stable and both states saw an increase in apartment demand. The result suggests that barring any surprising negative economic news or changes to the supply outlook in Western Australia, the bottom of the housing market could be close.

Tasmania continues to see elevated levels of demand and is now the strongest demand market in Australia. Relative affordability is likely a key factor driving interest

Economist’s radical plan to cut bubble lending

From Australian Broker.

To stop the ever increasing levels of debt in Australia, one economist believes that there needs to be a hard reset of private debt levels via a “people’s quantitative easing”.

In an interview with the Australian Financial Review, author and economist Steve Keen, outlined his two-step plan to reduce household debt from current levels of 120% to between 50 and 100%.

The first step involves banks using government cash injections that reduce account holders’ existing debt. Customers with no debt would receive cash.

Keen said this instalment would be a bit larger than the $1,000 stimulus Kevin Rudd offered in 2009.

“In anything like this, which hasn’t been tried before, I would want to do it in small doses,” he told the AFR.

Radical yet simple reform of the banking sector would then be required, he said.

“What I want to do is bring in a range of bank rules which would limit the amount of lending you can give against an asset to some multiple of the income-earning capacity of the asset.”

For instance, banks could put a loan limit of $500,000 on an estimated annual rental income of $50,000. This ensures that the bidder for the house with the most savings who is more capable of handling the debt comes out as the winner.

“I want to cut off the asset bubble lending. When you look at the empirical data, overwhelmingly it’s leverage that determines asset prices. You have this positive feedback loop between lending and asset prices and that’s how you get the bubbles we’ve got. These guys are making money by creating Ponzi schemes.”