Auctions Clearance Rates Higher, Again

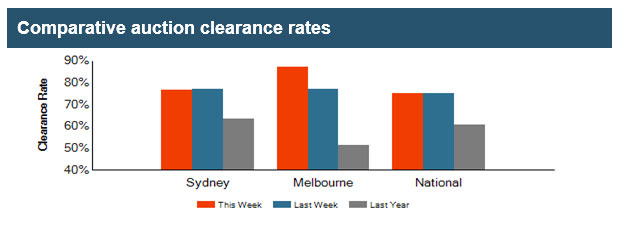
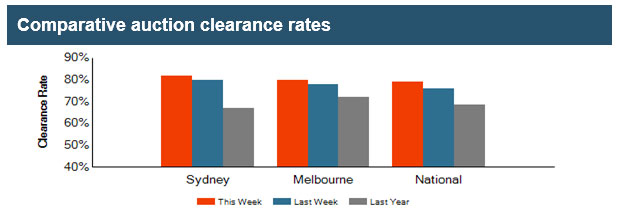
According to CoreLogic, the preliminary clearance rate rose this week, up from last week’s 67.9 per cent to 73.9 per cent.

The level of activity across the capital city auction market also increased this week, with 1,585 auctions held compared to 1,329 auctions last week.  Despite the week-on-week rise in activity, the number of auctions held this week continues to track lower than the corresponding week last year when 1,903 auctions were held, however, the difference in clearance rate (74.6 per cent) was minimal.  In general, winter is typically a quieter season for auctions prior to the ramp up in Spring, and over the past nine weeks, the volume of auctions held across the combined capitals has been around 20 per cent lower than what was seen over the comparable time frame last year, largely driven by less properties being taken to auction across the Sydney market, despite the ongoing strength in the clearance rate.

20160801 capital city

The Ongoing Allure of Investment Property

We continue the results from the latest Digital Finance Analytics household surveys, by looking at property investors, who now make up around 35% of all residential property borrowers. This is much higher than in any other similar economy (e.g. UK 17%). The appetite for investment property is still strong, and despite some tightening of lending criteria and slowing capital growth momentum, investors still wish to transact. Bank lending to investors in June 2016 rose by 0.1% or $0.6 billion.

As a reminder, we showed that investors (either those with one or two properties – solo investors, or those with a portfolio of properties – portfolio investors) were the most likely to purchase, even compared with those seeking to refinance.

DFA-Survey-Jul-2016---TransactThe driver to transact relate firstly to the tax effectiveness of the investment (37%) and capital gains from appreciating property values (25%). Low finance rates are helping, and investment property is perceived as offering better returns than bank deposits or stocks. We know that many in the eastern states will not make positive pre-tax returns, but taking tax breaks into account, they are still ahead, and will remain so unless there is a significant fall in home prices.

DFA-Survey-Jul-2016---All-InvThere are some barriers which investors have to negotiate, the most obvious is they have already bought (40%), potential changes to regulation (25%), and inability to get financing (15%). Risks relating to budget changes have dissipated, and some are concerned about static or falling rents (bundled in the other category at around 5%).

DFA-Survey-Jul-2016---Inv-BarriersSolo investors have similar drivers with a focus on tax efficiency and potential capital gains, supported by low finance rates. We note that they have lower expectations of future gains than other investors (portfolio and those investing via SMSF).

DFA-Survey-Jul-2016---Solo-InvLooking in detail at SMSF property investment, tax effectiveness, leverage and potential capital gains all drive the decisions. We did note some concerns about changes to superannuation regulation, especially around the caps, but this has not deterred prospective purchasers.

DFA-Survey-Jul-2016---Super-InvThere are about four percent of SMSF’s holding residential property, and typically it comprises just a proportion of the total fund. A further three percent are actively considering adding in property to their SMSF.

DFA-Survey-Jul-2016---SMSF-ShareIt is also worth noting that mortgage brokers are becoming more influential in providing advice to trustees seeking SMSF advice, alongside accountants. Internet forums and web sites still play a significant role in providing advice to trustees. 17% say they know enough, and rely on their own knowledge and experience.

DFA-Survey-Jul-2016---Trustee-Advice Finally, we highlight the “honeypot effect”, where interstate investors prefer to buy in the more buoyant states of NSW and VIC, than in their home states. We discussed this in detail in a previous post.  And of course some first time buyers are going direct to the investment sector.

So, investors will continue to sustain the market, and should the RBA cut rates again tomorrow, we should expect additional momentum, thanks to lower funding costs and paltry returns from bank deposits. Property investors are making logical decisions, given past performance, but at some point the tide just has to turn. But at the moment, returns from property simply outperforms other investment classes, and are perceived to be “as safe as houses”.

Next time we will round out the survey results by looking at some of the other property active segments.

Today’s Auction Results

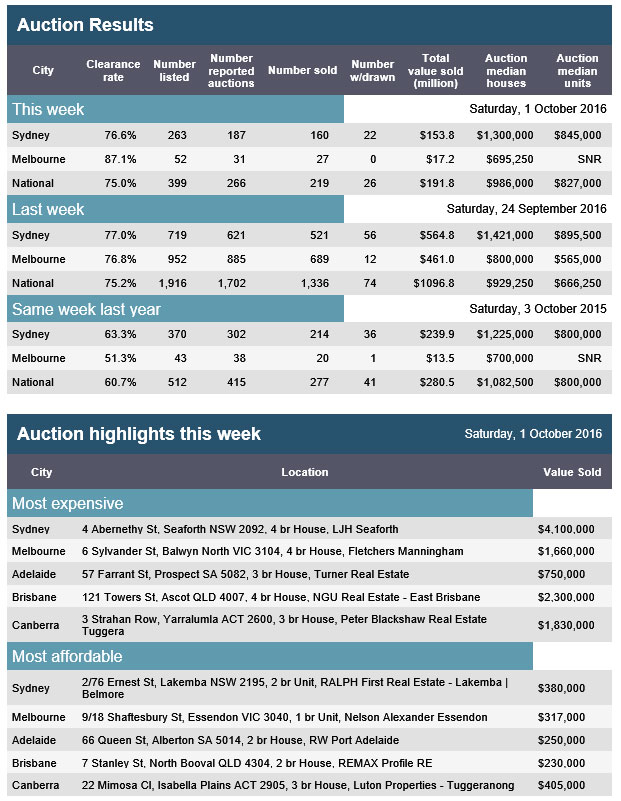
APM PriceFinder’s residential auction summary for Saturday 30 July 2015 continues to underscore momentum in the property market, especially in Sydney and Melbourne.

Nationally, clearance rates were 73.1% on 1,285 properties, compared with 66.9% on 989 listing last week. A year ago, there were 1,488 listing and 74.9% cleared.

APM-30-Jul-16In Sydney, clearance was 75.7%, compared with 70.3% last week, and 76.1% a year ago, though on lower volumes. Melbourne cleared 75.7% of 675 listed, compared with 67% last week, and 76.9% on 651 properties a year ago. Adelaide achieved a 60% clearance on 83 listings. Brisbane listed 101 properties and cleared 50%.

APM-30-Jul-16-1

First Time Buyers Still Determined But Under The Gun

Continuing our series on the latest Digital Finance Analytics household survey results, today we turn to those wishing to enter the property market for the first time.

Looking briefly at those wanting to buy, but are not able to at the moment (about 1.1 million households, down from 1.3 million last year), whilst fear of unemployment and interest rate rises continue to dissipate, home prices are just too high relative to their income, to consider market entry. This is also influenced by their costs of living, and an inability to get finance. We also note a rise in “other factors”, which include needing to get finance help from family or friends.

DFA-Survey-Jul-2016---WTB-BarriersTurning to those actively seeking to enter the market in the next year for the first time (about 312,000 households), we see that more are motivated by potential future capital growth than needing a place to live. In addition, tax advantage was cited by around 15 per cent of first time buyers as a key driver, whilst access to the first home owner grant has become ever less important.

DFA-Survey-Jul-2016---FTB-MotivationsLooking at the barriers to purchase, first time buyers say that high home prices remains the most significant barrier, and as a result just finding a place to purchase is a challenge. Whilst fear of unemployment and the impact of rising interest rates have reduced, more are saying that availability of finance is an issue now as lending criteria are tightened.

DFA-Survey-Jul-2016---FTB-BarriersWell over 20 per cent of first time buyers are not sure what, or where they will buy. More are likely to buy a unit than a year ago, and less likely to buy a house.

DFA-Survey-Jul-2016---FTB-WhatWe also continue to see a proportion considering buying an investment property, perhaps a cheaper property in an area they do not want to live in, as a way to enter the market, and participate in potential capital growth. This may be the key to an owner occupied purchase later.

DFA-Survey-Jul-2016---FTB-TypeWe publish monthly data on the number of first time buyers who go direct to the investment sector from our surveys and overlay this on the ABS data. Around 4,000 are buying each month. The ABS data also shows the number of first time buyers is rising, to May 2016, though still well below the peak.

May-2016-FTBNext time we will do a deep dive on the investment property sector.

Property Purchase Expectations Are Still Strong

Today we continue our discussion of the latest Digital Finance Analytics household surveys, which looks in detail at intentions to purchase property in the next 12 months. This includes data up to late July, so is clear of potential election impacts. The analysis uses a large sample size, so is statistically robust. We use a segmentation model to flush out the main differences between household types. This is described in our publication “The Property Imperative” which is available on request. These results will flow into the next edition later in the year.

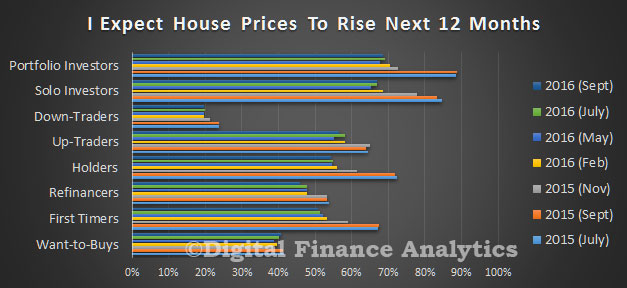
We start with some cross-segment comparisons. First, we find that households are just a little less confident house prices will rise in the next year, compared with 12 months ago. However, around half of all households still believe price growth will roll on. Property investors are the most optimistic, whilst those seeking to sell-down, the least.

DFA-Survey-Jul-2016---PricesLooking next at whether households expect to transact, we find that investors are mostly likely to make a purchase, but there is a continued rise among those wanting to refinance. 40% of those seeking to refinance expect to do so in the coming year.

DFA-Survey-Jul-2016---TransactTurning to borrower expectations, first time buyers, those trading up, and portfolio investors are most likely to seek additional mortgage funding. In fact, as interest rates have fallen, demand is even stronger.

DFA-Survey-Jul-2016---BorrowThose saving to assist in a purchase are mainly confined to households who are yet to transact, or who are trading up. More than 70 per cent of first time buyers wishing to purchase, continue to save.

DFA-Survey-Jul-2016---SavingWe will look in more detail at the forces which are driving investors in a later post, but this summary chart gives a good flavour of what we found. Tax efficiency is the single most powerful driver, and property capital appreciation is also important. Together these are perceived to give better returns that from deposits (in this low interest rate environment).  Around 15 per cent of investors cited the low finance rates currently available.

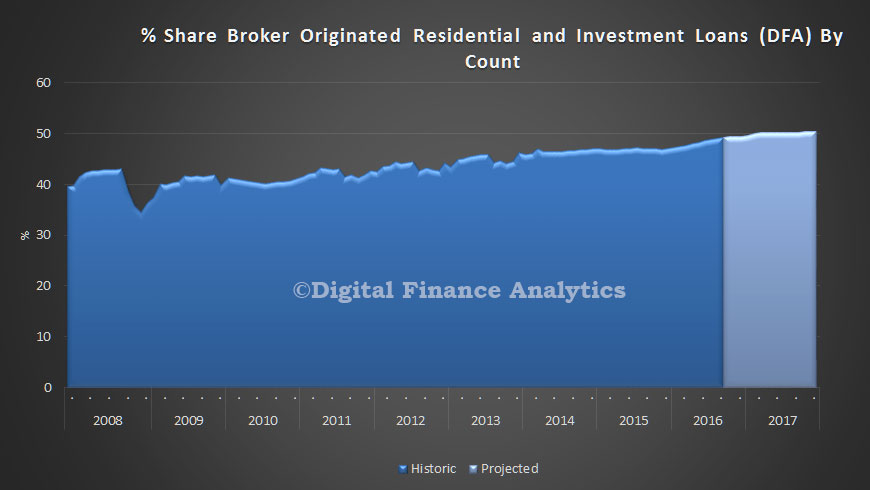
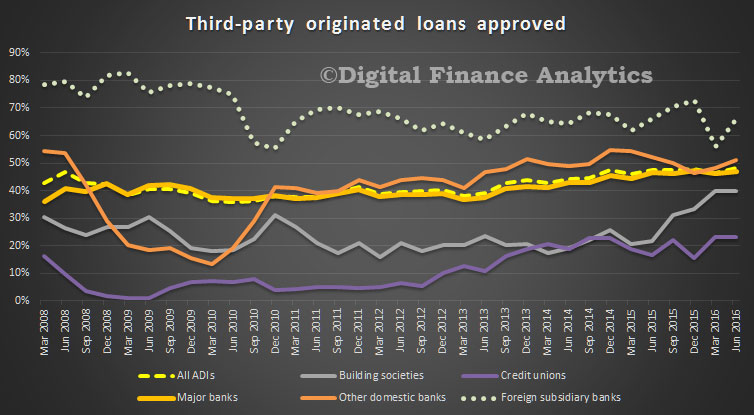
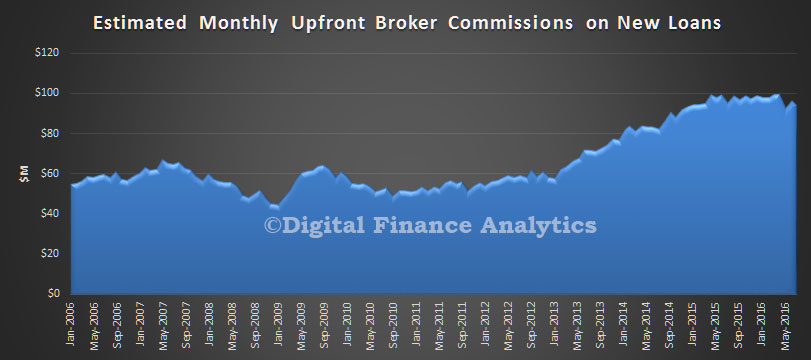
DFA-Survey-Jul-2016---All-InvFinally, in this post, we look at which household segments are most likely to use a mortgage broker. Given that half of all new transactions are originated via this route, understanding which customer groups are most likely to reach of advice is important. Those seeking to refinance are most likely to transact via a broker.

DFA-Survey-Jul-2016---Broker Next time we will look at some of the more detailed segment specific analysis. But in summary, whilst property transaction, and lending volumes may be falling, there is still strong demand for property. This will provide ongoing support for prices in the coming months, and also suggests that households will be seeking deals from lenders. There is life in the old dog yet!

Auction Action Shows Market Distortions

CoreLogic’s data on auction clearances shows that markets remain firm with the combined capitals preliminary clearance rate remaining higher than 70 per cent for the third week running.

This week 1,295 auctions were held across the capital cities, with 1,076 reported results so far.  The preliminary clearance rate of 70.7 per cent is roughly the same when compared with last week’s result which showed 70.5 per cent of the 1,391 capital city auctions cleared.  Melbourne and Sydney are once again showing the strongest clearance rates of 72.4 per cent and 75.3 per cent respectively.  In terms of auction volumes, both Sydney and Melbourne recorded a lower number of auctions this week when compared to last week, while across the remaining capital cities the auction markets were varied.   At the same time last year, the number of auctions held was still substantially higher (2,143) with a success rate of 74.7 per cent.20160725 capital city

A total of 2 auctions have so far been reported with 1 successful result for Tasmania. Across Perth, there were 21 auctions held this week with a preliminary clearance rate of 42.9 per cent. There were 68 auctions in Adelaide and a preliminary clearance rate of 71.8 per cent, whilst in Brisbane there was 135 auctions with a preliminary clearance rate was 53.2 per cent.

New Zealand Banks Will Benefit from Tighter Rules on High-LTV Mortgage Loans – Moody’s

According to Moody’s, New Zealand banks will benefit from tighter rules on high-LTV mortgage loans.It is also worth noting how the market responded to earlier less aggressive macroprudential measures.

On 19 July, the Reserve Bank of New Zealand (RBNZ) released a consultation paper outlining a proposal to limit bank lending to home investors at loan-to-value ratios (LTVs) above 60% to 5% of new originations and lending to owner-occupiers at LTVs above 80% to 10% of new lending. These restrictions are credit positive for New Zealand banks and their covered bond programs because they reduce their exposures to higher-risk lending at a time when house prices are at historic highs.

The proposal will be particularly beneficial to New Zealand’s four major banks, ANZ Bank New Zealand Limited, ASB Bank Limited, Bank of New Zealand and Westpac New Zealand Limited. These four banks hold approximately 86% of all New Zealand residential loans.

The tighter restrictions on LTV limits will benefit banks and their cover pools by providing a buffer against declining house prices before the size of the loan exceeds the value of the property. In the longer run, banks will have fewer high LTV loans to sell into their cover pools, which will strengthen the pools’ credit quality.

The new rules would replace existing limits that restrict new lending to investors in Auckland at LTVs greater than 70% to 5%, lending to owner-occupiers in Auckland at LTVs above 80% to 10%, and all other housing lending outside of Auckland at LTVs above 80% to 15%. The proposal is in response to the boom in New Zealand house prices, which are at historical highs, creating a sensitivity to a sharp reversal in home prices.

Moody-NZ1Although LTV restrictions protect banks against a sharp correction in house prices, it remains to be seen how effective these measures will be in moderating house price appreciation if interest rates decline further. In March 2016, the Reserve Bank of New Zealand reduced its policy rate by 25 basis points to 2.25%, the fifth reduction since June 2015, while also stating that further policy easing may be required. Furthermore, strong immigration and supply shortages continue to support house prices, particularly in Auckland.

The first of New Zealand’s macro-prudential measures, introduced in October 2013, had a sharp but temporary effect on house price growth. Further measures were introduced in 2015 that also immediately reduced house price growth in fourth quarter of 2015. However, prices rebounded and have appreciated in 2016.

Moody-NZ2 The Reserve Bank of New Zealand is inviting market feedback on its proposal until 10 August, after which, a final policy will be released to take effect from 1 September 2016.

Auction Clearances Up Again

According to the APM PriceFinder, clearance rates remain strong, especially in the eastern states, although compared with last year, sales volume is down. The auction results today shows a national average clearance rate of 73.9%, compared with 71.2% last week. Sydney achieved a rate of 77.2%, higher than this time last year (76.9%) and last week (71.5%), although the number of properties offered was 357, compared with 715 last year. In Melbourne, 476 were offered, compared with 735 on the same weekend last year, and 74.2% were cleared compared with 75.6% last week, and 75.1% last year. Adelaide achieved a 75% clearance on 52 listed, Brisbane achieved 52% clearance on 79 listed and Canberra achieved 74% clearance on 29 listed properties.

APM-23-Jul-01APM-23-Jul-02

The Investment Property Honeypots

We have just finished updating our household surveys, and over the next few days we will be running through some of the key findings which in due course will flow into the next edition of the Property Imperative.

We start with an observation which, is at one level completely logical, yet at another level is surprising. We have been asking prospective property investors whether they are planning to purchase in the next twelve months, as usual. There is still strong appetite, thanks to strong returns, tax incentives and low interest rates. However, we have also asked about which state they were expecting to purchase in, and we have found some significant variations across the states. We conclude that NSW and VIC are investment property honeypots, attracting both local and interstate interest, especially from WA. Another reason why prices are on the rise here.

The first chart shows the relative proportion of property investors in each state, who expect to purchase in their home state. Almost all NSW based investors are expecting to buy in NSW, and those in VIC, mainly in VIC. But there are more residents in QLD, SA, ACT and WA who are expecting to buy interstate than in their home states.

Investor-Interstate-1We then asked those considering interstate transactions, to identify their likely target state. In NSW, the small number considering interstate investment picked VIC, whilst residents in VIC going interstate will pick NSW. Across the other states, the majority of those seeking investments interstate will pick NSW, or second VIC. A smaller number would also select ACT. These three states captured the bulk of the interstate attention.

Interstate-Investor-2Finally, we asked about the drivers of this decision. The prime driver related to increased capital returns, a larger property market, lending criteria and rental returns.

Investor-Interstate-DriversSo, we can conclude that demand in NSW and VIC for investment property is heightened by interested interstate investors who are attracted by the higher returns in these two states. Further evidence of the two speed housing market.

Sydney’s property shortage fuels ongoing buyer activity

From The Real Estate Conversation.

Sydney’s property auctions make great conversation starters at barbecues because even with the peak of this cycle behind us, the embers burn on. For example, this past week saw 206 sales on 253 auctions for a clearance rate of 76%, according to Domain Group.

The result marked the third week in a row Sydney’s had a clearance rate of at least 75%, a buoyant level of buyer interest despite it being winter.

Houses-UCity wide numbers can be misconstrued in a big city like Sydney, however, where auction results tend to differ between east, west, north and south. For instance, in the last decade or so, there’s been a shift by affluent couples and families toward the city’s inner west and this has seen rapid price growth in suburbs like Haberfield and Concord.

The median house price in both Concord and Haberfield is $1.9m, according to REA Group, which is very high when you consider that the median auction price across the city is usually around $1.1 – $1.2m, as per Domain’s numbers.

Similarly, the upper north is increasingly popular among young families due to schools in the area. This heightened competition is helping fuel capital growth in suburbs where prices were once deemed affordable.

For example, the median house price in St Ives, about 20 kilometres from the CBD, is now $1.75m, almost 100% higher than it was in 2006, as per CoreLogic RP Data. So understanding the popularity of certain pockets like this is crucial to putting those broader numbers in context.

Not enough to go around

Take Corelogic RP Data’s break down of Sydney auctions by sub-region a fortnight ago. It showed that sales rates were strongest in Blacktown (90%), the City and Inner South (87%), Eastern Suburbs (82%), North Sydney and Hornsby (84%), Northern Beaches (91%), Ryde (87%) and Sutherland (89.5%).

All are much higher than the overall clearance rate of 75% and suggest a very distinct problem for Sydney: there simply aren’t enough houses to meet demand where people want to live. It’s a situation that’s inflating median prices and creating a sense of urgency among prospective buyers.

Current listing figures support this. For example, new listings in the month to July 10 were 5,148, down 33% on 12 months ago, CoreLogic RP Data reports. Total listings of 19,087 are down 10% on 12 months ago. Keep in mind that a new listing is one that’s not been advertised for sale over the past six months, while total listings include new listings and properties that have been previously advertised.

Buyers’ agent at Rose and Jones, Stuart Jones says that supply is generally 25 to 35% lower than the same time last year, depending on property type.

He notes that home ownership and rental demand for quality property is particularly high in suburbs within three to five kilometres of the CBD, mostly due to proximity to trains and ferries, schools, hospitals, workplaces and a variety of lifestyle amenities.

“Persistent high prices have primarily been driven by a chronic short supply of quality property in the established markets, that is older suburbs with higher barriers to entry for new supply,” says Jones.

“There are still investors left over from the top of the lending cycle who are finance approved and chasing quality assets. As a result, there is still buyer depth from existing and new entrants in these core markets.”

Jones says that challenges in global markets like stocks and bonds are also helping turn many investors to property.

Cheap money

Of course, many other buyers are simply lured by the idea that getting a home loan has never been easier.

CoreLogic RP Data’s head of research, Tim Lawless says that ongoing growth has been helped by the cheaper cost of mortgages, which has come about with record low interest rates over the last few years (1.75% as of July).

“The challenge for policy makers and regulators will be to ensure lower mortgage rates don’t refuel a higher rate of growth in the Sydney and Melbourne housing markets where affordability is already stretched and rental yields are pushing to new record lows each month,” says Lawless.

While affordability is really a relative term, it bears significant meaning in Sydney, often at those aforementioned barbecues. After all, a median auction price of $1.2m might be considered affordable by some, especially in a city where $2m and $3m price tags have become so normal.