Auction Clearances Continue To Motor

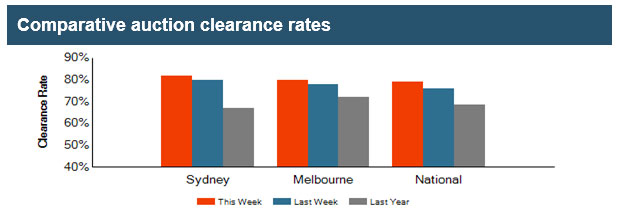
Latest preliminary data from APM Pricefinder shows continued momentum in auction sales today.  Nationally, 1,912 were listed and 78.9% cleared, compared with 75.8% of 1,599 listed last week, and 68.4% on a slightly higher listing last year. Sydney led the way at 81.6%, compared with 79.6% last week on higher volumes.

apm-24-sep-2106-1

Melbourne was also higher at 79.6% on 950 listing, compared with 78% on 793 properties last week. Adelaide 77% of the 86 listed, and Brisbane cleared 53% of the 103 listed. Canberra hit 66% of the 56 properties listed.

So once again, the main action was in Sydney and Melbourne, with clearance rates at extreme levels – who says the market is tanking?apm-24-sep-2106

The ‘Huge Uncertainty’ in Some Australian Apartment Markets

From Business Insider.

Australia is building an extraordinary number of high rise apartments right now. Everywhere you look, there seems to be a new development under construction, especially in Australia’s southeastern capitals.

And, going off recent building approvals data, it seems that there are a whole lot more coming.

Like a number of other commentators, Bill Evans, chief economist at Westpac, is uneasy about Australia’s high rise construction boom, stating in a research note released today that “huge uncertainty prevails in this market”.

The source of this uncertainty, says Evans, is the heavy involvement of Chinese buyers in the market, something that has helped propel the building boom in recent years along with the increased prevalence of housing investors.

“The number of high rise apartments currently under construction in March this year (ABS latest) has surged to 110,000 – including 44,000 in New South Wales; 34,000 in Victoria; and 23,000 in Queensland,” says Evans.

“However, a significant proportion of the buyers are offshore based, so called FIRB buyers,” he adds.

According to a recent survey conducted by ANZ in consultation with the Australian Property Council, foreign investors accounted for 23.9% of all property sales in Australia during the June quarter of 2016. The proportion of sales in Victoria and New South Wales were the highest in the country, accounting for 30.8% and 25.4% of all sales over the same period.

With so many apartments being sold to foreigners, many of them to Chinese, it is clear that much of the residential building boom, and beyond that the outlook for prices, is determinant on the continued involvement of foreign investors.

According to Evans, this creates heightened risks for the sector should the buying start to dry up.

He suggests that recent moves from Chinese policymakers to stymie capital outflows from the country not only heighten risks for apartment prices and settlement on newly constructed apartments, but are also a crucial cog in Australia’s economic transition, the booming residential construction sector.

“At some point, the Chinese authorities, who appear to have stabilised last year’s spectacular near USD 1 trillion loss in foreign reserves, may decide to slow this leakage,” says Evans.

“Certainly we have seen marked evidence of a tightening of capital controls, particularly for the non-corporate sector. That tightening of capital controls might also impact the construction boom.”

Adding to the uncertainty, Evans says that Australian banks have stopped funding FIRB buyers, suggesting that this presents “risks to local developers who may have sold more than 50% of their stock to these buyers”.

“It is generally accepted that apartment buyers in the Melbourne CBD have incurred some capital losses, while Sydney purchasers are seeing their profits squeezed,” he says. “These liquidity and capital loss prospects may discourage foreign buyers, with the result of sharply slowing the apartment construction cycle.”

Evans, like others, is unsure how it will all play out, noting that possible outcomes range “from ongoing spectacular momentum to a sudden liquidity driven slowdown”.

In the case of the latter, he says “one part of the recent boost to Australia’s growth story might fade quickly”.

The sentiment expressed by Evans is similar to that communicated by a growing number of analysts.

In a research note released in early September, Ivan Colhoun, chief markets economist at the National Australia Bank, suggested that the presence of a large numbers of foreign investors in these markets complicates not only the outlook for prices but also settlement risks.

“Recent trends and reports suggest there has been a modest increase in delays in settlement rather than outright non-settlement. And it is typically foreign buyers that are now finding it somewhat harder to access finance and/or expatriate finance (the latter largely from China),” he wrote.

Cameron Kusher, research analyst at CoreLogic, suggested in May that tighter restrictions on overseas buyers from Australian banks was a factor that could amplify settlement risks for newly built apartments in the years ahead.

“Mortgage lenders have recently tightened their lending criteria, subsequently some people who have committed to off-the-plan units may not be able to borrow as much as they could at the time of signing the contract,” said Kusher.

As a result, Kusher noted that there was a clear risk that some properties may be be worth less than the price they were purchased for, heightening settlement risks.

“Many of the units are coming up for settlement in similar locations and will compete with existing unit stock,” he said.

“With so much stock coming online at once there is an increasing concern as to whether settlement valuations will actually meet the contract price of these units.”

Investors Betting On The Property Market

As we look across our latest household research, today we home in on property investors. We showed yesterday there is strong demand from both portfolio investors (those with multiple investment properties) and from solo investors (those with one or two properties). These segments are being motivated by the tax efficiency of the investment (36%), ongoing expectation of property capital growth (25%, compared with 28% a year ago), attractive overall returns compared with deposit accounts (18%) and low financing interest rates (14%). Overall, these drivers have been consistent through the last property boom cycle.

survey-sep-2016-invDrilling into solo investors, we see the same focus on tax efficiency (30%) and the lure of higher returns compared with bank deposits (35%). Indeed, as cash rates have fallen, we have see more switching from cash to property, one of the trends supporting the market.

survey-sep-2016-solo-invThere are a number of barriers to investors, apart from the obvious one of having already bought a property (43%), around 16% of investors are having difficulty getting the funding they need (16% compared with 4% a year ago) as lenders tighten their underwriting standards and income ratios. Fear of changes to regulation have receded from 21% a year back to 11% now. So essentially the main brake on property transactions is tighter standards. Property supply does not appear to be a problem.

survey-sep-2016-inv-barriersWe see a continued rise in SMSF investors adding property to their portfolio, with around 4% of funds holding residential property.  Once again tax efficiency (31%) and appreciating capital values (25%) are the main drivers, supported by low financing rates (15%).

survey-sep-2016-super-invThe proportion of property in a SMSF varies, with 20-40% being the most popular option.

survey-sep-2016-smsf-distFinally, it is worth noting that SMSF trustees are getting their investment property advice mainly from internet sites or forums (21%) or mortgage brokers (24%, compared with 21% a year ago). They also rely on their own knowledge (16%), Accountants (15%) or real estate agents (11%).  Mortgage brokers appear to be more in favour now as a source of guidance.

survey-sep-2016-trustee-adviceSo, in summary the investment sector is still strong, driven by the market fundamentals of expected capital growth and tax benefits, supported by ultra-low interest rates. Tightening underwriting standards make it harder for some to get the finance they require. However, we conclude the property investment boom is still largely intact.

It is worth also reiterating our earlier observation that many prospective investors are being drawn to the eastern states, irrespective of where they live. These “honey pots” are drawing in the bulk of transactions.

Demand For Property “Safe As Houses”

As we finalise the next edition of the Property Imperative, we turn to the latest survey results, looking at household attitudes to property. The growth in volume of loans may be down a little, but their appetite for property is still strong. Recent auction results also underscore this. Today we compare the cross-segment survey responses, before in later posts diving into the more detailed results.

A quick reminder, we use the results from our 26,000 household surveys, and segment the results as described in the “segment cookbook“.

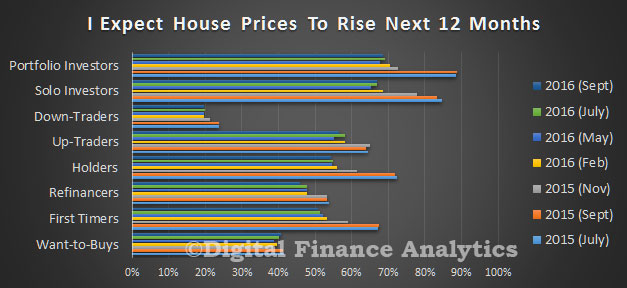
First we look at home price expectations.  Overall households are quite bullish on future capital growth, with portfolio investors most confident (68% expect a rise), 67% of solo investors and 58% of up traders expecting further gains. More than half of holders, and first time buyers also think prices will rise. Down traders are the least positive, here 20% think prices will continue to rise. There were some state variations, but we won’t discuss that here, other than to say NSW and VIC seem most bullish.

survey-sep-2016-pricesDemand for finance is also quite strong, with 92% of portfolio investors looking to borrow more (up from 87% a year ago) and 58% of solo investors up from 51% a year ago also seeking to borrow. Looking at first time buyers, 64% are seeking to borrow, compared with 60% a year ago. Those who are refinancing and borrowing more is also up, 38% compared with 30% a year ago.

survey-sep-2016-borrowInvestors, down traders and refinancers are most likely to transact in the next 12 months. 67% of portfolio investors are looking to buy another property, 49% of solo investors, and 40% of refinancers are in the market. The proportion of first time buyers continues to sit around 9%.  As we will see in later posts, there are more barriers to getting a loan now, thanks to tighter underwriting standards.

survey-sep-2016-transactFirst time buyers are saving hard (despite low deposit account rates and flat incomes), 76% compared with 72% a year ago. The proportion of want to buys (not actively seeking to buy) who are saving is down from 21% a year ago to 19% now. The combination of high prices, tighter lending standards and limited incomes all work against them.

survey-sep-2016-savingFinally, in the overview, those seeking to refinance are most likely to use a mortgage broker (79%, compared with 75% a year ago), then first time buyers (61%) and portfolio investors (51%). Holders apart, down traders are the least likely to seek assistance from a mortgage broker.

survey-sep-2016-use-brokerSo, we are still seeing strong demand for property. The question is whether there is supply of property, and mortgages to meet the demand. Our results also confirm that property investors are back in the game.

Home Prices Rebound To June 2016; Worth $6 Trillion

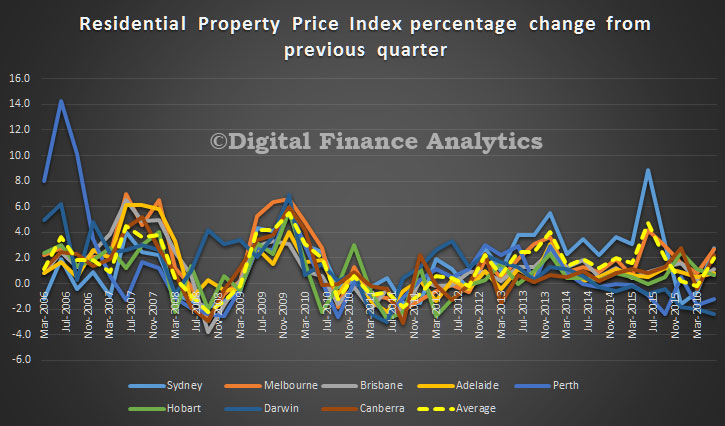
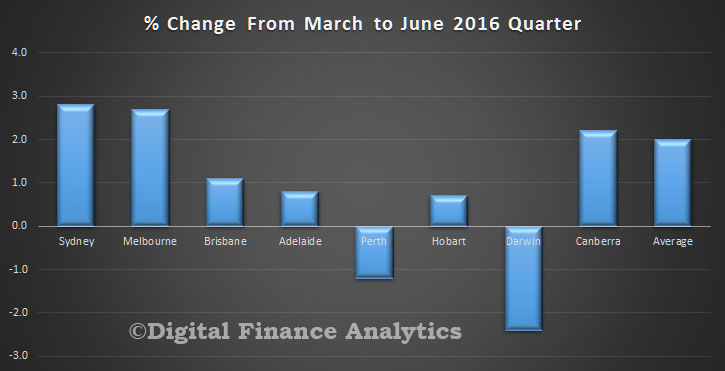
Sydney property prices rose in June quarter 2016 after six months of falls, according to figures released today by the Australian Bureau of Statistics (ABS).

Prices for established houses in Sydney rose 3.2 per cent and attached dwellings rose 2.0 per cent.

Residential property prices fell in Perth and Darwin, while prices rose in all other capital cities.

abs-june-2016-house-prices-trendMelbourne recorded the strongest through the year growth of 8.2 per cent, followed by Canberra at 6.0 per cent.

Established house prices for the eight capital cities rose 2.3 per cent and attached dwellings rose 1.4 per cent in the June quarter 2016.

abs-june-2016-house-pricesThe total value of Australia’s 9.7 million residential dwellings increased $138.3 billion to $6.0 trillion. The mean price of dwellings in Australia is now $623,000.

Government Trumpets Foreign Buyer Clampdown

In a statement today, the Treasurer highlighted further forced sales and fines imposed on foreign investors who have purchased a residential property. The body count is 46, with 400 still under investigation, so the number of actions, and amounts involved are very small, when compared to the whole market.

Investment--PIC

Treasurer the Hon. Scott Morrison has ordered the divestment of a further 16 Australian residential properties that have been held by foreign nationals in breach of the foreign investment framework, taking the total purchase price of Australian residential real estate divested to over $92 million.

“The divestments of these 16 properties, which have a combined purchase price of over $14 million, are further evidence of the Turnbull Government’s commitment to enforcing our rules so that foreign nationals illegally holding Australian property are identified and their illegal holdings relinquished,” Mr Morrison said.

“Foreign investment provides significant benefits for Australia but we must also ensure that such investment benefits all Australians, is in-line with our rules and is not contrary to our national interest.

“The 16 properties were purchased in Victoria, New South Wales, Queensland and Western Australia with prices ranging from approximately $200,000 to $2 million. The individuals involved come from a range of countries including the United Kingdom, Malaysia, China and Canada.

“The foreign investors either purchased established residential property without Foreign Investment Review Board approval, or had approval but their circumstances changed meaning they were breaking the rules.

“Since taking office in 2013, the Coalition Government has forced foreign nationals to divest a total of 46 properties. Under the previous Labor government, no foreign nationals were forced to divest illegally held Australian property.

“These divestments are a reminder that the Coalition Government’s increased compliance measures, which include transferring responsibility for residential real estate enforcement to the Australian Taxation Office (ATO), are working to ensure our foreign investment rules are being enforced.

“Since the Government’s transfer of responsibility to the ATO for compliance in May 2015, over 2,200 matters have been referred for investigation. Through information provided by the public, together with the ATO’s own enquiries, approximately 400 cases remain under active investigation.

“Since a new penalty regime was introduced from 1 December last year, 179 penalty notices have been issued, totaling over $900,000. Penalty notices have been issued to people who have failed to obtain FIRB approval before buying property as well as for breaching a condition of previously approved applications.

“Illegal real estate purchases by foreign citizens attract criminal penalties of up to $135,000 or three years’ imprisonment, or both for individuals; and up to $675,000 for companies. The new rules also allow capital gains made on illegal investments to be forfeited.

“In addition to divestments, a number of people came forward during the reduced penalty period who were not in breach and some who voluntarily sold their properties while the ATO was examining their case. There are at least 25 examples of foreign investors self-divesting in this way showing a change in behaviour towards more compliance with the rules and a strengthening of the program overall.

“While Australia welcomes foreign investment, foreign investors must comply with our laws,” Mr Morrison said.

Higher Auction Clearances Confirmed

According to CoreLogic, based on preliminary results, the combined capital city clearance rate rose this week, from 75.4 per cent last week to 77.9 per cent.

This week, the clearance rate across the capitals is higher than one year ago, when 69.9 per cent of reported capital city auctions cleared. There were 2,093 capital city auctions held over the week, similar to the 2,062 last week, but lower than one year ago, when, despite lower clearance rates, the spring market was in full force, with over 2,500 auctions held across the combined capitals. This week last year represented the 7th consecutive week of capital city auction volumes being over the 2,000 mark, while over the past seven weeks, only three weeks have seen more than 2,000 auctions across the capitals.


20160919-capital-cityThis aligns with the APM data already posted, though there are some variations.

Probability of Mortgage Default – Latest Estimates in 3D

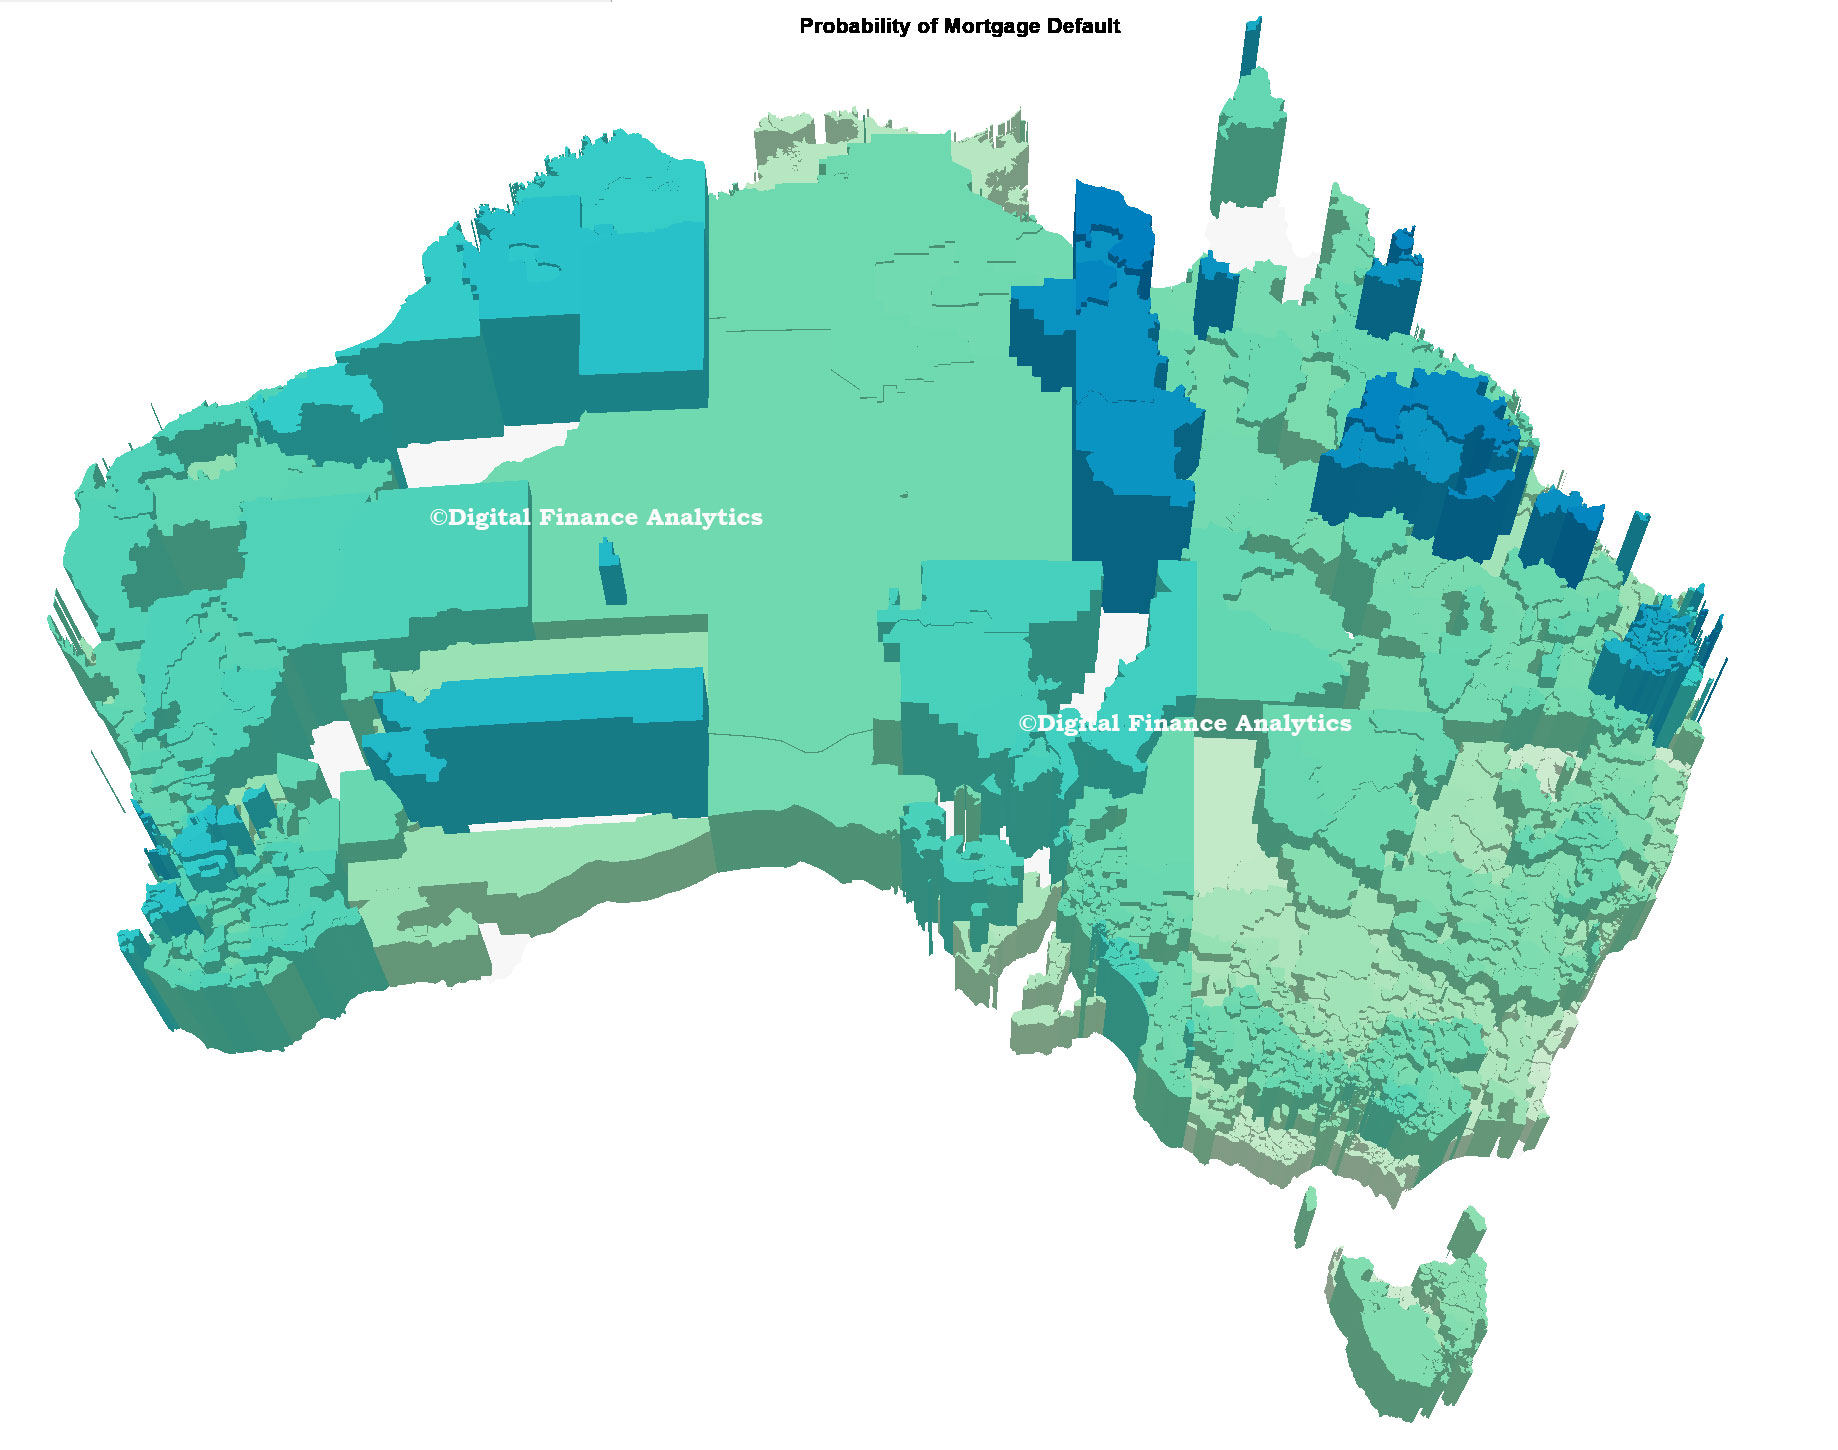
As we finish our series on deep analysis of mortgages by LVR, DSR and LTI, we have incorporated the latest household survey data into our probability of mortgage default modelling by post code.  The national average is 1.3%, but it rises to more than 3% in some places.

We take the DSR, LTI and LVR data, and overlay the mortgage stress and state-level economic indicators to estimate the likely relative probability of mortgage default.  We also overlay assumptions on the RBA’s cash rate, expected mortgage rates, income growth and employment. This all gets mashed to derive a percentage estimate of default by post code.

We have mapped this into a 3D view, which clearly shows that the higher levels of default in coming months will emanate from QLD and WA, as the mining sector rotation continues. On the other hand, NSW and VIC are relatively benign as ultra-low interest rates continue to protect many households with large mortgages. The greater the height of the post code, the higher the risk of default.

prob-default-sept-2016One striking final conclusion. If you compare this picture with the DSR 3D view from yesterday, you will see that DSR and probability of default are only somewhat linked. There are a bunch of other factors which shape the likely loss outcomes.


How Airbnb is reshaping our cities

From The Conversation.

Infrastructure in our cities – let’s call it the hardware – remains much the same as ever, but the software – the way we use it – is transforming rapidly. One piece of that software, Airbnb, is dramatically reshaping the world’s cities.

The digital platform allows citizens to find and rent short-term accommodation from other citizens. Airbnb has the potential to rupture the traditional spatial relationship between tourist and local, making our cities more vibrant and diverse places to live in and to visit.

The question is: what opportunities and dangers does the platform present? What are the implications of repurposing existing residential infrastructure for short-term accommodation? What happens when the global “sharing economy” meets a city’s suburbs?

Lessons from an early adopter

Melbourne was an early adopter of Airbnb. It is also one of the top 10 cities for global travellers on Airbnb. What insights can be gathered from its experience?

According to Airbnb, three-quarters of listings worldwide are outside major hotel districts. Airbnb has three types of property listings: entire homes, private rooms and shared rooms.

Concentration of Airbnb entire-house rentals in Melbourne. Jacqui Alexander & Tom Morgan, Author provided

Entire homes make up over half the total number of Melbourne’s metropolitan listings. Data collected in January 2016 reveals that their distribution is relatively consistent with that of hotels and licensed accommodation, which exist in large concentrations in the CBD and inner city. Many hosts who list entire homes lease or sublet when they go away.

In Australia, tenants require permission from their landlord to sublet, so there is little risk for the landlord if they follow due process. But analysis by website Inside Airbnb indicates that about 75% of entire-house listings in Melbourne are available for over 90 days per year. Hosts with multiple properties manage about a third of all the entire-house listings in Melbourne. These operators hold an average of three properties, but some have dozens. Through Airbnb, these brokers are turning existing housing infrastructure into informal, distributed hotels while saving on capital costs, overheads and wages.

Globally, the Airbnb phenomenon has been blamed for driving up rents, accelerating gentrification and displacing local residents by reducing available housing stock. In Melbourne, the boom in high-density development in the CBD has resulted in an excess of homogeneous apartment dwellings. Bedrooms without natural light, as well as insufficient floor area, outdoor space and storage space, characterise many of these developments, rendering them effectively unlivable for long-term residents. But these properties are attractive to itinerant tenants seeking affordable inner city accommodation.

Concentration of Airbnb shared-room rentals in Melbourne. Jacqui Alexander & Tom Morgan, Author provided

Shared rooms in Melbourne constitute only about 2% of all listings, but they are almost exclusively confined to the CBD. Box Hill (14 kilometres east of Melbourne), and Maidstone/ Braybrook (eight kilometres west of Melbourne) are secondary outlying hotspots. The majority of CBD listings are around new apartment towers near Southern Cross Station (at the western end of the CBD) and RMIT University.A number of already small two-bedroom apartments in the Neo200, Upper West Side and QV1 towers are operating as gendered dormitories. These often sleep eight, with four to a room. Overloading these apartments creates potential fire-safety and hygiene-compliance issues.

Short-term letting via sites like Airbnb allows investors to earn up to three times the amount they’d receive in rent (the average cost to rent an entire home is AU$189 per night). Travellers benefit from competitive accommodation rates, cooking facilities, convenient locations and access to private pools and gymnasiums intended for residents.

Airbnb acknowledges that professional hosts with multiple listings are exploiting the so-called sharing economy, but has not yet taken steps to regulate this. Governments would do well to implement the long-awaited and much-needed minimum design standards for apartments to curb the construction of developments in the city that fail to cater for residents or which are purpose-built for the Airbnb market (a few local examples are already emerging).

Beyond the obvious need to protect the amenity of citizens, protection of the liveliness and heterogeneity of the city is essential to maintain the kind of “authentic” experience that appeals to Airbnb users in the first place. Melbourne is beginning to follow the trajectory of international cities like London where the investor market, fuelled by capital gains tax exemptions, has pushed residents further and further out. Dispersing the concentration of entire-house and private-room rental is vital.

Concentration of Airbnb private room rentals in Melbourne. Jacqui Alexander & Tom Morgan, Author provided

More promising is the dispersed pattern of private rooms in Melbourne. These represent around 45% of listings across the city. While private rooms are still concentrated in and around the CBD, diffuse listings across Melbourne’s middle-ring suburbs realise Airbnb’s ambition to enable access to the everyday spaces of cities. This pattern makes sense given the mismatch between Australian house sizes, which remain the largest in the world, and changing household structures – most significantly, the decline of the nuclear family. An increase in housing diversity in the middle-ring suburbs is likely to facilitate more entire-house listings in these areas in the future.

We are also seeing evidence of Airbnb driving housing diversity. Annexed and granny-flat configurations are commonly listed in suburbs close to the Melbourne CBD like Brunswick and Caulfield. Loose-fit arrangements like these provide more flexibility to cater to both residents and visitors, and the by-product is slow but genuine “bottom-up” densification.

Government incentives for this kind of small-scale development would help to make this a viable (and, for many, welcome) alternative to densification through high-rise apartment development.

In 2015, Tourism Victoria entered into an agreement with Airbnb Melbourne to promote buzzing inner-city suburbs Fitzroy and St Kilda as “sharing economy” hotspots. But the cost of renting in these suburbs is already exorbitant. Fitzroy was named the second-most-expensive suburb in Melbourne for apartment rental in 2015.

Instead, policymakers could encourage disruption in the suburbs that would benefit both sides.

What can be done to capture local benefits?

Airbnb claims that tourists who use the platform “stay longer and spend more”. Through taxation and additional revenue from the sharing economy, governments could fund more extensive and efficient transport networks to service both locals and visitors. Extending transport infrastructure would support the intensification of distributed neighbourhoods and maximise intermingling between tourists and locals.

Airbnb rentals in Perth. Jacqui Alexander, Author provided

Bottom-up densification could also be a way forward for Perth. The distribution of Airbnb accommodation towards Perth’s coastal suburbs highlights potential in this space: here, tourism-specific and local infrastructure can converge. This is an exciting prospect for a state that positions itself as a unique travel destination.

Airbnb emerges from the same cultural tendency as the pop-up shop and interim-use place activation. Built environment professionals must recognise it as an urban issue and lead with a framework for targeted, productive disruption.

Airbnb can increase the density of people within existing building stock, while dispersing the positive effects of the tourist economy. This requires more imagination from planners and designers, who first and foremost must consider the interests of individual citizens, whether they are renters or home owners.

Can Airbnb be a part of the solution of increasing urban infill without compromising a minimum standard of living?


The Conversation is co-publishing articles with Future West (Australian Urbanism), produced by the University of Western Australia’s Faculty of Architecture, Landscape and Visual Arts. These articles look towards the future of urbanism, taking Perth and Western Australia as its reference point. You can read other articles here.

Debt Servicing Ratio 3D Mapping Highlights Mortgage Hot Spots

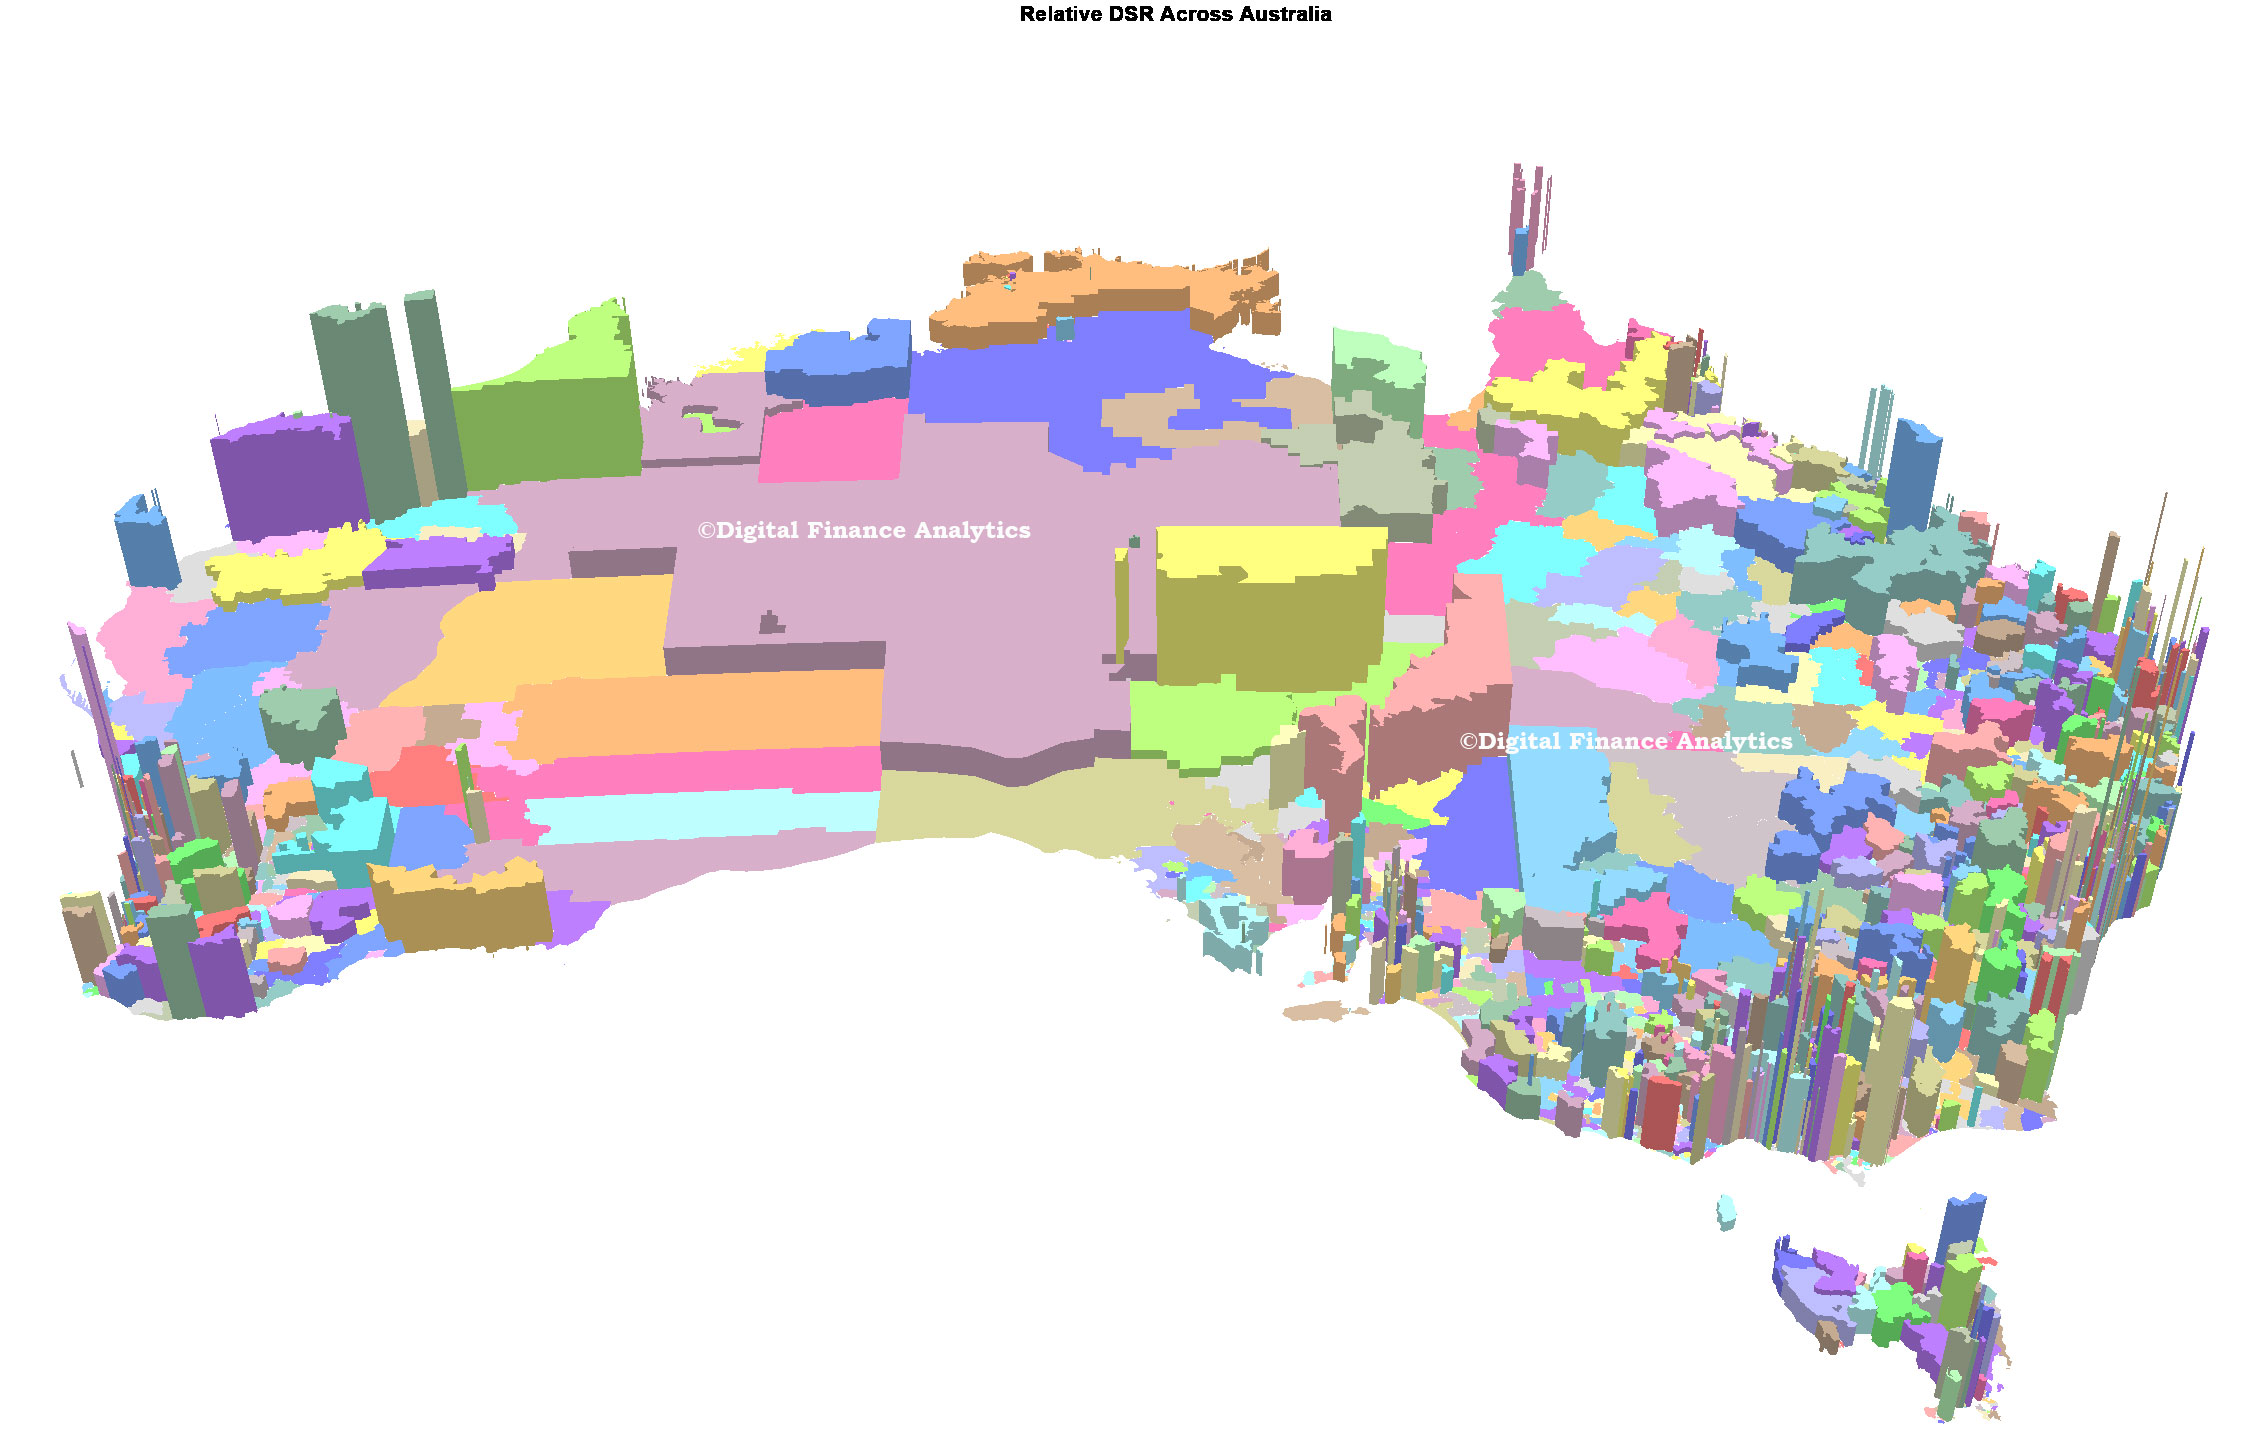
Continuing our detailed analysis of mortgage LVR, DST and LTI across Australia, using data from our houshold surveys, today we feature a 3D map of relative Debt Service Ratios (DSR) by postcode. There are some interesting variations. The greater the height, the higher the DSR.

As we said in our earlier post, DSR is is the ratio between gross household income and the amount paid on the mortgage. More specifically, the DSR is defined as the ratio of interest payments plus amortisations to income. As such, the DSR provides a flow-to-flow comparison – the flow of debt service payments divided by the flow of income. We think the DSR is an important lens to look at households debt footprint, but the ratio is highly sensitive to interest rates because as interest rates fall, the ratio improves. Current DSR ratios are often seen as reasonable because of the current ultra low rates, but of course that tells us nothing about the impact of rising rates later. The average DSR is 16.8, but there is a very wide spread.

oz-dsr-sept-2016