Home ownership remains strong in Australia but it masks other problems: Census data

From The Conversation.

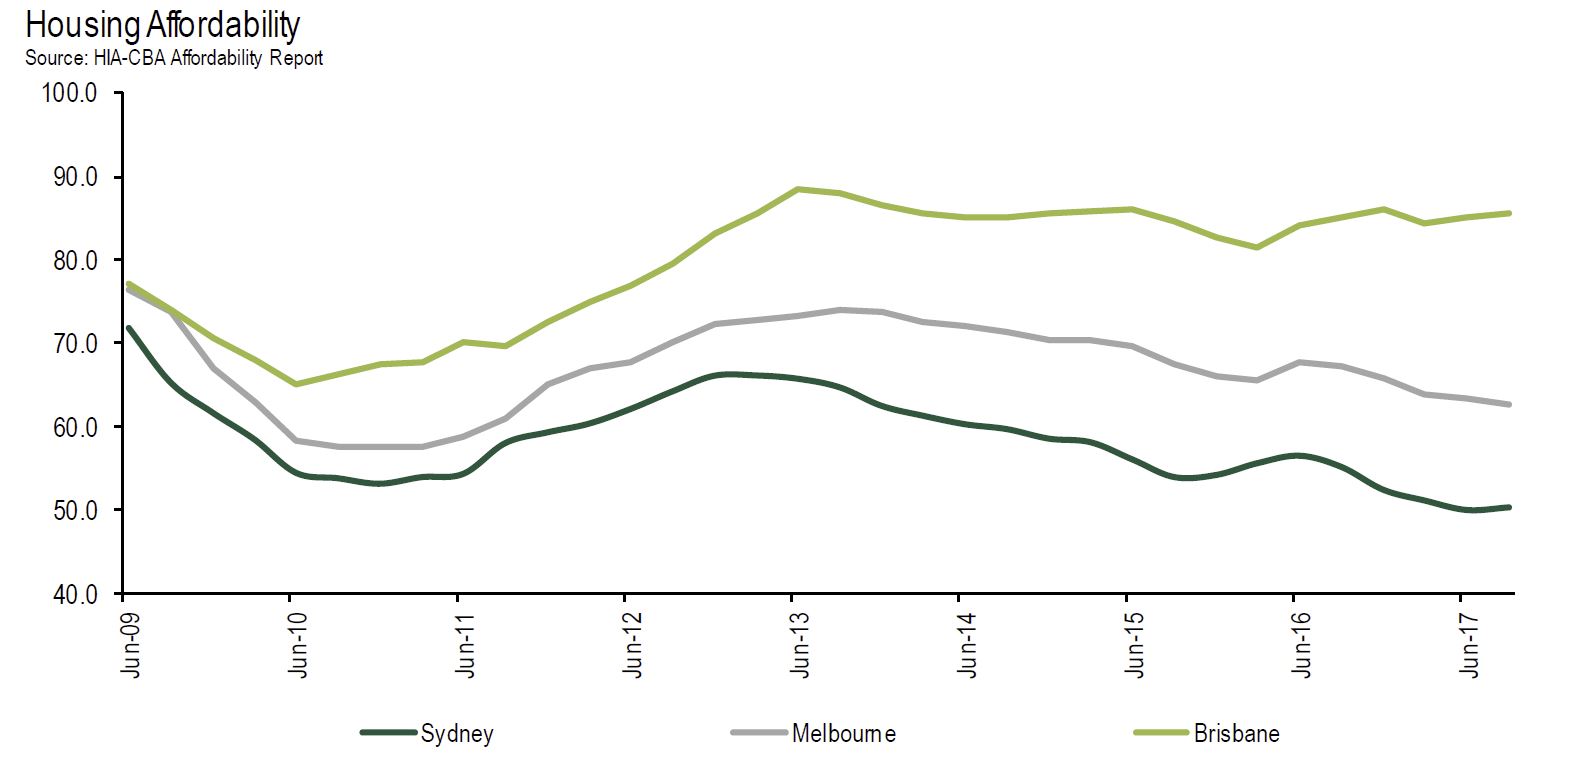
The great Australia dream of owning your own home is still alive despite the various problems plaguing housing affordability, new Census data shows. Even though the overall home ownership trend remains strong, it’s masking other issues.

The latest 2016 Census data assesses what the national home ownership and rental rates are and how these vary location. It also gives us a picture of mortgage and rental costs.

Comparing home ownership rates since the 2011 Census, there’s a slow but steady decline in home ownership rates overall – down by 2.9% from 64.9% of all Australian households in 2006, to 62.0% in 2016. However, 7.4% of households did not state their housing tenure in the 2016 Census. This accounts for some of the variation in reported rates of home ownership decline.

This contraction is nowhere of the scale of equivalent falls in home ownership in the US and UK and New Zealand over the same period.


What’s more interesting than the overall trend, is the greater decline in outright home ownership, involving no mortgage debt, from 31.0% to 29.6% between 2011 and 2016. There’s also a lesser decline in home owners who are purchasing with mortgage debt 33.3% in 2011 compared with 32.4% in 2016.

The opportunity households now have to borrow against their mortgage loans for spending undoubtedly accounts for some of this change. Also contributing to this is home purchasers are less likely to reach retirement age with no remaining mortgage debt, in the same numbers as previous eras.

Another aspect of housing affordability is masked by these numbers – the wide variation in being able to purchase a home according to age and income. Recent evidence indicates would-be-home-owners try various means including very high mortgage debt and moving to outer urban locations away from employment and into smaller dwellings, to be able to buy a house. Some even delay having kids.

Census figures show that for people wanting to purchase a home, a change in state or city location may be an option. According to the data Darwin was the most expensive city to buy in, whereas Hobart was the cheapest for home purchasers.


For households across the income spectrum, 7.2% of purchasers are paying more than 30% of their income on mortgage costs, the data shows. This figure is likely to be far higher among the lowest income (40% of households) for whom such costs place them in housing poverty.

Given the national obsession with investment in private rental, it’s no surprise that the proportion of all Australian households now renting has also increased. Census 2016 results show the private rental sector grew in size, from 20.2% in 2006, to 22.0% in 2011 and to 23.6% in 2016.


In 2016 a total of 2,089,633 Australian households rented privately, either from real estate agents or private landlords.

The growth of the private rental sector largely reflects the high costs of home purchase. Many households who rent have a relative lack of security and control over rental increases.

For those unable to pay rent in the private market, social housing is likely to provide little relief. Census data shows overall rates of social housing declining from 4.7% in 2006 to 4.0% in 2016. In this context, the growth in rates of homelessness in the last decade is perhaps not surprising.

For Indigenous Australians, the housing picture is different. Census 2016 data show among households in which at least one resident is Aboriginal and/or Torres Strait Islander, 12.2% are outright owners, 25.9% are purchaser owners, 32.4% are renting privately. Around a fifth of households, 21.5%, live in social housing, reflecting targeted social housing programs in metropolitan, rural and regional areas.

Overall, home ownership has not changed as dramatically in the last decade, as some would have anticipated. However, it’s likely with the labour market being what it is and the adaptations people are making to try and buy a home, there may be longer-term problems to be seen in future.

Excessive household debt, polarisation of cities into low and high income earning areas and deepening family housing constraints indicate these Census figures likely mask bigger problems. This may translate over time into a more costly social problem, as increasing proportions of households require housing assistance of some form. Australian society could become even more divided on the basis of housing wealth and opportunity, if these trends continue, as we expect they will.

Authors: Wendy Stone, Associate Professor, Centre for Urban Transitions, Swinburne University of Technology; Kath Hulse, Research Professor, Centre for Urban Transitions, Swinburne University of Technology; Margaret Reynolds, Researcher, Centre for Urban Transitions, Swinburne University of Technology; Terry Burke, Professor of Housing Studies, Centre for Urban Transitions, Swinburne University of Technology

Census Shows How We Are Changing

The early data from the latest census, released by the ABS today highlights the momentum in population growth across the nation.

The 2016 Census counted 23,717,421 people in Australia on Census night, which included 23,401,892 people who usually live in Australia– an 8.8 per cent increase from 2011. On Census night, over 600,000 Australians were travelling overseas.

In the last 10 years the population has been growing by  1.7% each year, compared with 1.4% in the prior decade.

1.3 million new migrants have come to call Australia home since 2011, hailing from some of the 180 countries of birth recorded in the Census, with China (191,000) and India (163,000) being the most common countries of birth of our new arrivals.

Strong migration, plus births, and people living to a great age are all putting upward pressure on the numbers.  This momentum is expected to continue putting more pressure on infrastructure and creating more congestion especially in our major urban centres.

The Census found that New South Wales remains our most populous state, with 7,480,228 people counted, ahead of Victoria in second (5,926,624 people) and Queensland in third (4,703,193 people).

Yet it’s the home of the nation’s capital – the Australian Capital Territory (ACT) – that experienced the largest population growth of any state or territory over the past five years, adding more than 40,000 new residents – an increase of 11 per cent.

Located approximately 45 kilometres from the Perth CBD in the woody hills of the Darling Scarp, Serpentine – Jarrahdale showed the fastest regional growth in the country, with a population increase of 51 per cent to 27,000 people – up from 18,000 people in 2011. Gungahlin, a thriving northern area in the ACT, continues to flourish and is now home to 71,000 people, up from 47,000 in 2011 – an increase of 50 per cent.

Stretching from the beaches of Bondi and Manly to the Blue Mountains, Greater Sydney once again came in as Australia’s largest population centre, with 4,823,991 people, with around 1,656 new people calling the Harbour City home every week since the last Census. However, the cultural hub of Greater Melbourne is closing in fast with 4,485,211 people, increasing by around 1,859 people every week since 2011.

The average age – the median –  has moved up from 36 years to 38 and there are more people over the age of 65 years, with an increase from 14% to 16% of the population. The 2016 Census found that there are 664,473 additional people aged 65 and over since 2011. The demographic shift here is significant in terms of healthcare, aged care and wealth management.

Median weekly household incomes rose from $1,234 in 2011 to $1,438 in 2016. The average individual income was $577, and is now $662.

The dwellings data is interesting, in that we see a 6.8% rise in the number of occupied dwellings between 2011 and 2016, from 7.7 million to 8.3 million. The average monthly mortgage repayment is $1,755 today, compared with $1,800 in 2011, whilst rents have risen by 17.5%, from a weekly $285 to $335.  There was little change in the mix between families, single persons and group households. There was no change to the average number of people in each dwelling, at 2.6 and the average number of bedrooms remained at 3.1.

More households are renting, up from the previous census in 2011, from 27% in 2011 to 31% in 2016. Clearly the rise in property values relative to income and poor housing affordability (refer population growth above) makes it more difficult to enter the market, to say nothing of the greater penetration of property investors.  We also see that apartments, flats and townhouses have increased as a share of all housing dwellings from 24% to 27% over the past decade.

The cultural mix in the country is changing, look back half a century and around 18% of Australians were born overseas. The latest data shows this now stands at 26%.

The ethic mix has also changed. Back in 1966 one third of these people were born in England but today this is 15%. The proportion from New Zealand also decreased over the same period from 9.1% to 8.4%.

In contrast, the proportion of overseas-born Australians born in China has jumped from 6% to 8.3% and from India from 5.6% to 7.4%.

Finally, a greater proportion of the population has no specific religious affiliation. The proportion of people reporting no religion increased to 30 per cent in 2016 – up from 22 per cent five years ago and nearly double the 16 per cent in 2001.

Older Australians face housing crisis

From The New Daily.

Australian retirees will face a housing crisis within 15 years unless urgent action is taken, according to the Council on the Ageing.

The lobby group for seniors hosted a policy summit in Canberra in recent days where it drew attention to the impact on older Australians of rising prices, rising rents, huge mortgage debt and the scarcity of suitable homes.

The assumption that Australians retire in a home they own underpins the nation’s superannuation and pension systems, but summit attendees heard this could be under serious threat in as little as 10 to 15 years.

Keynote speaker John Daley, CEO of the Grattan Institute, warned that the looming housing crisis is a “ticking time bomb” for this demographic.

“We must address these issues immediately if we want to stand a fighting chance to mitigate the severity of the looming housing affordability crisis and to safeguard the future of older Australians before it is too late,” Mr Daley said.

The summit heard a key threat is that more Australians are entering retirement with mortgage debt, which they typically pay off in a lump sum from their superannuation.

Others enter retirement while still renting, which radically increases the amount of disposable income they need to cover monthly expenses.

The Association of Superannuation Funds of Australia, which represents both for-profit and non-profit funds, has estimated that couples who rent for life in the eight capital cities will need at least $1 million to retire comfortably.

In Sydney, a renting couple would require a lump sum at retirement of $1.16 million, almost double the $640,000 a couple who own their home debt-free would need, ASFA found.

The huge disparity is due solely to the ongoing costs of renting. For example, a 65-year-old Sydney couple who own their home will spend — if they live comfortably — about $60,000 a year, compared to almost $80,000 for a renting couple.

The problem is even worse for age pensioners. The 2017 Rental Affordability Snapshot report by Anglicare Australia found only 6 per cent of the market was affordable for a single older person living on the age pension.

The forum also discussed the growing incidence of homelessness among older people, especially women; and the implications for age pensioners of unaffordable rental properties in the cities.

COTA chief executive Ian Yates said older Australians are increasingly disadvantaged by the lack of supply of affordable housing that meets the physical needs of older residents.

“Older Australians are increasingly falling through the cracks in the growing housing affordability and supply challenge, with a growing number of older Australians needing to rent, rather than owning a home outright,” Mr Yates said.

“We are already starting to see rates of home ownership by older Australians decline, and this is forecast to drop even further in the next 10-15 years.

“This trend is already exerting extra pressure on the rental market and on many older Australians who are struggling to pay their rent, while also juggling other rising expenses like energy.

“There is a whole group of people currently in their 50s and 60s who will be retiring as renters, or if they are lucky enough to own a house, facing the prospect of retiring with a mortgage.”

An Australian researcher has estimated that anyone who doesn’t have a mortgage by the age of 45 will probably be renting in retirement, due to price growth outpacing savings, the risks of sickness and unemployment, and the difficulty of convincing a bank to provide a home loan.

The COTA summit also heard from Dr Ian Winter at the Australian Housing and Urban Research Institute; Judith Yates from the University of Sydney; Jeff Fiedler from Housing for the Aged Action Group; and Paul McBride from the Department of Social Services.

Many of the same themes were covered in a recent report by consulting firm KPMG. It confirmed that it will be very difficult for older Australians to be debt free in later years, largely because of housing costs.

Bust the regional city myths and look beyond the ‘big 5’ for a $378b return

From The Conversation.

Investing in regional cities’ economic performance makes good sense. Contrary to popular opinion, new researchout today shows regional cities generate national economic growth and jobs at the same rate as big metropolitan cities. They are worthy of economic investment in their own right – not just on social and equity grounds.

However, for regional cities to capture their potential A$378 billion output to 2031, immediate action is needed. Success will see regional cities in 2031 produce twice as much as all the new economy industries produce in today’s metropolitan cities.

Drawing on lessons from the UK, the collaborative work by the Regional Australia Institute and the UK Centre for Cities spotlights criteria and data all Australian cities can use to help get themselves investment-ready.

Build on individual strengths

The Regional Australia Institute’s latest work confirms that city population size does not determine economic performance. There is no significant statistical difference between the economic performance of Australia’s big five metro cities (Sydney, Melbourne, Brisbane, Perth and Adelaide) and its 31 regional cities in historical output, productivity and participation rates.

So, regional cities are as well positioned to create investment returns as their big five metro cousins. The same rules apply – investment that builds on existing city strengths and capabilities will produce returns.

No two cities have the same strengths and capabilities. However, regional cities do fall into four economic performance groups – gaining, expanding, slipping, and slow and steady. This helps define the investment focus they might require.

For example, the report finds Fraser Coast (Hervey Bay), Sunshine Coast-Noosa and Gold Coast are gaining cities. Their progress is fuelled by high population growth rates (around 2.7% annually from 2001 to 2013). But stimulating local businesses will deliver big job growth opportunities.

Rapid population growth is driving the Gold Coast economy, making it a ‘gaining’ city. Pawel Papis from www.shutterstock.com

Similarly, the expanding cities of Cairns, Central Coast and Toowoomba are forecast to have annual output growth of 3.2% to 3.9% until 2031, building on strong foundations of business entries. But they need to create more high-income jobs.

Geelong and Ballarat have low annual population growth rates of around 1.2% to 1.5%. They are classified as slow and steady cities. But their relatively high creative industries scores, coupled with robust rates of business entries, means they have great foundations for growth. They need to stimulate local businesses to deliver city growth.

Get ready to deal

Regional cities remain great places to live. They often score more highly than larger cities on measures of wellbeing and social connection.

But if there’s no shared vision, or local leaders can’t get along well enough to back a shared set of priorities, or debate is dominated by opinion in spite of evidence, local politics may win the day. Negotiations to secure substantial city investment will then likely fail.

The federal government’s Smart Cities Plan has identified City Deals as the vehicle for investment in regional cities.

This collaborative, cross-portfolio, cross-jurisdictional investment mechanism needs all players working together (federal, state and local government), along with community, university and private sector partners. This leaves no place for dominant single interests at the table.

Clearly, the most organised regional cities ready to deal are those capable of getting collaborative regional leadership and strategic planning.

For example, the G21 region in Victoria (including Greater Geelong, Queenscliffe, Surf Coast, Colac Otway and Golden Plains) has well-established credentials in this area. This has enabled the region to move quickly on City Deal negotiations.

Moving past talk to be investment-ready

There’s $378 billion on the table, but Australia’s capacity to harness it will depend on achieving two key goals.

  • First, shifting the entrenched view that the smart money invests only in our big metro cities. This is wrong. Regional cities are just as well positioned to create investment returns as the big five metro centres.
  • Second, regions need to get “investment-ready” for success. This means they need to be able to collaborate well enough to develop an informed set of shared priorities for investment, supported by evidence and linked to a clear growth strategy that builds on existing economic strengths and capabilities. They need to demonstrate their capacity to deliver.

While there has been much conjecture on the relevance and appropriateness of City Deals in Australia, it is mainly focused on big cities. But both big and small cities drive our national growth.


You can explore the data and compare the 31 regional cities using the RAI’s interactive data visualisation tool.

Author: Leonie Pearson, Adjunct Associate, Regional Australia Institute

The Property Imperative Weekly – 24 June 2017

More pain for property investors this week, with lenders continuing to lift mortgage rates and trim maximum LVR’s. And more pain for banks as their credit ratings are trimmed, the federal bank tax becomes law; and South Australia imposes an additional levy on the big five. Welcome to the Property Imperative Weekly to 24th June 2017.

The regular pattern of mortgage interest rates hikes continued, with NAB lifting interest rates for all interest only loans by 35 basis points or 0.35%, whilst cutting principal and interest owner occupied loans by 8 basis points.  Westpac lifted interest only loans by 34 basis points reduced principal and interest loans by 8 basis points. The impact of these changes according to Macquarie will be net positive in terms of bank returns. AMP Bank also lifted investor rates by 35 basis points and reduced the maximum LVR on investor loans to 50%.

These changes are making life difficult for some property investors currently with interest only loans. Do they switch to a principal and interest alternative, thus lifting their monthly repayments, or wear the lift in rates on their current loans, thus lifting their repayments? It’s a prisoner’s dilemma. Either way, it is less likely the current rental on the property will cover the costs of the loan repayments and we know from our surveys about half of all investment properties are underwater when it comes to covering the repayment flows.

More data this week to show that some major lenders are dialling back investor loans via brokers to try and manage their portfolios to within the current APRA guidelines. This trend, which we have highlighted before, was confirmed in the AFG Competition Index.

Mortgage stress was in the news again, with surprising results from Roy Morgan’s survey which showed that from their 10,000 mortgaged household sample, in the three months to April 2017, 16.8% or 666,000 mortgage holders can be considered to be ‘at risk’ or facing some degree of stress over their repayments. This compares favourably with 18.4% or 744,000 mortgage holders 12 months ago. It is worth noting their definition of stress though – “Mortgage stress is based on the ability of home borrowers to meet the repayment guidelines currently provided by the major banks. The level of mortgage holders being currently considered ‘at risk’ is based on their ability to meet repayments on the original amount borrowed. This is currently 16.8%, which is well below the average over the last decade”.

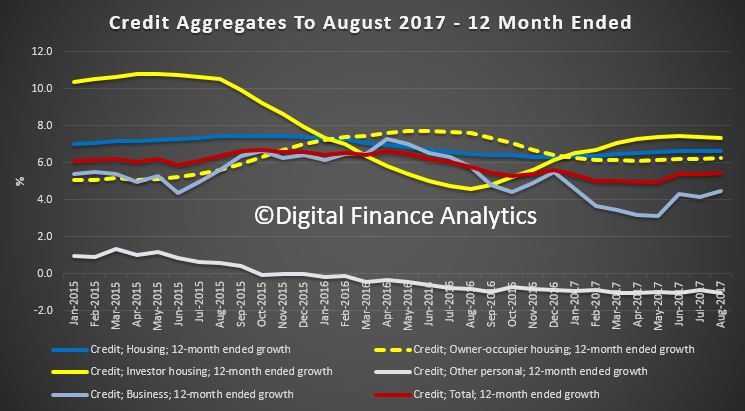
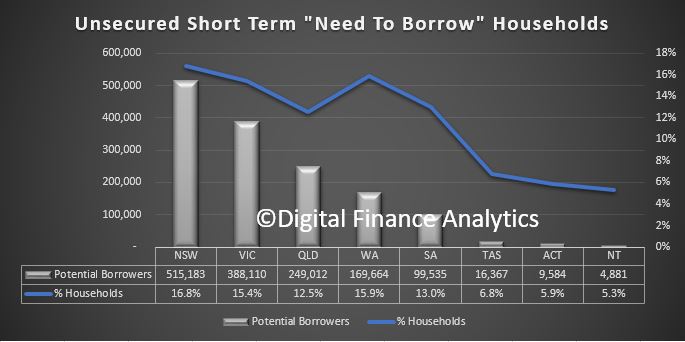
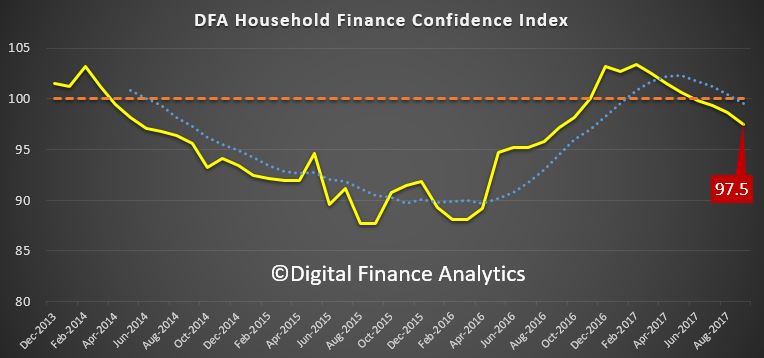
The DFA approach to mortgage stress, which looks at total household cash flow, not the theoretical repayment profile, indicates that mortgage stress is continuing to rise as incomes are crushed in real terms, costs of living rise, underemployment stalks many, on top of a series of mortgage rate rises. Data from Canstar showed that basic variable rates jumped by almost 30 basis points as increasing number of borrowers go for fixed rate loans so trying to control these escalating mortgage costs, but of course, many fixed rates already have higher costs wired in.

We looked at the correlation between mortgage stress and bank loan losses, which we expect to rise in coming months. Indeed, the latest data from Standard and Poor’s showed that home loan delinquencies underlying Australian prime residential mortgage backed securities (RMBS) increased from 1.16% in March to 1.21% in April. They link the rise to higher mortgage rates.

But whether you take the 666,000 households from Roy Morgan, or 794,000 from DFA, both are big numbers! There are many households in mortgage pain, and all the indicators are things will get worse in the months ahead.

We expect APRA will demand the banks hold more capital, US rates were lifted by the Fed, and Moody’s downgraded the long-term credit rating of 12 banks including Australia’s big four, after pointing to surging home prices, rising household debt and sluggish wage growth. They said “elevated risks within the household sector heighten the sensitivity of Australian banks’ credit profiles to an adverse shock, notwithstanding improvements in their capital and liquidity in recent years”.

There were state budgets in NSW and SA. In NSW Stamp duty makes up a huge proportion of the State’s income, at $10 billion, with revenues jumping 10% over the past year and are expected to grow 6% each year for the next three years. From July 1 stamp duty for FHBs will be abolished for new homes up to $650,000 with discounts on properties of up to $800,000. Additionally, grants of $10,000 will be available for new homes of up to $600,000 and for FHBs who build their home. Stamp duty will no longer be charged on lenders mortgage insurance.

South Australia surprised by adding a local bank tax to the big five. They plan to charge a levy on the major banks bonds and deposits over $250,000 but will exclude mortgages and ordinary household deposits. The tax, to be introduced 1 July, is expected to raise $370 million over four years. The banks responded, including threats to pull jobs from SA, but then the banks are easy targets, and we would not be surprised if other states followed suite.

Meantime the federal bank tax was passed after a brief senate review. Now the Treasurer has announced plans to change the way eligibility for a credit card is assessed, shifting it from the ability to pay the minimum repayment to being able “to repay the credit limit within a reasonable period”.

Australians’ wealth is overwhelmingly in our housing. Our housing stock worth valued at $6.6 trillion. That’s nearly double the combined value of ASX capitalisation and superannuation funds.

Housing is strongly linked to financial stability as highlighted in excellent speech by Fed Vice Chairman Stanley Fischer. He said there was a strong link between financial crises and difficulties in the real estate sector. In addition to its role in financial stability, or instability, housing is also a sector that draws on and faces heavy government intervention, even in economies that generally rely on market mechanisms.

Australian Housing and Urban Research Institute (AHURI) published a report this week on housing policies across the nation. They argue, rightly, that Australia needs a federal minister for housing, a dedicated housing portfolio, and an agency responsible for conceptualising and co-ordinating policy. The current fragmented, ad-hoc approach to housing policy seems poorly matched to the scale of the housing sector and its importance to Australia.  There is no clear systematic policy framework for housing across the nation, just piecemeal bits of policy, which are not fit for purpose.

Finally, the ABS released their residential property price data to March 2017. They said overall, prices rose on average 2.2% in the quarter. The price rises in Sydney (3.0 per cent) and Melbourne (3.1 per cent) were partially offset by falls in Perth (1.0 per cent) and Darwin (0.9 per cent).

Through the year growth in residential property prices reached 10.2 per cent in the March quarter. Sydney recorded the largest through the year growth of all capital cities at 14.4 per cent, followed closely by Melbourne at 13.4 per cent.

This ongoing rise may go counter to some recent data, although we note the CoreLogic data this week also shows rises in most centres, after recent softer data. The next ABS series, due out in 3 months will be the one to watch.  Auction clearances last weekend were quite strong, if on lower volumes, so as yet, signs of a real slow-down remain muted.

And that’s it for this week. Check back next week for the next installment.

Not in their interest: The home loan borrowers that have been left out to dry

From The SMH.

There is a hidden and worrying risk lurking for a particular set of mortgage borrowers, whose level of financial stress is about to get a whole lot worse.

It’s those home owners with interest-only loans that are now increasingly under the pump – with National Australia Bank the latest of the big four to announce big hikes in rates on these types of loans.

While banks, the media and the government regularly characterise those that have interest-only loans as wealthy property investors, the fact is that there are many owner-occupiers that have used this method to finance the family home.

Ironically, regulators have pushed the banks to reduce interest-only lending to improve the overall risk of consumers’ debt to the financial system. But for those investors with interest-only loans, the chances of being unable to service them creates a new and unintended risk.

These hikes have not attracted the ire of the government, which has put the banks on notice that any move to increase mortgage rates will be intensely scrutinised. Again, because it is not seen as hitting the political heartland of the average voter with a mortgage to finance their own home.

But these borrowers are particularly vulnerable because many of them took out their interest-only loans because they didn’t have enough cash flow to repay interest and principal.

The banks have been under regulatory pressure to herd these interest-only borrowers into interest and principal loans – offering little or no fees to change over to principals, and interest rates that are now around 0.6 per cent lower.

The catch though is that monthly repayments will be higher in most cases because the borrower also needs to repay principal.

Those that can afford to switch will do so, but there will be many that will need to remain on interest-only and have to wear the rate increase.

For owner-occupiers who have an interest and principal loan, interest rates have not fallen by much in this latest round of adjustments.

National Australia Bank and Westpac customers will see their rate fall by 0.08 per cent while ANZ customers will benefit to the tune of 0.05 per cent.

It is better than nothing, but won’t have a really meaningful impact to the weekly household budget.

For banks, the positive effect of the far bigger increases on interest-only loans will significantly outweigh the negative impact of the small fall in rates on interest and principal loans.

Indeed Westpac – which has a higher proportion of interest-only loans than the others – could boost its earnings by 3.5 per cent, according to research from Macquarie. This is calculated on the basis of all other things being equal.

But Macquarie takes the view that this earnings benefit will be eroded to some degree by some customers switching to interest and principal loans – the caveat being if they can afford it.

Martin North from industry consultant Digital Finance Analytics believes that some investor/borrowers that have interest-only loans would have less incentive to switch because the tax effectiveness of this type of borrowing could be negatively affected.

Young families, investors most at risk

The bottom line is that regardless of the kind of borrower, the overall effect of this latest round of interest rate resets will be to improve bank earnings, because in aggregate borrowers will pay more.

North said the two segments most at risk for mortgage stress are younger families that are more typically first home owners that pushed their finances to get into the property market over the past couple of years and at the other end of the spectrum a more affluent group that took advantage of the rising property market and low interest rates to buy one or more investment properties.

Both North and analysts at Macquarie warn that the flow-on effects from increased rate rises even on just interest -only loans, and the potential for some to switch to interest and principal, could be damaging for the wider economy.

“The increase to IO (interest-only) loans combined with the increased likelihood of customers switching to P&I (principal and interest), in our view, will ultimately lead to further reductions in disposable incomes and put even greater pressure on highly indebted households. We estimate that a 50 basis point increase in interest rates has a 4 to 10 per cent impact on disposable income of highly indebted households.

“While it would rationally make sense for many households (particularly for owner-occupiers) to switch to P&I, …. many of these households would not have capacity to do this,’ Macquarie said in a note to clients this week.

‘Deadly combination’

In analysing the reasons for an increased level of stressed households, North noted that “the main drivers are rising mortgage rates and living costs whilst real incomes continue to fall and underemployment is on the rise. This is a deadly combination and is touching households across the country, not just in the mortgage belts.’

Against this, the incentive for banks to massage rates higher is greater than ever, given they have been hit by the Federal Government’s bank levy and this week by an additional tax from the South Australian government that many fear could be adopted by other states down the track.

On the other side of the household ledger, the lack of any real growth in wages is only exacerbating the squeeze.

A report from Cit this week that analyses the industry segments in which jobs are growing provides insight into the problem.

“Not only does Australia have an underemployment problem that has been highlighted by the monthly labour force series, but the quarterly data shows that the economy is creating mostly jobs that are below average in terms of earnings,” it said.

The shift to solitary living is massively inflating property prices

From The New Daily.

Australians increasingly choose to live alone, and this huge demographic shift is going to push up prices and sprawl our cities further into the fringe unless we accept higher density living.

According to the Victorian government, by 2025 up to 51 per cent of Melbourne households will be ‘no child households’.

‘No child households’ are those that are pre-child, post-child or have no intention of ever having children.

The numbers are similar for all of Australia’s major cities, although slightly lower in Sydney as it attracts a slightly higher percentage of families.

Worst still, the fastest growing segment of the Australian housing market is the single person household. Single person households may reach 44 per cent of all major city households by 2035.

What does this mean for communities and for housing prices?

According to the Grattan Institute, 84 per cent of Melbourne’s housing stock is made up of detached or semi-detached family homes. Only 16 per cent of the housing stock is aimed at non-family residences.

By 2025, 51 per cent of our population could be in non-family units with only 16 per cent of our housing stock aimed at this demographic.

There will be a shortage of non-family medium and higher density living with people forced to bid for family homes leaving bedrooms empty. Fewer people will live in each housing unit, putting massive upward pressure on housing prices.

As the average number of people per household shrinks we will need more residences for the same amount of population. If we do not radically increase density then these new houses will continue to be built on our urban-fringed farm land.

It is not just me calling for a re-think on planning demographics. Reserve Bank governor Philip Lowe, speaking in Brisbane earlier this year, identified “the choices we have made as a society regarding where and how we live … urban planning and transport” as significant impacting factors on property prices.

Property, like all markets, is impacted by changes to both supply and demand. While demand can be impacted by a range of economic factors, supply is restricted by planning rules and the availability of land, as well as economic factors.

Some people think all will be okay with housing supply as they think Australia’s housing density has increased. But this is not true. Whilst the last decade has seen an uptick in density, a longer-term view tells a very different story.

Inner city suburbs, prior to ‘gentrification’, used to house one, two and sometimes three families per house. Now days the inner city houses often have just one, two or three people.

Melbourne, for example, has seen a huge drop in its density from 20.3 people per hectare in 1960 to around 14.9 people per hectare today.

This change in demographics means that, even if our population stays the same, our cities don’t grow ‘up’ then they must grow ‘out’.

This decreasing density is eating up farmland on the urban fringe and putting huge strain on infrastructure spending as the cost per person per kilometre of infrastructure sky rockets.

It is dangerous and will continue even if the population remained exactly the same – let alone if we continue to grow our it.

As single person households age and get ill, will we see more horror stories of people falling ill or dying at home and remaining undiscovered for days or weeks as ‘friends’ wonder why they have not been online?

With decreasing family sizes, growing numbers of childless households and growing numbers of single person households, our housing supply is becoming more out of sync with our housing demand.

The result will be increased pressure on housing prices.

‘Canberra to blame’ for next month’s sky-rocketing energy bills

Household budgets, already under pressure from flat incomes, underemployment and rising mortgage rates, face further cost of living pressures with the latest hikes in power prices, as highlighted by the New Daily.

Power bills will soar by hundreds of dollars next month in east coast states, and experts blame policy uncertainty in Canberra.

Two major retailers, Energy Australia and AGL, have announced they will hike prices substantially from July 1. A third, Origin Energy, is expected to follow soon.

Energy Australia will increase power bills by almost 20 per cent, roughly $300 more a year, for households in South Australia and New South Wales. Gas prices will go up 9.3 per cent in NSW and 6.6 per cent in SA, adding between $50 and $80 to annual bills.

Queensland customers will be least affected, suffering only a 7.3 per cent ($130) increase to residential power bills. This is due mainly to the Palaszczuk government forcing the state government-owned distribution network to take a hit to profits.

A week earlier, AGL, the country’s third-biggest energy provider, said it would push up electricity by 16.1 per cent and gas by 9.3 per cent next month in NSW, QLD, SA and the ACT.

Victorians and Tasmanians have escaped bill shock for now, but only because their prices operate on a different schedule. Annual price changes in those states will be announced in December, kicking in on January 1.

Dylan McConnell, energy expert at Melbourne University, said years of policy uncertainty resulted in barely any new generators being built to replace the withdrawal of ageing coal and gas-fired power stations.

This has forced the National Energy Market (which supplies to NSW, QLD, SA, VIC, TAS and the ACT) to rely more heavily on expensive gas-fired generators to fill gaps in supply.

“We’ve had an effective ‘capital strike’, where policy uncertainty has resulted in a lack of investment and delays with respect to upgrades, maintenance and new installations – whether that’s new renewables, new storage, new anything – forcing us to rely on older, gas-fired technology,” Mr McConnell told The New Daily.

“At the same time we’ve had the gas market open up LNG exports, which has put substantial pressure on gas prices.

“These higher gas prices have flowed through to electricity prices, mainly because of the way the price-setting mechanism works in the wholesale market. Basically, gas is the marginal generator a lot of the time, and it’s actually become more of the marginal generator. That means the effect is more acute.”

energy prices australia

If the sun stops shining on solar panels, the wind stops blowing on turbines and demand exceeds what traditional generators can supply, gas-fired turbine generators are fired up to plug the gap – at great expense to consumers.

Energy Australia and business groups have implored Canberra to embrace the recommendations of Chief Scientist Dr Alan Finkel, who published an energy policy review last week.

Energy Australia chief customer officer Kim Clarke said the Finkel review was a “good, solid blueprint” for Canberra to follow.

“A sensible next step is for governments to engage industry and other stakeholders on the Finkel package of reforms to discuss the best way forward,” Ms Clarke said in a statement.

The Finkel review confirmed that policy uncertainty has constrained the building of much-needed ‘dispatchable’ energy sources – that is, the kind of generators that can be switched on and off quickly to meet the increasingly more volatile energy usage habits of Australians.

“Uncertainty related to emissions reduction policy and how the electricity sector will be expected to contribute to future emissions reduction efforts has created a challenging investment environment,” Dr Finkel wrote.

In the absence of reliable power sources (which, Dr Finkel notes, could have included battery-stored solar and wind energy), generators have had to rely more heavily on gas turbines to create electricity, with the result that consumers pay more.

“Ageing generators are retiring from the NEM, but are not being replaced by comparable dispatchable capacity. Policy stability is required to give the electricity sector confidence to invest in the NEM.”

While Dr Finkel was at pains to say he was “technology neutral”, he predicted the future belonged to solar, wind and battery storage, not so-called lower-emission fossil fuels.

His main policy recommendation was his Clean Energy Target – effectively a watered-down carbon price – that would facilitate “an orderly transition to a low emissions future” and encourage investors to build new generators.

“It puts downward pressure on prices by bringing that new electricity generation into the market at lowest cost without prematurely displacing existing low-cost generators. It further ensures reliability by financially rewarding consumers for participating in demand response and distributed energy and storage.”

Dr Finkel’s report has sparked a war inside Coalition. Prime Minister Malcolm Turnbull and Energy Minister Josh Frydenberg are locked in a bitter debate with an estimated 20-25 anti-renewable Coalition MPs led by former prime minister Tony Abbott.

Other contributing factors to price hikes, noted by many experts, has been heavy investment in poles and wires, opportunistic price gouging by retailers, and the fact that many companies are both retailers and wholesalers (which has dried up liquidity for energy derivatives, especially in South Australia).

Sydney public housing evictions a policy success?

From The Conversation.

Three years after New South Wales’ housing minister announced that all 579 public housing tenants in Millers Point, Dawes Point and the Sirius Building would be moved within two years and their homes sold, only 24 tenants are still resisting the move. So far, 151 properties have been sold for A$400.89 million, with a median sale price of $2.44 million.

One 90-year-old said others looked out for him in the Sirius Building. In his new housing, he feels utterly isolated. Ben Guthrie/AAP

The NSW government would argue that these statistics indicate the displacement has been a great success. But, drawing on 40 in-depth interviews I conducted with tenants, the displacement has been a monumental policy failure on various levels.

Let’s begin with the justifications for the displacement. The NSW government’s main justifications were that the homes were expensive to maintain and that the escalation of house prices in Millers Point represented an opportunity to raise $500 million that would be used to build 1,500 additional social housing dwellings.

Tenants interviewed were adamant that maintenance was negligible. Many spoke about maintenance requests being ignored or the work done being so shoddy that the problem was not fixed or promptly recurred. Many felt that a deliberate policy of neglect had been one of the key strategies to encourage tenants to move.

Doing the sums

The high cost of maintenance certainly cannot be used to justify the planned sell-off and destruction of the Sirius Building.

The age and concrete structure of the building mean that the maintenance costs per unit are probably lower than for many other public housing complexes. It is 35 years old – the average age of social housing properties in NSW is 45 years – and in good physical condition.

The government’s promise to use the sale proceeds to build 1,500 social housing homes has been its central justification for the displacement. On the surface, this appears reasonable. However, there are a several issues with this argument.

First, the actual number of additional homes will be closer to 1,100 as at least 400 homes have been lost in Millers Point and the Sirius Building.

Second, tenants posed the obvious question: why should public housing be financed by the sale of public housing? The massive increase in house prices in Sydney has resulted in a stamp-duty bonanza for the NSW government – around A$9 billion in the 2016-17 financial year.

The government is awash with cash. A surplus of around $4 billion is predicted for this financial year. Surely some of this money could have been used to reduce the scandalous public housing waiting list of more than 60,000 people.

Another question tenants raised was: why the rush? Why was it necessary to sell all the homes as soon as possible? It is highly likely that property prices in the area, within walking distance of the Sydney Opera House, will continue to increase.

If we accept this proposition, then the government could have compromised. It could have allowed tenants who were vehemently opposed to moving to stay, and sold off the homes of tenants who did not mind relocating.

‘Like leaving your family’

The main argument against the displacement is not so much the questionable financial justifications, but the devastating human cost.

Although some tenants were happy to move, the removal process and subsequent displacement has been traumatic for many. Tenants who had strong social ties in Millers Point and Sirius have been moved to areas where they know no one.

I interviewed a tenant who was moved out when he was 90. In the Sirius Building he knew a couple of people and his fellow tenants looked out for him. In his present housing complex he is totally isolated.
Another tenant interviewed was 85 when he was moved. He said that leaving Millers Point “was like leaving your family”.

The actual removal process was seriously flawed. Tenants were aghast that it was to be a blanket removal – those who were born in the area, were frail or had lived in the area for most their lives were to be forced out. Tenants had no choice but to move.

They were told that if they did not accept two “formal offers” of alternative accommodation, their public housing status would be terminated. This would have rendered most tenants homeless.

The total lack of consultation was particularly unfortunate. Tenants had no warning prior to the announcement. After making the announcement, the minister responsible, Pru Goward, refused to meet the residents. Her successor, Gabrielle Upton, also ignored requests for a meeting.

To his credit, Brad Hazzard, who replaced Upton in April 2015, met the working party representing the tenants and spoke to some of the older tenants. He was reportedly “persuaded, over scones and cream in residents’ homes, by their argument that it would be ‘a huge challenge’ for the elderly to move out of the area”.

The minister managed to persuade the NSW Treasury to fund the refurbishing of some existing properties. In November 2015, 28 apartments were made available for the 90 or so Millers Point residents who had not yet moved.

Unfortunately, yet again there was no consultation; 24 of these apartments are small one-bedroom apartments that are not suitable for most of the older residents who need an extra room for a carer and/or family visiting.

Social harm is irreversible

The displacement is also destroying an area of great historical significance. In 1999, the whole of Millers Point was declared a heritage site. The statement of significance said:

Its unity, authenticity of fabric and community, and complexity of significant activities and events make it probably the rarest and most significant historic urban place in Australia.

The displacement has exacerbated an already deep and growing spatial divide between rich and poor in Sydney. The social mix that was a feature of Millers Point has been obliterated along with its rich history.

The 24 remaining tenants are still hoping that the government may show some compassion and let them age in place. It’s a long shot, but it would be a marvellous and humane gesture.

Home Ownership and Work Redefined

In a new report, CBA says the Australian dream is still alive and well, as new goal posts emerge.

As the quarter acre block is becoming a threatened species and backyards are replaced by patios, just under half of Aussies (48 per cent) believe that the property dream is still alive and well, and for others (52 per cent), the Australian dream is being redefined.

In one of the largest national surveys since the Australian Census, with more than one million responses, the Commonwealth Bank has asked Australians about how they perceive their future, investigating attitudes around the property market, adapting to a changing workforce, and future proofing younger generations.

Partnering with demographer and futurist Claire Madden, the CommBank Connected Future Report examines national, economic and social trends that have emerged from the data.

According to Claire Madden, “The remarkable insights emerging from the CommBank ATM data overall is the resilience and tenacity Aussies have in the face of economic uncertainty. As a lead example, while the Australian property dream looks markedly different in 2017, the majority of Australians either fully own or are paying off their home. This has remained constant over the past five decades, so despite uncertainty, the Australian dream has clearly lived through time.”

The research shows while Millennials (Gen Y) are delaying traditional life markers like getting married or having a child, the average age of a first homebuyer has remained relatively constant over the last two decades, sitting at around 32 years of age.

The research has found that despite rapid digital disruption, increased global connectivity and the emergence of artificial intelligence, resilience seems to be a common trend amongst Australians. Almost half (49 per cent) believe our businesses are ready to face the future and 49 per cent believing our kids have the skills they need for tomorrow.

Key findings from the CommBank Connected Future Report include:

The architecturally designed dream

The Australian ‘dream home’ is no longer a weatherboard standalone house. It is an architecturally designed product, as the quality of dwellings has risen over time. Whilst 74 per cent of those living in cities and 81 per cent of those outside capital cities currently live in a stand alone house, 48 per cent of new residential approvals over the past year have been for medium or high density housing. CommBank data reveals 68 per cent of first home buyers purchased a house in the last year, 16 per cent desire to build their architectural dream home after purchasing vacant land, and 15 per cent purchased an apartment or townhouse.

Living in your state of optimism 

The data relating to the Australian property dream reveals that the state you live in impacts your state of optimism. The least optimistic were people residing in New South Wales (53 per cent) and Victoria (54 per cent), and this was significantly high with younger generations (57 per cent in both states). Those in Queensland (51 per cent), South Australia (53 per cent), Western Australia (54 per cent) and the Northern Territory (57 per cent) believe the dream is more attainable.

The ‘options’ Generation 

Gen Y have prioritised global travel, lifestyle experiences, stayed longer in formal education and attained the name KIPPERS (Kids in Parents’ Pockets Eroding Retirement Savings) for staying in the family home longer. Yet now they are in their prime career building and family forming years, they, like their predecessors, are finding a way to overcome the obstacles, respond to new realities, and see the (re)defined dream come alive. Even though the dream has taken a different form, the data reveals property ownership remains high on the aspirational list (average home buying age remains consistent at 32).

Gen Z and Gen Alpha 

According to the research, rapid digital disruption, increased global connectivity and the emergence of artificial intelligence are converging to reshape the business landscape and the way future generations define work. With high job mobility and the increased casualisation of the workforce, Gen Z (8-22 years old) will have 17 jobs across five careers in their lifetime.

As Gen Z and Gen Alpha (born 2010-2024) complete their schooling and enter the workforce, they will need to be adaptive and agile in order to integrate job roles with rapidly advancing automated systems and handle changing employment markets and organisational structures.

Women leading the way

Women are most optimistic about our kids being skilled up for the future with 52 per cent believing they are future ready, compared with 48 per cent of men. This is particularly evident amongst younger age groups, with the greatest gender gap amongst Gen Ys (25-39 year olds) with a 5 per cent differential between males and females.

Culture and society

With almost 3 in 10 Australians (29 per cent) born overseas1, and a quarter (27 per cent) of the population’s labour force born overseas2, immigration has significantly contributed to Australia’s workforce and economy. In the midst of this diversity, CommBank data reveals that almost half of Aussies (49 per cent) believe that our society truly embraces everyone.