Top 10 Mortgage Stress Count Down – September 2017

Mortgage stress rose again in September according to Digital Finance Analytics analysis, crossing the 900,000 household rubicon for the first time. The latest RBA data shows household debt to income rose again in June, to 193.7, further confirmation of Australia’s debt problem.

Across the nation, more than 905,000 households are estimated to be now in mortgage stress (last month 860,000) and more than 18,000 of these in severe stress. This equates to 28.9% of households. A rising number of more affluent households are being impacted as the contagion of mortgage stress continues to spread beyond the traditional mortgage belts. We estimate that more than 49,000 households risk default in the next 12 months, up 3,000 from last month.

Watch the video to learn more, and count down the latest top 10 post codes. We had some new regions “promoted” into the list this time.

The main drivers of stress are rising mortgage rates and living costs whilst real incomes continue to fall and underemployment remains high.  Some households are now making larger mortgage repayments following out of cycle interest rate rises, and are simultaneously facing higher power prices, council rates and childcare costs. This remains a deadly combination and is touching households across the country, not just in the mortgage belts.

Our analysis uses the DFA core market model which combines information from our 52,000 household surveys, public data from the RBA, ABS and APRA; and private data from lenders and aggregators. The data is current to end September 2017. We analyse household cash flow based on real incomes, outgoings and mortgage repayments, rather than using an arbitrary 30% of income.

Households are defined as “stressed” when net income (or cashflow) does not cover ongoing costs. Households in mild stress have little leeway in their cash flows, whereas those in severe stress are unable to meet repayments from current income. In both cases, households manage this deficit by cutting back on spending, putting more on credit cards and seeking to refinance, restructure or sell their home.  Those in severe stress are more likely to be seeking hardship assistance and are often forced to sell. The debt-to-income (DTI) ratios in severely stressed households are on average eleven times their current annual incomes and this is high on any measure. The combined statistics suggest there are continuing concerns about underwriting standards.

We revised our expectation of potential interest rate rises, given the stronger data on the global economy. Probability of default extends our mortgage stress analysis by overlaying economic indicators such as employment, future wage growth and cpi changes.

Martin North, Principal of Digital Finance Analytics said that “continued pressure from low wage and rising costs means those with bigger mortgages are especially under the gun. These stressed households are less likely to spend at the shops, which will act as a further drag anchor on future growth. The number of households impacted are economically significant, especially as household debt continues to climb to new record levels”. The latest household debt to income ratio is now at a record 193.7.[1]

Gill North, joint Principal of Digital Finance Analytics and a Professorial Research Fellow in the law school at Deakin University, citing her recent research, suggests the Australian house party has been glorious – but the hangover may be severe and more should be done to mitigate future risks and harm to highly indebted households and the nation.[2]

She notes that at the beginning of 2016 the RBA and APRA stood largely aloof from concerns around levels of household debt and the major risk was complacency. While the RBA and APRA have been more vocal since and have taken steps to tighten lending standards, she calls for additional measures and highlights the continuing vulnerability of many households without financial buffers for adverse contingencies.[3]

Regional analysis shows that NSW has 238,703 households in stress (238,755 last month), VIC 243,752 (236,544 last month), QLD 168,051 (146,497 last month) and WA 124,754 (118,860 last month). The probability of default rose, with around 9,300 in WA, around 9,100 QLD, 12,800 in VIC and 13,100 in NSW.

You can request our media release. Note this will NOT automatically send you our research updates, for that register here.

[contact-form to=’mnorth@digitalfinanceanalytics.com’ subject=’Request The Sept 2017 Stress Release’][contact-field label=’Name’ type=’name’ required=’1’/][contact-field label=’Email’ type=’email’ required=’1’/][contact-field label=’Email Me The Sept 2017 Media Release’ type=’radio’ required=’1′ options=’Yes Please’/][contact-field label=”Comment If You Like” type=”textarea”/][/contact-form]

Note that the detailed results from our surveys and analysis are made available to our paying clients.

[1] RBA E2 Household Finances – Selected Ratios June 2017

[2] Gill North ‘The Australian House Party Has Been Glorious – But the Hangover May Be Severe: Reforms to Mitigate Some of the Risks’ in R Levy, M O’Brien, S Rice, P Ridge and M Thornton (eds), New Directions For Law In Australia (ANU Press, Canberra, 2017). An earlier version of this book chapter is available at https://ssrn.com/author=905894.

[3] See also, Gill North, ‘Regulation Governing the Provision of Credit Assistance & Financial Advice in Australia: A Consumer’s Perspective’ (2015) 43 Federal Law Review 369. An earlier draft of this article is available at https://ssrn.com/author=905894.


Mortgage stress up despite decline in rates

New research from Roy Morgan shows that mortgage stress has increased to 17.3% of borrowers in July, an increase of 0.3% points over the last 12 months, despite a decline in loan rates.

Home loan rates were based on the standard variable rate from the RBA which in the three months ended July 2017 averaged 5.25%, down from 5.40% for the same period in 2016.

These are the latest findings from Roy Morgan’s Single Source Survey (Australia) of over 50,000 consumers per annum, which includes interviews with over 10,000 owner occupied mortgage holders.

Increase in ‘At Risk’ and ‘Extremely at Risk’ mortgage holders

Over the last 12 months there has been an increase in mortgage stress for both those considered to be ‘At Risk’ (which is based on the amount originally borrowed) and those ‘Extremely at Risk’ (based on the amount currently outstanding). In the three months to July 2016, 17.0% of mortgage holders were ‘At Risk’, this has increased to 17.3% in July 2017. Over the same period the proportion that were ‘Extremely at Risk’ also increased from 12.4% to 12.8%.

Mortgage Stress – Owner Occupied Mortgage Holders


Mortgage stress is based on the ability of home borrowers to meet the repayment guidelines currently provided by the major banks. 1. “At Risk” is based on those paying more than a certain proportion of their household income (15% to 50% depending on income) into their loans based on the appropriate Standard Variable Rate reported by the RBA and the amount the respondent initially borrowed. 2. “Extremely at Risk” is based on those paying more than a certain proportion of their household income (30% to 45% depending on Income) into their home loans based on the Standard Variable Rate set by the RBA on the amount respondents currently owe on their home loan. Source: Roy Morgan Single Source (Australia) 3 months ended July 2016, n = 2,673, 3 months ended July 2017, n = 2,734. Base: Australians 14+ with owner occupied home loan

Household incomes of mortgage holder’s not keeping pace with borrowings

The main cause of the increase in mortgage stress was the fact that over the last year, the median household income of mortgage holders only increased by 2.0%, well behind the increase in the median amount borrowed (up 7.4%) and the median amount outstanding (up 13.1%).

Major Factors Impacting Increase in Mortgage Stress – Last 12 Months

1. Percentage change is based on 3 months to July 2017, compared to 3 months to July 2016. Source: Roy Morgan Single Source (Australia) 3 months ended July 2016, n = 2,673, 3 months ended July 2017, n = 2,734. Base: Australians 14+ with owner occupied home loan

The increase in mortgage stress was despite the fact that home loan rates (based on the RBA standard variable rate) over this period actually declined from 5.40% to 5.25%.

Mounting housing stress underscores need for expert council to guide wayward policymaking

From The Conversation.

A recent policy pledge by Shadow Treasurer Chris Bowen has given fresh heart to campaigners for the restoration of the former National Housing Supply Council (NHSC).

The Abbott government axed the council in 2013. With housing stress intensifying across much of Australia, a reinstated and revitalised council could strengthen policymaking in this contested area.

NHSC Mark 1

The Rudd government created the NSHC in 2008. The council’s role was to put housing policy on a sound base of evidence. It was guided by expert members drawn from the construction industry as well as senior planning, social housing, economics and academic ranks.

The council provided ministers with housing supply and demand estimates, projections and analysis. It also investigated the influence of infrastructure investment, housing-related taxation and urban planning. Its remit included a focus on:

… the factors affecting the supply and affordability of housing for families and other households in the lower half of the income distribution.

Importantly, NHSC reports explicitly recognised that untargeted supply-enhancing measures were not the sole answer to easing this group’s housing stress. The council also examined influences on housing demand. These included the price-stimulating effect of tax incentives for residential property investors.

The case for restoring the NHSC

Unaffordable housing and homelessness of course remain burning issues in national media and policy debate. Across most of the country, these problems have mounted since the NHSC’s demise.

In Sydney, for example, median house prices have climbed 40% since 2013. Rents are up by more than 12%. Average New South Wales earnings, however, have risen by only 8% in this time.

From 2011 to 2016, census data show that, nationwide, the proportion of tenants having to spend more than an “affordable” amount on rent rose in every state capital other than Perth. And latest published statistics reveal homelessness service users rising at 5% per year (2016 census data on this are still awaited).

Housing affordability is subject to complex influences – regulatory, economic, demographic and other factors. Most of these transcend state and territory boundaries, and many call for improved data. As a landmark official report acknowledged only last year, the lack of information essential to underpin housing policymaking is highly problematic.


Overcoming these data deficiencies would be central to the mission of a restored NHSC. This includes metrics on the supply pipelines of serviced land, dwelling demolitions and underused housing.

In its day, the NHSC drew support from many quarters, notably spanning the property industry and the affordable housing lobby. Leading property sector groups lamented its abolition. And, alongside Bowen, the Property Council of Australia is among recent advocates for NHSC reinstatement.

A government wanting to beef up its understanding of this area could assign a wider and more analytical role to other official data-gathering or research bodies. But neither the Australian Bureau of Statistics nor the Australian Institute of Health and Welfare possesses the in-house policy expertise or industry-connectedness to provide a credible alternative to a restored NHSC. And the Australian Housing and Urban Research Institute (AHURI) is not set up for this role.

A reinstated NHSC can be improved

A new NHSC should be established by statute, not just by executive decision. This would strengthen its hand in obtaining required data from possibly reluctant state and territory ministries. In addition, this would provide more protection against arbitrary abolition by a future federal government in “wrecking mode”.

It will be vital that a reinstated NHSC’s remit includes a more granular, localised focus on supply and demand imbalances. Housing supply is only productive when suitably located in relation to jobs, infrastructure and services.

Housing provided needs to be of a type and configuration that matches demand, and at a price that people in that locality can comfortably afford. Property market conditions may be quite diverse even within a single capital city. Oversupply in one part of a metropolis can co-exist with shortages elsewhere.

Beyond calibrating overall housing demand and supply, the reborn NHSC must monitor the supply-demand balance by market segment, including low-cost rental. Similarly, the council’s former brief should be extended so it specifically assesses Australia’s unmet need for social and affordable housing. That’s both the current shortfall and the newly arising need predictable within a given period.

As recently instanced in Wales and Scotland, methodologies of this kind have a long lineage in UK housing policymaking. While Australia has residential stress metrics galore, none provide an ideal basis for government-supported rental housing construction. Such a program should be a central plank of national housing policy.

As Bowen has argued, a restored NHSC can also help hold states and territories to account for their supply commitments under the new National Housing and Homelessness Agreement. This is currently under negotiation between the two levels of government.

Reinstating the NHSC in a revitalised form would help government make more rational and informed policy choices on which supply and demand levers to pull to improve housing affordability. This is especially important for the lower-income renters who are doing it tough in cities like Sydney and Melbourne as well as in many other areas, such as the resort settlements along much of the east coast.

Stronger, better-founded evidence about the nature and extent of the affordable housing problem may help build consensus about how to tackle it effectively. And that is an outcome we badly need.

Authors: Hal Pawson, Associate Director – City Futures – Urban Policy and Strategy, City Futures Research Centre, Housing Policy and Practice, UNSW; Oliver Frankel, Adjunct Professor, UTS Business School, University of Technology Sydney

More than 30,000 of the nation’s ‘richest’ households in financial distress

From The Australian Financial Review.

More than 30,000 households in the nation’s wealthiest suburbs are facing financial stress, with hundreds risking default over the next 12 months because of soaring debts and static incomes, according to analysis of the nation’s household financial hotspots.

Hundreds of households in Sydney’s harbourside Vaucluse, where the median property price is $4.5 million, or Melbourne’s bayside Brighton, where a median priced house is $2.6 million, are being severely squeezed as costs continue to stretch incomes, the Digital Finance Analytics research finds.

“A lot of people making seriously good money have borrowed serious amounts of money. The one thing that sorts them out is when interest rates begin to rise,” said Christopher Koren, a buyers’ agent for Morrell and Koren, which specialises in top-end real estate.

“When it comes to top-end household cash flow – ‘Houston, we have a problem’,” said Martin North, principal of Digital Finance Analytics, who claims lenders are making incorrect assumptions about household incomes rising to meet increasing costs.

The analysis reveals that nearly 1000 households in Brighton, where a beachbox without electricity sells for more than ...The analysis reveals that nearly 1000 households in Brighton, where a beachbox without electricity sells for more than $320,000, are under distress, or could face default in the next 12 months. Joe Armao, Fairfax Media.

The Reserve Bank of Australia this week warned property buyers stretching to enter the property market when interest rates are at record lows could be “vulnerable” to economic shocks, such as rate rises or a change in personal circumstances.

The bank’s research shows that debt for the nation’s top 20 per cent of households is at least 190 per cent of income, an increase of more than 50 per cent in the 12 years to 2014, the latest Reserve Bank of Australia numbers.

Brendan Coates, Australian Perspective Fellow for the Grattan Institute, said top-end debt is likely to have risen even higher during the past three years.

By contrast, debt for the bottom 20 per cent has remained at 60 per cent of total income.

Mr North said: “The banks have been very free in their lending to affluent households.”

Higher end is more exposed

It is based on traditional lending models that indicate lower income earners and the mortgage belt property buyers are the most vulnerable if rates rise, or the economy slows.

“But they have missed the point that massive leverage at the top end, static incomes and the high proportion of affluent households with interest-only loans means the higher end are significantly more exposed,” he said.

“A lot also have multiple households. Because rents are based on incomes, are lot of these investments are under water, which means they are losing money,” he said.

According to SQM Research, which monitors rents and house prices, the national average rental income for apartments is about 1.4 per cent and 2 per cent for houses, compared to 2 per cent inflation and interest rates typically about 4.5 per cent for investor loans.

Some investors, particularly from Sydney, are selling up, releasing capital and buying cheaper investment properties, in places like Adelaide, according to market analysts.

A median property in Sydney’s metropolitan area, which sells for about $1 million, will buy two inner suburban properties in Adelaide.

Households are ‘stressed’ when income does not cover ongoing costs, rather than identifying a percentage of income committed to mortgage repayments, such as 30 per cent of after-tax income.

Those in “severe distress” are unable to meet repayments from current income, which means they have to cut back on spending, or rely on credit, refinancing, loan restructuring, or selling their house.

Mortgage holders under “severe distress” are more likely to seek hardship assistance and are often forced to sell.

The analysis reveals that nearly 1000 households in Brighton, where a beachbox without electricity sells for more than $320,000, are under distress, or could face default in the next 12 months.

More than 600 households in Vaucluse and Watsons Bay are under similar pressure.

RBA assistant governor Michele Bullock said regulators remain concerned about the high level of household debt, which is a result of low interest rates and rising house prices.

“High levels of debt do leave households vulnerable to shocks,” she said.

Mr Coates said rich households having the most debt provided some comfort for regulators comparing Australia’s potential vulnerability to an economic shock with the US, where those most exposed were poorer, sub-prime borrowers.

“The RBA is less worried because people who hold the debt are relatively well off,” Mr Coates said.

Anecdotal evidence suggests top-end earners are increasing their spending at the same pace as rising property prices.

“Many in Melbourne and Sydney think they are bullet proof,” said Mr Koren. “They’ve bought property in premium suburbs in the best performing markets in the world and they suddenly think they are always making money, despite earning the same amount of pay”.

Across the nation, more than 860,000 households are estimated to be in mortgage stress, with more than 20,000 in severe stress, or a rise of about 1 per cent to about 26 per cent to the end of August, the analysis finds.

About 46,000 are estimated to risk default, it finds.

Australia needs new insolvency laws to encourage small businesses

From The Conversation.

The Ten Network’s recent experience of voluntary administration and subsequent rescue by CBS demonstrates how insolvency law works for large Australian companies. But 97% of Australian businesses are small or medium size enterprises (SMEs), and they face a system that isn’t designed for them.

60% of small businesses cease trading within the first three years of operating. While not all close due to business failure, those that do tend to face an awkward insolvency regime that fails to meet their needs in the same way it does Network Ten.

The lack of an adequate insolvency regime for SMEs inhibits innovation and growth within our economy. It adds yet more complexity to the already difficult process of structuring a small business. Further, it inceases the cost of funding. Lenders know that recovering their money can be onerous if not impossible, so they impose higher costs of borrowing.

Australia’s insolvency regime

Australian insolvency law is divided into two streams, each governed by a separate piece of legislation.

The Corporations Act deals with the insolvency of incorporated organisations, and the Bankruptcy Act addresses the insolvency of people and unincorporated bodies (such as sole traders and partnerships).

Both schemes are aimed at providing an equal, fair and orderly process for the resolution of financial affairs. But a large part of the Corporations Act procedure has been developed with the complexity of a large corporation in mind. For example, there are extensive provisions that allow the resolution of disputes between creditors that are only likely to arise in well-resourced commercial entities.

The Bankruptcy Act, by contrast, takes account of the social and community dimensions of personal bankruptcy. This legislation seeks to supervise the activities of the bankrupted person for an extended period of time to encourage their rehabilitation.

SME’s awkwardly straddle the gap between these parallel pieces of legislation. Some SMEs are incorporated, and so fall under the Corporations Act. SMEs that are not incorporated are treated under the Bankruptcy Act as one aspect of the personal bankruptcy of the business owner. But of course, SMEs are neither people nor large corporations.

How insolvency works

Legislation governing corporate insolvency is founded on the assumption that there will be significant assets to be divided among many creditors. Broadly speaking, creditors are ranked and there are sophisticated and detailed provisions for their treatment. If Ten would have proceeded to liquidation, creditors would have been broadly grouped into three tiers and paid amounts well into the tens of millions.

One type of creditor is a “secured creditor”. Banks, for example, will often require that loans for the purchase of business equipment are secured against that equipment. In the event of default, the bank takes ownership of the equipment in place of the debt, if they can’t be paid out.

Unsecured creditors, on the other hand, do not have an “interest” over anything. If a company goes into liquidation, an unsecured creditor will only be paid if there are sufficient funds left after the secured creditors have been paid, and the cost of the process has been covered. There is no guarantee that unsecured creditors will be paid. Most often, they are only paid a portion of what they are owed.

The unique challenges of SME insolvency

When it comes to SMEs, there is little or no value available to lower-ranking, unsecured creditors in an SME insolvency estate. At the same time, higher-ranking, secured creditors tend to have effective methods of enforcing their interest outside the insolvency process. For instance they could individually sue the debtor to recover money owed. As a consequence, creditors are rarely interested in overseeing or pursing an SME insolvency process. This means the system is not often used and creditors with smaller claims go unpaid.

Even if creditors do want to use the insolvency process, it is likely the SME’s assets are insufficient to cover the cost of employing an insolvency practitioner and the required judicial oversight.

This problem is made worse because SMEs often wait too long to file for insolvency, owing to their lack of commercial experience or the social stigma of a failing business. Instead, debts continue to grow well beyond the point of insolvency, and responsibility falls on creditors to deal with the issue.

There are further difficulties depending on whether the SME is incorporated. Incorporated SMEs are frequently financed by a combination of corporate debt, taken on by the SME, and the personal debt of the business owner. This may result in complex and tedious dual insolvency proceedings: one for the bankruptcy of the owner and the other for the business.

Unincorporated SMEs, in turn, suffer from two stumbling blocks. First, the personal bankruptcy scheme has not been created to preserve the SME or encourage its turnaround. Second, personal bankruptcy proceedings require specific evidence that the person has committed an “act of bankruptcy”, such as not complying with the terms of a bankruptcy notice in the previous six months.

This hurdle makes the process far more time-consuming than the corporate scheme. It is also more difficult for creditors to succeed in recovering their investment and, by extension, prevents them from efficiently reallocating it. There is a real danger that this will deter creditors and raise the cost of capital at first instance.

What can we do about it?

The best way to meet the needs of SMEs would be to create a tailored scheme that sits between the corporate and personal regimes, as has been done in Japan and Korea. These regimes focus on speeding up the proceedings, moving the process out of court where possible and reducing the costs involved.

However, as the legislation in these two countries notes, there can be marked differences between small and medium-sized businesses that all fall under the SME banner. Therefore, what is needed is a flexible system made up of a core process, together with a large array of additional tools that may be invoked.

Designing such a scheme remains no easy feat. However, at its core, such a scheme would ideally allow business owners to commence the insolvency process and remain in control throughout. The process would sift through businesses to identify those that remain viable, and produce cost-effective means for their preservation.

Non-viable businesses would be swiftly disposed of, using pre-designed liquidation plans where possible and relying on court processes and professionals only where absolutely necessary. Creditors would therefore receive the highest return possible, and importantly, honest and cooperative business owners would be quickly freed from their failed business and able to return to economic life.

Authors: Kevin B Sobel-Read, Lecturer in Law and Anthropologist, University of Newcastle; Madeleine MacKenzie, Research assistant, Newcastle Law School, University of Newcastle

The Great Property Rotation

Today we commence a short series on the results from our latest household surveys, as we examine the drivers of property demand by household segment.

These results, from our 52,000 sample to September 2017 reveals that a significant rotation is underway, with first time buyers seeking to buy, supported by recent enhanced first home owner grants, while property investors are now significantly less likely to transact. We will examine the underlying drivers, initially across the segments, and then later in more detail within a segment.

The segmentation we use is based on the master property definitions as described in our segmentation cookbook. It is essential to look across the segments, as cohorts have significantly different imperatives, which at an aggregate level are lost.

We start with an indication of which segments are most likely to transact over the next year (either buying or selling property).  We can trace the trends since 2013, as displayed below, and until recently both portfolio investors (holding multiple properties for investment purposes) or solo investors (holding one or two properties) led the field. But we are now seeing a marked slow down in investors intending to transact. For example, in 2015, 77% of portfolio investors were intending to transact, today this is down to 57%, and the trend in down. Solo investors are down from a high of 49% to 31%, and again is trending lower. Later we will examine the drivers behind these trends.

In contrast, the proportion of Down Traders is 49%, has been rising a little. Demand remains quite strong, and has overtaken demand from solo investors.  We also see a rise in demand from those seeking to refinance, with around 31% expecting to transact, in 2013, this was 13%. Finally, we see an uptick in First Time Buyers looking to buy, support, as we will see later by the FHOG available. First Time Buyers are also saving harder, with 82% saving, up from a low of 71% in 2014.

Given the rotation we have described, there is a slowing of demand for more finance (relatively speaking) from both Portfolio and Solo Investors, while demand from First Time Buyers, Up Traders and those seeking to Refinance is greater.

Overall the home price growth expectations is lower, and trending down. We see that Up Traders now more bullish than Portfolio or Solo Investors.

Finally, we see that usage of mortgage brokers continues to vary by segment, with those seeking to refinance most likely to use a broker, (77%), then First Time Buyers (64%) and Portfolio Investors (50%)

Next time we will look in more detail and the drivers within each segment.

The results from this analysis will also flow into the next edition of our flagship report The Property Imperative, due out next month.


Who holds more than one job to make ends meet?

From The Conversation.

Women who work in the arts or services industries, and who are young, are the ones most likely to be working more than one job in Australia.

HILDA Survey data show that, in recent years, approximately 7% to 8% of employed people hold more than one job. And while this hasn’t been growing, the proportion of people using multiple jobs as a way of achieving full-time employment has been rising. This is when a worker combines two or more part-time jobs that add up to 35 or more hours per week.

Overall, the HILDA Survey data suggests there are two broad groups of multiple job holders. The first group is made up of those who supplement their full-time employment with a relatively small number of additional hours of employment, perhaps doing the same kind of work as their main job – such as private tutoring done by teachers and informal child care provided by child care workers.

The second group comprises those working part-time in their main job and using multiple jobs as a means to getting enough hours of work. For these people, it may be more likely that their second job is a different type of work to their main job.

This second group has grown in size since the global financial crisis, rising from approximately 54% of multiple job holders in 2008 to approximately 62% in 2015. Associated with this has been growth in people using multiple jobs as a route to full-time employment. In 2014 and 2015, approximately one in four multiple job holders were part-time in each of their jobs, but full-time in all jobs combined. This was up from approximately one in six multiple job holders in the mid-2000s.

This growth is likely to be strongly connected to the rise in underemployment – part-time employed people who want more hours of work – that has occurred since the global financial crisis.

When an increasing number of people can’t find a full-time job (or a part-time job with sufficient hours), it’s unsurprising that there is a rise in part-time employed people taking second jobs, as a solution to insufficient hours.

Women holding more than one job

It’s women who are more likely to hold more than one job. This is likely to be connected to the higher proportion of women than men who are employed part-time, since multiple job-holding is more common among part-time workers.

There are also substantial differences by age group. Employed people aged 15-24 are the most likely to hold multiple jobs, and employed people aged 65 and over are the least likely to hold multiple jobs. Women aged 45-54 are also relatively likely to have multiple jobs.

The differences by age group in part reflect the prevalence of part-time employment in each age group. People aged 15-24 are particularly likely to be employed part-time.

However, other factors are also likely to play a role. For example, a significant proportion of women aged 45-54 could be seeking to increase their hours of work as their children get older, and for some this will involve taking on a second job.

The types of work where more than one job is common

There may be some truth to the stereotype of the underemployed actor working as a waiter. Approximately 15% of employed people whose main job is in arts or recreation services industries have more than one job. People employed in education and training and health care and social assistance industries also have quite high rates of multiple job holding.

In these industries in particular, there are more opportunities for extra work in the same industry. For example, teachers may be able to privately tutor outside of school hours, and child care workers (who are in the health care and social assistance industry) can provide informal child care outside of child care centre operating hours.

Community and personal service workers, followed by professionals, have relatively high rates of multiple job holding. Managers, machinery operators and drivers and technicians and trades workers have relatively low rates of multiple job holding. These differences also reflect both rates of part-time employment and opportunities for supplemental work outside the main job.

The HILDA data further show that multiple job holding is typically not a long-term arrangement. On average, over 50% of multiple job holders in one year no longer hold more than one job in the following year. Whether this will continue to be the case if current high levels of underemployment persist remains to be seen.

Author: Roger Wilkins, Professorial Research Fellow and Deputy Director (Research), HILDA Survey, Melbourne Institute of Applied Economic and Social Research, University of Melbourne

Liar Loans and Household Finances – Property Imperative Weekly 16th Sept 2017

Risks in the property sector continue to rise, as we look at new data on household finances, the competitive landscape in banking and liar loans. Welcome to the Property Imperative to 16th September 2017.

We start our weekly digest looking at the latest data on the state of household finances. Watch the video, or read the transcript.

The Centre for Social Impact, in partnership with NAB released Financial Resilience in Australia 2016. This shows that while people are more financially aware, savings are shrinking and economic vulnerability is on the rise. In 2016, 2.4 million adults were financially vulnerable and there was a significant decrease in the proportion who were financially secure (35.7% to 31.2%). People were more likely to report having no access to any form of credit in 2016 (25.6%) compared to 2015 (20.2%) and no form of insurance (11.8% in 2016 compared to 8.7% in 2015). A higher proportion of people reported having access to credit through fringe providers in 2016 (5.4%) compared to 2015 (1.7%).

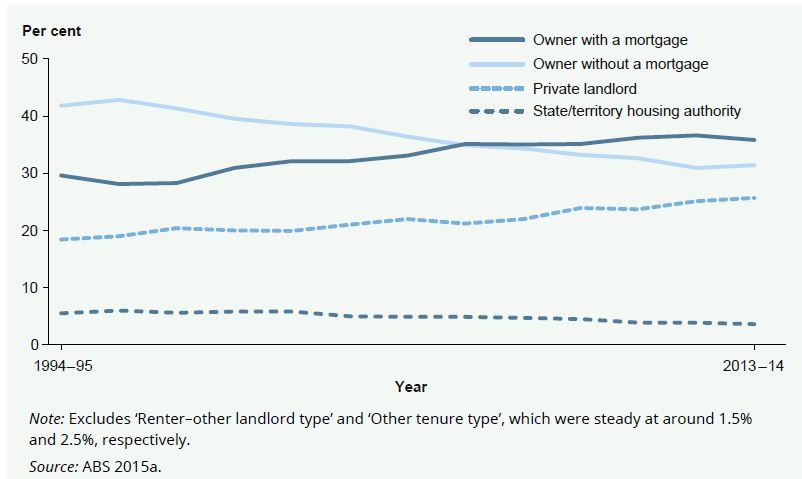
The ABS published their Survey of Household Income and Wealth. More than half the money Australian households spend on goods and services per week goes on basics – on average, $846 out of $1,425 spent. Housing costs have accelerated significantly. The data shows that more households now have a mortgage, while fewer are mortgage free. Rental rates remain reasonably stable, despite a rise in private landlords.

We published our Household Finance Confidence Index for August, which uses data from our 52,000 household surveys and Core Market Model to examine trends over time. Overall, households scored 98.6, compared with 99.3 last month, and this continues the drift below the neutral measure of 100. Younger households are overall less confident about their financial status, whilst those in the 50-60 year age bands are most confident. This is directly linked to the financial assets held, including property and other investments, and relative incomes. For the first time in more than a year, households in Victoria are more confident than those in NSW, while there was little relative change across the other states. One of the main reasons for the change is state of the Investment Property sector, where we see a significant fall in the number of households intending to purchase in NSW, and more intending to sell. One significant observation is the rising number of investors selling in Sydney to lock in capital growth, and seeking to buy in regional areas or interstate. Adelaide is a particular area of interest.

There was more mixed economic news this week, with the trend unemployment rate in Australia remaining at 5.6 per cent in August and the labour force participation rate rising to 65.2 per cent, the highest it has been since April 2012. However, the quarterly trend underemployment rate remained steady at 8.7 per cent over the quarter, but still at a historical high, for the third consecutive quarter. Full-time employment grew by a further 22,000 in August and part-time employment increased by 6,000.

The RBA published a discussion paper The Property Ladder after the Financial Crisis: The First Step is a Stretch but Those Who Make It Are Doing OK”. Good on the RBA for looking at this important topic. But we do have some concerns about the relevance of their approach. They highlight the rise of those renting, and attribute this largely to rising home prices. As a piece of research, it is interesting, but as it stops in 2014, does not tell us that much about the current state of play! A few points to note. First, the RBA paper uses HILDA data to 2014, so it cannot take account of more recent developments in the market – since then, incomes have been compressed, mortgage rates have been cut, and home prices have risen strongly in most states, so the paper may be of academic interest, but it may not represent the current state of play.   Very recently, First Time Buyers appear to be more active. More first time buyers are getting help from parent, and their loan to income ratios are extended, according to our own research. Also, they had to impute those who are first time buyers from the data, as HILDA does not identify them specifically.  Tricky!

ANZ has updated its national housing price forecast. They think nationwide prices will finish the year 5.8% higher, though prices are now 9.7% higher than a year ago. They attribute much of the slow-down in home price growth to retreating property investors. They also think Melbourne will be more resilient than Sydney.

Banks have been putting more attractor rates into the market to chase low risk mortgage loan growth this week.  CBA advised brokers that the bank is offering a $1,250 rebate for “new external refinance investment and owner-occupied principal and interest home loans” and some rate cuts.  ANZ increased its fixed rate two-year investor loans (with principal and interest repayments) by 31 basis points to 4.34 per cent p.a., while its two-year fixed resident investor loan with an interest-only repayment structure fell by 10 basis points to 4.64 per cent p.a. Suncorp also reduced fixed rates on its two and three-year investment home package plus loans by 20 and 30 basis points, respectively. The new rate for both is 4.29 per cent p.a., provided that the loan is for more than $150,000 and the loan to value ratio (LVR) is less than 90 per cent. MyState Bank has announced a decrease in its two-year fixed home loan rates for new, owner-occupied home loans with an LVR equal to or below 80%, effective immediately. Data from AFG highlights that the majors are reasserting their grip on the mortgage market – so much for macroprudential.

A UBS Report on “liar loans” grabbed the headlines. It is based on an online survey of 907 individuals who had taken out mortgages in the last 12 months and claimed 1/3 of mortgage applications (around $500 billion) were not entirely accurate. Understating living costs was the most significant misrepresentation, plus overstating income, especially loans via brokers. ANZ was singled out by UBS for an alleged high proportion of incorrect loans. Of course the industry rejected the analysis, but we have been watching the continued switching between owner occupied and investor loans – $1.4 billion last month, and more than $56 billion – 10% of the investor loan book over the past few months. This has, we think been driven by the lower interest rates on offer for owner occupied loans, compared with investor loans. But, we wondered if there was “flexibility with the truth” being exercised to get these cheaper loans. So UBS may have a point.  They conclude “while household debt levels, elevated house prices and subdued income growth are well known, these finding suggest mortgagors are more stretched than the banks believe, implying losses in a downturn could be larger than the banks anticipate”. Exactly.

The Treasury released their Affordable Housing draft legislation, which proposes an additional 10% Capital Gains Tax (CGT) benefit for investors who provide affordable housing via a recognised community housing entity. It also allows investment for affordable housing to be made via Managed Investment Trusts (MIT). The focus is to extend market mechanisms to get investors to put money into schemes designed to provide more rental accommodation via community housing projects. Whilst the aims are laudable, and the Government can say they are “Addressing Affordable Housing”, the impact we think will be limited.

APRA’s submission to the Productive Commissions review on Competition in the Australian Financial System review discusses the trade-off between financial stability and competition. They compared the banks’ cost income ratios in Australia with overseas, and suggests we have more efficient banks here – but they fail to compare relative net income ratios and overall returns – which are higher here thanks to a weaker competitive environment. They conclude that whilst some competition is good, too much risks financial stability.

The House of Representatives Standing Committee on Economics heard from the regulators this week. The focus was the banks’ out of cycle mortgage rate price hikes. Some of the banks have attributed the rise in rates to the regulatory changes but are they profiteering from the announcement? ASIC said the issue was whether the public justification for the interest rate rise was actually inaccurate and perhaps false and misleading, and therefore in breach of the ASIC Act. ASIC is currently “looking at this issue” and will be working with the ACCC, which has been given a specific brief by Treasury to investigate the factors that have contributed to the recent interest rate setting.

APRA was asked if lenders’ back book IO repricing practices were “actually opportunistic changes” that had effectively used the APRA speed limits as excuses to garner profit. Deflecting the question, APRA said it would wait to see what came out of inquiries by the ACCC and ASIC, but it was not to blame for any rate hikes, saying “a direct assertion that we made them put up interest rates is clearly not true”.

We think at very least the banks were given an alibi for their rate hikes, which have certainly improved margins significantly.

Finally, the ABS Data on Lending Finance to end July highlighted the rise in commercial lending, other than for investment home investment, was up 2%, while lending for property investment fell as a proportion of all lending, and of lending for residential housing. This included significant falls in NSW, further evidence property investors may be changing their tune.

So, finally some green shoots of business investment perhaps. We really need this to come on strong to drive the growth we need to stimulate wages. The upswing is there, but quite small, so we need to watch the trajectory over the next few months.  Overall lending grew 0.64% in the month, (which would be 7.8% on an annualised basis), way stronger than wages or cpi. So household debt will continue to rise, relative to income, so risks in the property sector continue to grow.

And that’s the Property Imperative to 16th September 2017. If you found this useful, do subscribe to get future updates and thanks for watching.

Income inequality may be declining but financial vulnerability is increasing

From The Conversation.

If you needed A$2,000 in a hurry where would you get it? 70% of those we surveyed said they would ask friends or family, although almost half said that it’s very or fairly unlikely that their social connections could help.

This is just one of the takeaways from our new report, funded by NAB, that shows financial resilience is declining in Australia. Large numbers of Australians are struggling to meet expenses, pay bills and manage or recover from financial shocks despite two decades of GDP growth, declining income inequality and increasing financial capability.

And while more adults in Australia are reporting regular social contact, and fewer are reporting needing community or government support, the number of Australians needing support but not receiving it has increased from 3.2% to 5.3%.

The problem is especially acute for those on low incomes. A recent report found most low-income households are unable to afford a minimum and healthy standard of living, with their incomes falling short by between A$9 and A$89 a week.

In this week’s Household Expenditure Survey, the Australian Bureau of Statistics found that two in every five households are experiencing at least one indicator of financial stress. In households with incomes in the bottom 40%, this ratio increases to one in two.

People on the lowest incomes are:

  • 12 times more likely to be unable to raise A$2,000 in a week for something important
  • Five times more likely to be unable to pay a utility bill on time
  • Ten times more likely to be unable to heat their homes than the highest income households.

The lowest income households are also more likely to be socially isolated than the highest income group. For example, they were at least ten times more likely to be unable to afford a special meal once a week or a night out once a month.

As you can see in the above graphic, the proportion of Australian adults who are financially secure has decreased significantly between 2015 and 2016, from 35.7% to 31.2%. One in eight Australians (12.6%) now experience severe or high financial stress, up from 11.1%.

In practical terms financial stress may mean a combination of limited or no savings; difficulties meeting everyday living expenses, managing debts and raising funds in an emergency; no direct access to a bank account; no access to appropriate and affordable credit and/or low levels of social support.

When you dig deeper into the data you see this is not a problem of behaviour or financial literacy. The decline in financial resilience has occurred despite a significant improvement in the proportion of people with moderate to high levels of financial knowledge and behaviour (from 50% to 55%).

This includes a knowledge of, and confidence using, financial products and services. And a willingness to seek financial advice and engage in proactive behaviours like saving, budgeting and paying more than required on debts.

This leads to the conclusion that the cause of the decrease in financial resilience is due to a decline in external resources. This means people having enough money to meet living expenses and manage debts, and having access to a bank account, appropriate credit, insurance and being able to access social and community supports when needed.

We can see this by looking at data on savings.

More Australians are saving (up to 60.2% in 2016 from 56.4%). However, as you can see in the chart below, the total amount of savings has declined. Only one in two people had three months or more of income saved (a drop from 51.9% in 2015 to 49.5% in 2016). And people with savings of a month or less increased from 27.3% to 31.6%.

More Australians are budgeting, too. With 51.6% following a budget in the latest survey as compared to 49.1% in 2015.

The data also shows us that an inability to access appropriate financial products and services affects a large number of Australians. This was mainly driven by increases in the number of people who only had indirect access to a bank account (from 1.2% in 2015 to 2.7% in 2016) and increases in the number of people who had no access to appropriate credit (20.2% in 2015 compared to 25.6% in 2016).

Appropriate and affordable credit is important to assist people who cannot draw on savings when they experience financial shocks, such as the sudden need to replace a washing machine or fridge, or to fix a car needed to get to work.

As we can see, stories of economic growth and declining income inequality aren’t capturing the whole picture. It is important that we don’t overlook the large number of people and households in Australia who are experiencing high levels of financial stress, who are struggling to pay the bills and meet basic living expenses.

Our research shows that large numbers of people and households are not prepared, or adequately supported, should a financial shock (such as an increase in interest rates or a recession) materialise.

While most people have strong social support; more appropriate, affordable and accessible financial support from the government, communities and financial institutions is required. This is along with appropriate mechanisms to help identify people most at risk and to cross refer where required.

Authors: Kristy Muir, Professor of Social Policy / Research Director, Centre for Social Impact, UNSW; Axelle Marjolin, Researcher at the Centre for Social Impact, UNSW


Treasury Releases Affordable Housing Measures

As part of the 2017-18 Budget, the Government announced it would be providing tax incentives to increase private and institutional investment in affordable housing. They have now released an exposure draft for comment.

The legislation proposes an additional 10% Capital Gains Tax (CGT) benefit for investors who provide affordable housing via a recognised community housing entity.

It also allows investment for affordable housing to be made via Managed Investment Trusts (MIT).

The purpose of public consultation is to seek stakeholder views on the exposure draft legislation and explanatory material. Deadline for submissions is 28th September.

Changes To CGT.

The Bill encourages investment in affordable housing for members of the community earning low to moderate incomes. This is achieved by allowing investors to have an additional affordable housing capital gains discount of up to 10 percent at the time a CGT event occurs to an ownership interest in a dwelling that is residential premises that has been used to provide affordable housing. By reducing the CGT that is payable upon disposal of affordable housing, it ensures that a greater proportion of the gain realised at disposal is retained by the investor.

The additional capital gains discount applies to investments by individuals directly in affordable housing or investments in affordable housing by individuals through trusts (other than public unit trusts and superannuation funds), including MITs to the extent the distribution or attribution is to the individual and includes such a capital gain.

An individual is eligible for an additional affordable housing capital gains discount (direct investment) on a capital gain if they:

  • make a discount capital gain from a CGT event happening in relation to a CGT asset that is their ownership interest in a dwelling; and
  • used the dwelling to provide affordable housing for at least three years (1095 days) which may be aggregate usage over different periods.

Only dwellings that are residential premises that are not commercial residential premises can be used to provide affordable housing. Therefore this measure does not apply to caravans, mobile homes and houseboats as they are not residential premises.

The tenancy of the  dwelling or its availability for rent to be exclusively managed by an eligible community housing provider. Community housing providers provide rental housing to tenants who are members of the community earning low to moderate incomes. Community housing providers may own some of the dwellings, however they also manage dwellings on behalf of investors, institutions and state and territory governments. Many community housing providers specialise in providing accommodation to particular client groups which may include disability housing, aged tenants and youth housing. Community housing providers are regulated by the states and territories. For the purposes of this measure an eligible community housing provider is an entity that is registered as a community housing provider to provide community housing services under a law of the Commonwealth, state or territory or is registered by an Australian.

Affordable housing through managed investment trusts.

The proposals will amend taxation laws to encourage managed investment trusts (MITs) to invest in affordable housing. They:

  • allow MITs to invest in dwellings that are residential premises (but not commercial residential premises) that are used to provide affordable housing primarily for the purpose of deriving rent; and
  • apply the concessional 15 per cent withholding tax rate to fund payments: – to the extent they consist of affordable housing rental income and certain capital gains from dwelling used to provide affordable housing; and – that are paid or attributed to MIT members who are foreign residents of jurisdictions which Australia has listed as an exchange of information country.

A MIT is a type of unit trust which investors can use to collectively invest in assets that produce passive income, such as shares, property or fixed interest assets. There also currently is significant uncertainty about the eligibility rules for trusts being MITs if investments are made in dwellings that are residential premises. This is because there is a view that investment in residential property is not made for a primary purpose of earning rental income. It is instead for delivering capital gains from increased property values, and therefore not eligible for the MIT tax concessions.

This measure clarifies the eligibility rules for trusts to be MITs if they invest in dwellings that are residential premises. This will help to provide investors with investment certainty. This change will not, however, affect MITs investing in commercial  residential premises. This means that trusts can invest in commercial residential premises and qualify as MITs provided this investment is primarily for the purpose of deriving rent consistent with the eligible investment business rules.