Market-driven compaction is no way to build an ecocity

From The Conversation.

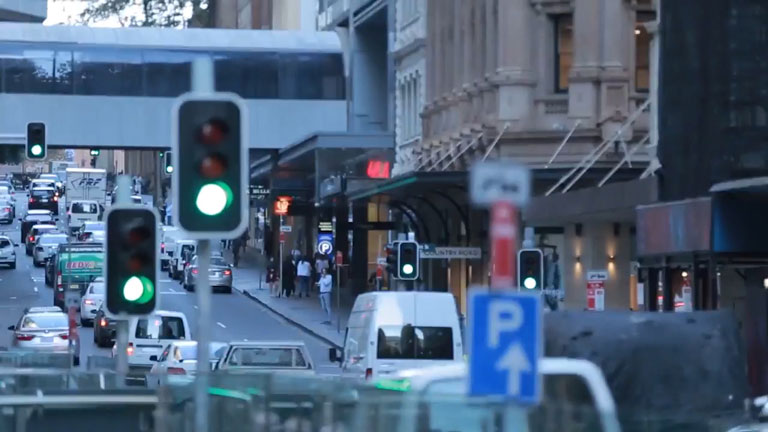
As Melbourne hosts the Ecocity World Summit this week, we might ponder the progress of Australia, a “nation of cities”, toward achieving sustainable urbanism.

Australian metropolitan planning has long subscribed to what urban geographer Clive Forster called the “compact city consensus”. This is a commitment to consolidated, well-designed, low-energy cities with high usage of public and active transport. But after decades of halting pursuit, we seem no closer to this ideal.

The 2016 State of the Environment report makes critical findings on metropolitan development. It casts these trends, at least in part, as market-driven compaction rather than planned consolidation. Leanne Hodyl’s much-reported 2014 study showed that:

High-rise apartment towers are being built in central Melbourne at four times the maximum densities allowed in Hong Kong, New York and Tokyo – some of the highest-density cities in the world.

She concludes that Australian regulation of high-rise development is uniquely weak.

Market prevails over planning

The compact city vision that has guided Australian metropolitan strategy for at least three decades was intended to realise sustainability in a form that departed from the extensive, car-dependent monocentrism of the post-war metropolis.

Yet planning has not been the principal directional force for urbanisation during this period. Instead, it has been dominated by a far more powerful political consensus, neoliberalism.

Whatever one thinks of the compact city ideal – and it is contested among urbanists – its realisation required a commitment to planned urbanisation. But that was never likely during an era of relentless hollowing-out of state capacities, including those needed to manage cities.

Instead, other forces have shaped the course of urban change. These include national policies (especially immigration, taxation and financing), technological innovation, cultural shifts, political economy (notably neoliberal governance) and increasingly unrestrained market power. This set of transformational “furies” can be grouped under the rubrics of intensification and pluralisation.

These forces have undeniably produced many welcome and stimulating changes in our cities. However, our current course, if left uncorrected, will potentially drive Australian cities further away from the ideal of sustainable urbanism.

The increases in “bad pluralities” – notably social polarisation and poverty – betray this ideal as much as physical failings do. Rising social ills, especially the ice plague and family violence, are markers of this betrayal.

‘Urban fracking’ undermines the city

Market-driven intensification has in many places permitted a fracturing and ransacking of urban value and amenity, and of human wellbeing, by development capital that has worn the thin robe of legitimacy provided by the compact city ideal.

We might summarise this as “urban fracking”: a new means of blasting through accumulated layers of material and symbolic value to extract profit.

Miles Lewis observed in 1999 that much redevelopment in Melbourne’s middle-ring neighbourhoods was parasitic. That is, it draws on (and thus depletes) existing amenity without adding to it.

More generally, this dispossession of urban value, from public (or communal) to private, takes myriad forms: amenity and infrastructure mining through overdevelopment, transfer of public housing stock to private investors in redevelopment, the continued non-taxation of unearned land value increments, privatisation of assets and services, and fast-tracked and favourable development approvals.

Ill-prepared for climate change

These various plunderings and injuries also potentially reduce the sustainability and resilience of our cities at a time of clear threat, especially the “climate emergency”.

Reducing green space and open space ratios in redevelopment areas raises particular risks for rapidly rising inner-city populations.

Consider that Melbourne City Council has prepared a Heatwave Response Plan, which will evacuate city residents to the Melbourne Cricket Ground, Etihad Stadium and the Convention and Exhibition Centre. The council recognises that 82% of residents now live in buildings “without passive ventilation”. That’s code for the air-conditioned towers that have done little for the cause of sustainability.

New modelling reveals that sea-level rise is likely to flood many inner-city high-rise redevelopment areas in Australian cities. This includes the zones identified for evacuation in Melbourne’s Heatwave Response Plan.

Governance must be restored

As the 2016 Census confirms, our rapidly growing core metro regions are evolving into ever more complex landscapes, which defy simple description. It could be tempting to conclude that the sources of their problems resist identification. But this is not true. At the core of our urban failing is governance in all of its necessary forms – economic, social and spatial.

Our cities appear increasingly unsustainable, chaotic and frankly ungovernable only because we allow this to happen. Long historical stretches of firm urban governance, notably in Brisbane and Melbourne, produced much more balanced and agreeable patterns of urbanisation than we are now experiencing.

The ever-mounting costs and failures of the “long night” of neoliberal governance are resonating ever more strongly within national politics. Economist John Quiggin believes this is feeding a new, if nascent, appetite for public intervention and ownership.

We must hope this desire for restoration of state capacities extends to the cities whose rapidly deteriorating development trajectories threaten national wellbeing.

The first necessity is to reinstate capacities for public economic governance. The need is especially great in the areas of infrastructure and urban services, which powerfully shape the general course of urbanisation.

After decades of relentless privatisation and deregulation, however, there is little to govern and little to govern with.

To improve metropolitan functioning, there will be no escaping the necessity of what the late ANU academic Peter Self described as “rolling back the market”. This will require nationalisation of key assets, especially infrastructure, and stronger regulation of urban amenities, especially energy, transport and hydraulic services.

This is the first, urgent step towards resetting our urban course for sustainability. State governments could do so without delay.

Unfortunately, most cannot yet conceive of a true break from neoliberal urbanism. The New South Wales government recently privatised its land registry. South Australia and Victoria plan to do the same.

If this mindset can be changed, the next imperative is to establish strong planning governance for our metropolitan regions so our freewheeling development furies can be steered towards more sustainable ends. Renewal of governance is the key to surviving let alone thriving in the urban age.

Author: Brendan Gleeson, Director, Melbourne Sustainable Society Institute, University of Melbourne

It’s official. Regular Australians are getting poorer

From The New Daily.

Of all the measures of wellbeing of Australia’s workers and families, one has reliably increased over the decades. That is despite droughts, floods, recessions, changes of government, jobless rises and falls, and housing booms and busts. Until now.

‘Household gross disposable income’ quantifies the cash families and individuals receive from all sources – jobs, investments and other income streams – after taxes and the Medicare levy are paid.

So it is a handy guide to how much national income goes to regular working people. It is measured quarterly by Australia’s statistics bureau in the series on the nation’s finance and wealth.

Since records have been kept, the amount of money Australian families have been free to spend has increased steadily almost every year.

In the past 30 years, there have been only four 12-month periods when money available to spend has declined compared with the previous year.

The first was in the year to December 2002 when Australia – and the world – was whacked by the early 2000s global recession.

The second was the year to December 2009, when all developed economies were in turmoil brought about by the global financial crisis.

Both times, the indicator returned to strong positive growth in the following quarters.

Disturbingly, however, the last two losses of disposable income were in 2015 and 2017, during periods of strong global recovery, robust trade, excellent business revenue and record corporate profits.

‘Household gross disposable income’ fell in the year to December 2015, the transition year from prime minister Tony Abbott and treasurer Joe Hockey to Malcolm Turnbull and Scott Morrison.

There is no obvious explanation for this drop apart, perhaps, from Mr Turnbull’s observation that his predecessor had “not been capable of providing the economic leadership our nation needs”.

The latest figures show that ‘household gross disposable income’ fell again in the March 2017 quarter.

The amount Australian families were free to spend declined between January and March to $278.6 billion for the nation overall. That followed a significant fall the quarter before, down from $299 billion to $296.7 billion.

Hence, the decline over six months was a staggering $20.4 billion. That is the largest dollar decline in history and the steepest percentage drop since the 2002 recession.

Quarterly drops are not uncommon, but four quarterly declines in the space of six quarters – which has just happened – certainly is. Outside global recessions, it is unprecedented.

The figures are better interpreted over a full year, and when matched against the number of households.

Using ABS household numbers, disposable income is now $29,640 per household per year. That is down from $31,960 six months ago. It is well below the $31,650 at the end of 2013.

Allowing for the effects of inflation, earnings peaked in 2011, 2012 and 2013, despite the impact of the global crisis.

Households now, however, are earning about the same as in 2007, towards the end of the Howard years. Since then, of course, executive pay packages, MPs’ salaries, professional incomes and company profits have all risen spectacularly.

The same ABS data showed household net savings increased by a puny $7.69 billion in the March quarter. That is the lowest rise since June 2008.

The total increase in savings for the 12 months to the end of March was just $57.94 billion, the lowest since 2008-09, when the GFC was starting to take its toll.

Why?

As The New Daily has regularly reported, wages have been depressed in the past three years, the tax burden has shifted from corporations and high-income professionals to wage and salary earners, and both unemployment and underemployment remain entrenched.

To economists, this shift of income from the poor and middle to the rich is not just a matter of fairness, it is also a serious drag on the economy.

When household disposable income declines, so does revenue in retail, wholesale, cafes and restaurants, entertainment, the arts, tourism and transport.

These are all key areas for jobs and growth – which everyone agrees are the priorities.

Three reasons the government promotes home ownership for older Australians

From The Conversation.

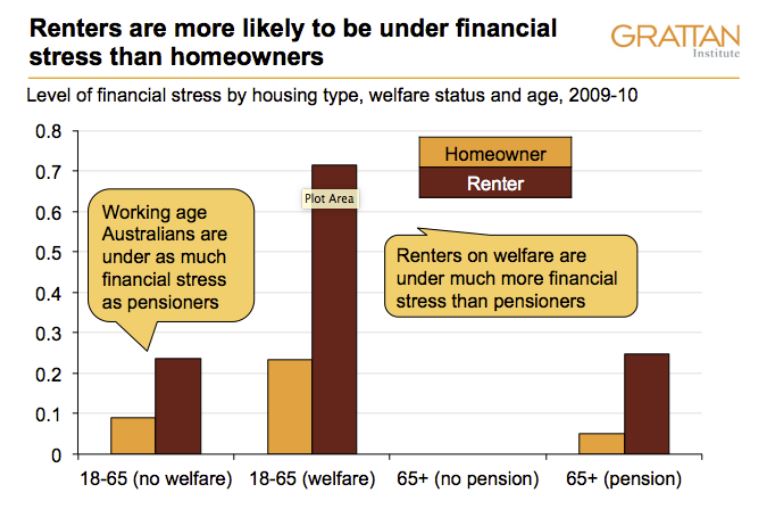
Government strategies to manage population ageing largely assume that older Australians are home owners. There is often an implied association between home ownership and ageing well: that is, older Australians who own homes are seen as having made the right choices and as being less of a budget burden.

The problem with this approach is that not everyone is or can be a home owner. A great many households are, for many reasons, locked out of home ownership.

My analysis of 20 years of federal government ageing strategies and age-focused analyses of the housing system shows that Australian governments of all persuasions have shared three common beliefs about the economic value of home ownership in later life. They have promoted home ownership as:

  • somewhere to live;
  • an asset to rent or sell; and
  • a way to access and spend equity.

Somewhere to live

Australian governments have valued and promoted home ownership because it provides somewhere to live in later life, with no regular ongoing costs such as rent.

As a 2015 Productivity Commission report argued:

Because the majority of older Australian households own their homes outright, their housing costs are typically very low, yet they enjoy the benefits from continuing to live in their homes. […] This source of value (relative to overall household expenditure) becomes markedly more important with increasing age.

Owning a home is seen as largely cost-neutral, though the costs of maintaining housing are recognised in some documents. In contrast, the privately rented home is discussed as an ongoing financial burden.

Home ownership is seen to provide economic security by freeing up income, so that people have greater disposable income for discretionary lifestyle spending in later life.

In other words, owning a home enables home owners to be consumers. While this can be seen as ensuring quality of life in older age, it also connects strongly with a broader government goal of growth in consumer spending.

An asset to rent or sell

Governments have also valued home ownership as an asset that people can rent out or sell so they can pay for costs associated with moving to “age-appropriate” housing. This includes paying bonds for retirement villages or nursing homes.

It has been suggested that older home owners are better equipped than, say, renters with the financial resources to make “appropriate” choices for housing and care in later life.

For example, they might be able to afford to buy housing within an “active lifestyle community”. And any leftover funds can fund higher levels of consumption in retirement.

So, home ownership has been understood as an individualised way of managing the risks of ageing.

People who own higher-value housing are better off in this scenario, as they will reap greater profits if they sell their home, or secure a higher income if they rent it out.

However, these benefits can be difficult to access. This is due to the very high costs of housing in some cities, and the risks associated with some retirement housing.

Accessing (and spending) housing equity

The third way governments have seen value in home ownership is through new financial products that enable home owners to access – and spend – home equity.

Emphasis is usually placed on the capacity to make a proportion of the home “liquid” while retaining overall ownership and the ongoing right to live in the house. For governments, this has two benefits:

  • It enables older people to pay for more of the costs of older age, including for aged care. This is a way of shifting these costs away from the government in situations where people are seen as having the capacity to co-contribute.
  • It enables home owners “to pay for additional services over and above the approved care”, according to the Productivity Commission. This supports government goals for economic growth by expanding the aged care market.

Funds released in this way enable lifestyle “choice” and better care in older age.

Home owners are winners

These three benefits suggest a system in which home owners are equipped with greater spending power – and hence choice – in older age. They are likely to have access to higher levels of care, and to be more able to make choices that enable them to age “well”.

Quite curiously, in some documents baby boomers are distinguished as desiring higher-quality services in later life. The capacity to access and spend home equity is seen as enabling this possibility.

The promotion of home ownership as a way of funding care in later life is part of a broader policy trend toward making people personally responsible for the opportunities they have in life. While this may make intuitive sense, it is unjust because it ignores factors that shape income and investment opportunities, including home ownership, over the life course.

Data from the 2016 Census show that households living on the median single-person income could not afford the median rent in Australia, and that home ownership is increasingly out of reach.

Single older women are among the fastest-growing group of homeless people in Australia. And, for non-home owners, poverty in later life is on the rise.

Australia needs ageing strategies that do more than assume everyone is a home owner – or that home ownership is a simple choice.

Author: Emma Power, Senior Research Fellow, Geography and Urban Studies, Western Sydney University

Census makes it official: young Australians are priced out of home market

From The New Daily.

Home ownership has continued to fall among younger Australians, the latest census has revealed.

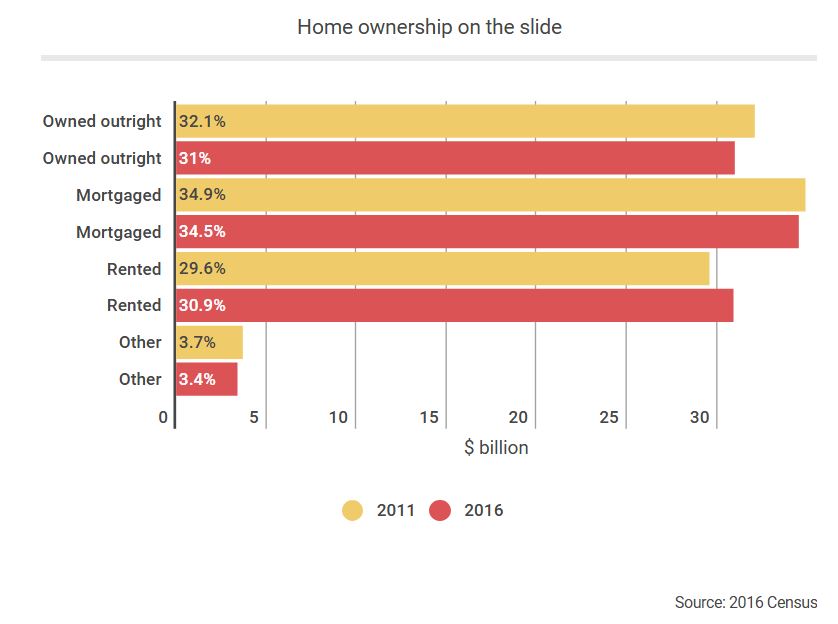
The Australian Bureau of Statistics provided data to The New Daily on Thursday that confirmed home ownership among the classic ‘first home buyer’ demographic – those aged 20 to 39 – declined again in the 2016 census.

It showed that only 36 per cent of people aged 25-29 said they owned their home outright or with a mortgage – likely the lowest level since at least the 1960s.

Home ownership for the next age group, 30-34, also declined, to 49 per cent, which is likely another record low.

And 35 to 39 year olds also dropped to 58 per cent, down from 61 per cent in the previous census in 2011.

The data is similar to that provided by the ABS to Tim Colebatch at Inside Story.

home ownership younger australians

In fact, rates of fully paid or mortgaged home ownership declined in all groups up to the age of 64.

Overall rates of home ownership did not drop dramatically between the 2011 and 2016 census, as older age groups – which are gradually accounting for a larger share of the population – actually increased their ownership.

The cause may not be as simple as many think.

Similar analysis of home ownership rates by Dr Judith Yates, one of Australia’s leading housing economists, apportioned more than a small part of the blame to growing economic inequality.

home ownership older australians
Dr Yates provided an estimate of ownership rates to a Senate inquiry in 2015, along with a detailed explanation of the causes.

In her submission, she blamed many of the usual culprits, such as declining rates of marriage and fertility among young people (which makes them less eager to buy homes), rising prices, tax concessions for investors, the scarcity of urban land for development, and demand pressures from population growth.

But Dr Yates characterised several of these factors in a way many others had not: as a consequence of worsening income and wealth inequality, beginning in the 1970s, which she dubbed “The Disappearing Middle”.

“Increasing inequality continued through from the mid-1990s until the late 2000s, having accelerated between 2003-04 and 2009-10 as a result of its uneven economic growth generating disproportionate benefits for those in the top half of the income distribution,” Dr Yates wrote in her 2015 submission.

“Disproportionate growth in incomes at the top end of the income distribution meant increased borrowing capacities for households with high home ownership propensities.”

Her submission also blamed the increasing income disparity on uneven economic growth; high inflation and high interest rates in the 1980s; the burden of HECS debts; and the fact that the financial liberalisation of the 1990s “benefited high-income households”.

“Encouraged by persistent and high capital gains from the mid-1990s generated by population and real income growth and underpinned by housing supply shortages, established households – the primary beneficiaries of increasing income and wealth inequalities – increased their demand both for owner-occupied housing and, increasingly, for investment housing.”

Dr Yates noted that tax concessions for landlords, such as negative gearing and the capital gains tax concession, are also “biased towards high-income households”.

In a way, this is good news. The fact that most of Australia’s mortgage debt is held by “high-income, high-wealth households”, as Dr Yates put it, makes the economy less likely to undergo a US-style mortgage crash, as the Reserve Bank has noted many times, because that global crisis was driven by a boom in lending to low-income households.

The bad news, confirmed by the latest census, is that younger Australians are increasingly squeezed out of the market, not just by demographic change, but by the greater accumulation of wealth at the top of society.

As Dr Yates wrote: “These are the households with an economic capacity to outbid many potential first home buyers and who benefit from tax privileges that provide them with an incentive to do so.”

What income inequality looks like across Australia

From The Conversation.

With affordable houses increasingly out of reach, wage growth slow and household debt high, Australians are certainly feeling poor. But how do they compare to their neighbours? New Census data confirms there’s a lot of variability in income.

The Census breaks the country up into 349 geographic regions (named in quote marks below), some of which cover more than one major town and some of which group related suburbs within cities. We examined 331 of these regions, excluding those containing fewer than 1,000 households.

The data show there are high levels of income inequality within these regions. A simple way to measure this is to look at the ratio of income between those who are well off (the top 20% within a region) and of those who are relatively disadvantaged (the bottom 20%) in the Census data. In Australia the weekly household income for the top 20% (A$1,579 per week) is 3.5 times the income of the bottom 20% (A$457).


The “Melbourne City” region has the most unequal incomes in Australia, where the top 20% have an income that is 8.3 times as high as those in the bottom 20%. “Adelaide City” (ratio of 5.5) and the “Sydney Inner City” (4.8) also have quite high levels of inequality.

Two of the poorest regions in the Northern Territory also have very high inequality. These are the vast region that encircles Darwin, called “Daly, Tiwi, West Arnhem” (ratio of 5.2) and the “East Arnhem” region (5.3).

However, there are regions with varying income levels, that also had relatively low inequality ratios. The region of “Molonglo”, in South Canberra (ratio of 2.2), “West Pilbara” in Western Australia (2.4) and “Kempsey, Nambucca” on New South Wales’ north coast (2.5) all have low levels of inequality.

For our analysis, we used equivalised household income. Equivalisation is a technique in which members of a household receive different weightings, based on the amount of additional resources they need.

The Australian Bureau of Statistics assumes that the first adult in a household has a weighting of 1, each additional adult a weighting of 0.5, and each child a weighting of 0.3. Total household income is then divided by the sum of the weightings for a representative income.

Incomes across Australia

For the whole of Australia, the equivalised median household income (the income in the middle of the distribution) is A$878 per week. The region with the lowest median income was “Daly, Tiwi, West Arnhem” in the Northern Territory, at A$510 per week.


However, several regional areas like “Maryborough, Pyrenees” (northwest of Ballarat in Victoria), “Kempsey, Nambucca” (NSW), “Maryborough” (between Bundaberg and the Sunshine Coast in Queensland), “Inverell, Tenterfield” (in NSW’s Northern Tablelands) and “South East Coast” in Tasmania all had median incomes of A$575 per week or less.

At the other end of the distribution, households in leafy suburbs of North Sydney – “Mosman” (NSW) had a median income of A$1,767 per week. Areas like “South Canberra” (ACT), “Manly” (in Sydney’s east) and the mining-dominated “West Pilbara” (WA) all had median incomes of A$1,674 or more per week.

We also looked at the extremes of the distribution. We define high income as those households with an income of A$1,500 or more per week. This equates to about 22% of the population. We defined low-income households as having an income of less than A$400 per week (about 14% of households).

Around 40% of households in the “Daly, Tiwi, West Arnhem” region were classified as being in poverty compared to around 6% in “North Sydney, Mosman” region. Conversely, around 60% of households in this region were classified as having high income, compared with only 6% of households in “Kempsey, Nambucca”.

How segregated are we within regions and cities?

While government policy is often delivered at the regional level, people live their lives at the local or neighbourhood level. However, the relatively disadvantaged and the upper-middle class are often segregated within these regions.

Richard Reeves of the Brookings Institute argues the segregation of the upper-middle class in Australia means this group “hoards” the benefits in the region they live in. Among the location advantages he lists are: access to the best schools, opportunities to network with the wealthy and powerful and the ability to disproportionately accrue capital gains on housing assets. To avoid this kind of “opportunity hoarding”, the rich and poor would need to be evenly spread within a region.

A simple way to look at this is through a “dissimilarity index”. In essence, this measures the evenness with which two groups are spread across a larger area. It ranges from zero to one, with higher values indicating a more uneven distribution and zero indicating complete mixing.

Looking at the distribution of the high income. Across Australia, the dissimilarity index has a value of 0.27. This means that around 27% of high-income households would have to move neighbourhoods to make the distribution completely even.

This varies quite substantially by region. “Far North” (encompassing Cape York in QLD) has a dissimilarity index of 0.42. “Auburn” (in western suburbs of Sydney, NSW) and “Playford” (on Adelaide’s northern fringe) also have quite large values.

Our richest regions tend to have the most even distribution of the wealthy, with “North Sydney, Mosman”, “Molonglo” and “Manly” having values of 0.06 or less.

“East Arnhem” has a very high level of concentration of low income individuals by neighbourhood, with a dissimilarity index of 0.70. The next two highest regions (“Katherine” and “Alice Springs”) are also in the Northern Territory, with index values of 0.53 and 0.55 respectively.

We can also compare the measures we used, to find out how they relate to each other. The following figure shows that the richest regions tend to be those with the highest level of income inequality.

However, as inequality goes up, there tends to be a greater concentration of low income households by neighbourhood (there’s also less of a concentration of high income households).

Have and have nots

It’s true that the level of income mobility is higher in Australia than it is in the US. However, Australia also has prominent examples of economic policies that disproportionately benefit the upper-middle class, such as the capital gains tax discount and superannuation tax incentives.

Australia also has a geographically concentrated income distribution, with the rich living in neighbourhoods with other rich people. The poor are also more likely to live in close proximity to people who share their disadvantage.

If Richard Reeves is right, and the spatial segregation of high and low income households reinforces inequality across the generations, then policies that encourage the mixing of different social classes in the same neighbourhood and region should be a way forward.


Authors ; Nicholas Biddle, Associate Professor, ANU College of Arts and Social Sciences, Australian National University;  Francis Markham, Research Fellow, College of Arts and Social Sciences, Australian National University


Banks do what RBA won’t: hike interest rates

From The New Daily.

The Reserve Bank may hold rates for as long as a year, but mortgage borrowers could be punished anyway by rising house prices and gouging by the banks.

Australia’s central bank held the official cash rate at 1.5 per cent for the tenth time on Tuesday. It hasn’t moved since a 25 basis point cut in August 2016.

But this hasn’t stopped the banks. They have refused to pass on the full benefit of the RBA’s record-low rates in order to offset costs and prop up profits.

Analysis by The New Daily of official data published on Tuesday showed that the gap between the RBA rate and the standard rate banks quote to mortgage borrowers is around the widest in 20 years.

RMIT economist Dr Ashton De Silva, an expert on the housing market, said it was “conceivable” that banks could widen this gap even further in coming months in response to rumblings in the global economy.

He pointed to the impact of Brexit and the Federal Reserve pushing up rates in the US as factors that could force Australian banks to pay more to borrow overseas and pass on the costs to owner-occupiers.

svr spread to cash rate

This spread between the official rate – which the RBA insists is still the “main driver” of bank funding costs – and the Standard Variable Rate banks quote to prospective customers is sitting perilously close to four percentage points, the biggest margin since 1994.

The SVR is higher than what most customers actually pay, but the gap is similar for discounted rates.

The good news for borrowers is that the RBA probably won’t hike rates for a few months more, according to the market.

The futures market is tipping rates won’t rise until next year, and even then, not by much. The ‘yield curve’ in that market shows rates are expected to reach about 1.75 per cent by November 2018.

But that’s not much relief if the banks push up rates in the interim in response to rising borrowing costs.

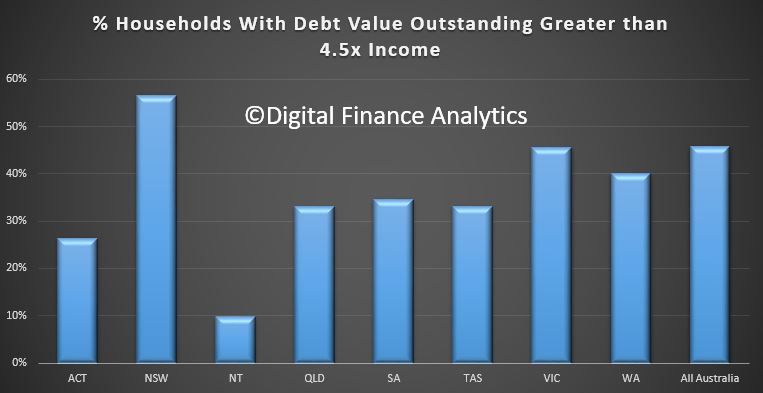
Martin North at Digital Finance Analytics said lenders were likely to continue penalising investors and interest-only borrowers, while leaving owner-occupier rates roughly where they are.

“Last year there was a massive race to the bottom in terms of discounts to try to gain volume and share. Many banks dented their margins in the process,” Mr North told The New Daily.

“They’ve now got the perfect cover, thanks to APRA’s regulatory intervention, and so I’d expected to see mortgage rates continuing to grind higher, particularly for investors and anyone on interest-only.”

futures market yield curve rba

The RBA’s cash rate may be the “main driver” of bank funding costs, but it’s not the only driver. Australian banks also borrow heavily in overseas money markets such as London and New York, where central banks are eyeing rate hikes, and from term deposits in Australia.

Owner-occupier mortgage rates are still lower than they were in 2011, when the RBA began cutting. Since then, the official cash rate has fallen by almost 70 per cent, from 4.75 to 1.5 per cent.

The problem for borrowers is that rising house prices (fuelled in part by low rates) are negating the benefits.

Rate cuts are supposed to give households more disposable income by reducing their mortgage repayments.

But interest is only half a mortgage. The rest is ‘principal’, which is being pushed up by higher property values, especially in Sydney and Melbourne.

This means the total amount of money we’re repaying to banks is high and staying high, despite what the RBA has been doing.

The Bank for International Settlements has estimated that the average Australian household spent 15.3 per cent of income on interest and principal repayments (a measure known as the ‘debt service ratio’) over the last three months of 2016, its latest estimate.

debt to service ratio

This is back to levels last seen in 2013, which means the benefits of low rates must be getting swamped by house price rises.

Australia’s debt service ratio is now third behind the Netherlands (17.4pc) and Denmark (15.9pc), putting us above a comparable economy like Canada (12.3pc) and well above bigger economies such as the USA (8.2pc) and United Kingdom (9.7pc).

Bloom and boom: how babies and migrants have contributed to Australia’s population growth

From The Conversation.

Population change has long been a topic of public debate in Australia, periodically escalating into controversy.

It is inextricably linked to debates about immigration levels, labour force needs, capital city congestion and housing costs, refugee intakes, economic growth in country areas and northern Australia, the “big versus smaller” Australia debate, and environmental pressures.

Views about the rate of population growth in Australia are numerous and mixed. At one end of the spectrum are those who are vehemently opposed to further population increases; at the other end are supporters of substantially higher population growth and a “very big” Australia.

Logically, population debates usually quote Australia’s demographic statistics. But there is value in comparing our population growth in the international context.

Average growth rates compared globally

Although growth rates have fluctuated considerably from year to year, statistics just released by the Australian Bureau of Statistics (ABS) show that Australia’s population grew by 3.75 million between 2006 and 2016. This indicates an average annual growth rate of 1.7%.

As the chart below shows, this was quite high compared to other countries and global regions. Over the decade, other English-speaking countries such as New Zealand, Canada and the US all experienced growth rates lower than Australia’s. The world’s more developed countries in aggregate grew by an annual average of 0.3%.

The world’s population as a whole increased by an average of 1.2% per year.


According to the UN Population Division, Australia ranked 90th out of 233 countries in terms of population growth rate over the decade. The countries or territories with higher growth rates were mostly less developed countries, particularly in Africa, and the oil-rich Gulf states. The only developed countries with faster rates of growth were Singapore, Luxembourg and Israel.

Why Australia’s population growth rate is higher

There are two main reasons for Australia’s high growth.

Net overseas migration (immigration minus emigration) is one major factor. It has been generating a little over half (56%) of population growth in recent years.

Demand for immigration – to settle permanently, work in Australia, or study here for a few years – is high, and there are many opportunities for people to move to Australia. In the 2015-16 financial year about 190,000 visas were granted to migrants and 19,000 for humanitarian and refugee entry. Temporary migrants included 311,000 student visas, 215,000 working holidaymaker visas and 86,000 temporary work (skilled) 457 visas.

Over the last five years, ABS figures show that immigration has averaged about 480,000 per year and emigration about 280,000. This puts annual net overseas migration at around 200,000.

This is high in international terms. UN Population Division data for the 2010-15 period reveals Australia had the 17th-highest rate of net overseas migration of any country.

But it is not just overseas migration driving Australia’s population growth. High natural increase (the number of births minus the number of deaths) also makes a substantial contribution. Natural increase has been responsible for a little under half (44%) of population growth in recent years (about 157,000 per year).

Australia has a relatively healthy fertility rate, which lately has averaged almost 1.9 babies per woman. We also enjoy one of the highest life expectancies in the world.

This combination of an extended history of net overseas migration gains, a long baby boom and a healthy fertility rate has resulted in Australia being less advanced in the population ageing transition than many other developed countries.

In particular, relatively large numbers of people are in the peak childbearing ages. This means that even if migration fell immediately to zero the population would still increase. Demographers call this age structure effect “population momentum”.

Whether Australia’s population is growing too fast

While Australia’s population growth rate is high in a global context, this does not necessarily mean its population is growing too fast. It all depends on your point of view.

It is important to stress that the overall population growth rate is just one aspect of Australia’s demography. A more comprehensive debate about the nation’s demographic trajectory should consider a broad range of issues, such as:

  • population age structure (the numbers of people in different age groups);
  • the health and wellbeing of a rapidly growing population at the highest ages;
  • population distribution across the country;
  • economic growth and development;
  • the contributions of temporary workers and overseas students;
  • appropriate infrastructure for the needs of the population; and
  • environmental management and per-capita carbon emissions.

Progress on issues such as healthy ageing, economic development,and environmental management depend on appropriate strategies to deal with these challenges. Total population numbers will often be relevant to the discussion, but they are only part of the equation.

Author: Tom Wilson , Principal Research Fellow, Charles Darwin University

Australian household debt breaks new records

From The New Daily.

The Reserve Bank board will be facing record-high debt levels when it decides on Tuesday whether or not to follow other central banks by lifting the official cash rate.

Ten years after the global financial crisis – which many trace to the collapse of two Bear Sterns hedge funds in July 2007 – Australians are more indebted than ever, largely because of mortgages.

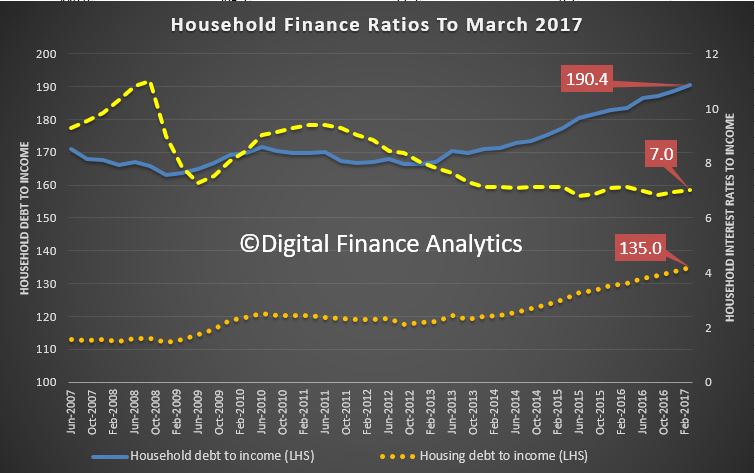
The latest official data, published by the Reserve Bank on Friday, showed that Australian households owed debt in the March quarter equal to 190 per cent of their yearly disposable income – a new all-time high.

In a speech in May, Reserve Bank governor Dr Philip Lowe blamed this trend on a combination of low interest rates, slow wages growth and house price rises fuelled by overseas investor demand and strong population increases.

At its last interest rate meeting in June, the RBA board cited persistently weak wages growth as a key factor in it keeping the cash rate on hold at a record-low 1.5 per cent – where it was widely forecast to stay on Tuesday.

Household debt will no doubt weigh heavily on the minds of the RBA board.

Last month, the Swiss-based Bank for International Settlements captured headlines across the nation by warning that Australia’s surge in household indebtedness was likely to constrain future economic growth and increase our susceptibility to another crisis.

Global ratings agencies Moody’s and Standard & Poor’s have also downgraded the creditworthiness of Australian banks over fears about unsustainable debt and inflated house prices.

household debt to income

Australia’s debt-to-income ratio concerns many experts because it is globally unusual – and because high household debt frequently coincides with financial crises.

Not even the US, just before it plunged much of the world into economic chaos, had a debt-income ratio as high as Australia’s current 190 per cent. Estimates put US household debt closer to 140 per cent in 2007.

Further data from the Reserve Bank confirmed that Australia’s debt mountain is largely a consequence of soaring property prices.

In the March quarter, Australian housing debt reached 135 per cent of annual disposable income, according to the RBA, breaking another record.

housing debt to income

Homeowners hold a large share of the debt.

According to the Reserve Bank, the ratio of owner-occupier housing debt to yearly income hit 101.8 per cent in the March quarter – yet another all-time high.

The reason the Bank for International Settlements predicted that Australia’s economic growth would be curbed by debt was that inevitable interest rates rises would reduce disposable income of indebted households.

Household consumption is crucial to Australia’s economic growth – it accounted for 57 per cent of GDP in the March quarter. Rate rises could put that GDP figure at risk by reducing spending, the BIS said.

This is a key reason why most economists are predicting the Reserve Bank won’t hike the cash rate on Tuesday.

owner-occupier housing debt to income

The RBA Shadow Board – an independent panel of economists – has put a 59 per cent probability on a rate hold being the right decision on Tuesday, compared to a 39 per cent probability for a rate hike, and only 2 per cent probability for a rate cut.

“The spotlight is turning again to the high indebtedness of Australian households,” the Shadow Board noted.

However, there is some good news on debt. A wealth divide in the Australian housing market could lessen the risk of a US-style mortgage crash.

According to the RBA governor, housing debt is heavily skewed towards the wealthy.

“This is different from what occurred in the United States in the run-up to the subprime crisis, when many lower-income households borrowed a lot of money,” Dr Lowe said in May.

The bad news is that these mortgages are increasingly invading our retirement.

“Borrowers of all ages have taken out larger mortgages relative to their incomes and they are taking longer to pay them off,” Dr Lowe said.

“Older households are also more likely than before to have an investment property with a mortgage and it has become more common to have a mortgage at the time of retirement.”

Why Australia is becoming a workers’ paradise lost

From The New Daily.

Australia was once regarded as a workers’ paradise where pay, conditions and skill levels were the envy of the world. But something is amiss.

Where once the fortunes of working people and the economy travelled hand in hand, workers have become uncoupled from national prosperity.

Australia’s record-breaking 26 years of uninterrupted growth comes as little consolation for working men and women doing it tough. While we’ve technically avoided recession for almost three decades, many workers are living in recessionary climes every bit as punishing as the infamous recession we had to have in 1991.

The headline indicators of economic growth mask a crisis of confidence in the suburbs as debt-laden households nervously ponder their financial stamina. Employment was once the reward of a prosperous economy but many Australians are in a virtual state of permanent job insecurity.

The unemployment rate hit a four-year low of 5.5 per cent in May but workers on the ground know things are more fragile than such bumper figures suggest.

They know many employers are struggling, maintaining their viability with relentless cutbacks. Those who get to keep their jobs know they can expect little movement on their pay. Wages growth is at its lowest since the 1991 recession.

Add to that the penalty rate cuts for hospitality, fast food, retail and pharmacy workers, who have lost the benefit of the minimum wage increase – and are likely to suffer a wage cut in 2018 and 2019.

The proportion of national economic output paid to workers is at an all-time low, based on trend estimates. Total labour compensation fell to 51.5 per cent of national GDP in the March 2017 quarter, the lowest since 1964.

Workers also know that employers are relying more on casual and part-time labour and the use of contractors and labour-hire workers. This not only keeps a lid on wages growth but also means the underemployment rate – employed workers wanting more hours – is at a record high of 8.8 per cent.

While households are walking on eggshells the Turnbull government gloats that it is delivering “jobs and growth”. But Reserve Bank governor Philip Lowe is concerned about wages.

Dr Lowe recently called on workers to reclaim their stake in the Australian economy by seeking wage increases. In an unusually forthright speech, he described the static wages growth as a “crisis”. He recognised that workers concerned about job security were unwilling to press for better wages.

“People value security and one way you can get a bit more security is not to demand a wage rise,” he said.

With annual wages growth of just 1.9 per cent, Dr Lowe said it “would be a good thing” for workers to “ask for larger wage rises”.

The absence of a clear recovery after the global financial crisis has left many workers in wages limbo. Workers prepared to show wages restraint in 2007-08 have not had the “bounce back” in wages that normally comes with a clear-cut recovery.

The post-GFC period also coincides with enormous advances in digital technology which has transformed business models and whole industries.

A report by the Committee for Economic Development of Australia estimates that 40 per cent of Australian jobs that exist today are likely to disappear in the next 10 to 15 years due to technological advancements.

And yet from the Turnbull government, or the opposition for that matter, there has been no sign of an honest “conversation” about the enormous changes and challenges that face workers. No blueprint for Australia’s transition to a digital economy, no investment in the training and reskilling that will be so vital to Australia’s future, no apparent understanding of what the workplaces of the future will look like.

The government is entitled to celebrate the record run of growth. But it would do well to understand the consequences of simply looking the other way as workers languish in prolonged recession-like conditions and households teeter on the brink of financial despair.

A workforce under sustained distress will ultimately impact on living standards, consumer confidence, financial viability and national productivity. The workers’ paradise, after all, was a paradise shared by all Australians.

Australia doesn’t have a population policy – why?

From The Conversation.

Australia lacks an overarching population policy or strategy. Over the years, multiple inquiries have recommended such a policy. Population policies the world over typically focus on births and migration.

As part of post-war reconstruction, Australia adopted a 2% population growth target. Mass immigration was a defining feature, and couples were called on to populate or perish. Immigration was successful, but women were big losers in the push for births.

The 1975 National Population Inquiry proved a significant moment in Australian demography. The inquiry found that Australia should not seek to influence population, but should anticipate and respond.

Population policy was revisited in the 1990s with the National Population Council. Its 1994 report found no optimal population size for Australia, but again called for a responsive population policy of preparedness.

Interest in sustainable population policy was renewed in 2010 following Kevin Rudd’s infamous endorsement of a “big Australia”. We even had a minister for population, Tony Burke, for about six months until the portfolio was expanded. Population was subsequently dropped from any ministerial title.

After an exhaustive inquiry, A Sustainable Population Strategy for Australia was released in 2011. This stopped short of recommending a population policy but removed any option of population limits. Change felt possible in shifting the narrative to a proactive endeavour concerning population matters, particularly evident in the National Urban Policy.

Despite such inquiries and recommendations to adopt a population policy, governments have so far resisted. Unsuccessful attempts at population policy can be understood in terms of difficulties in gaining political support and concerns about coercion.

But national population policy need not be coercive – unlike, for example, in India or China. Instead, it can be a series of targets and connected policy domains with oversight.

Presently, the policy landscape is disjointed. Parenting leave, family and childcare payments, and immigration are each somewhat responsive to population changes, but not prepared. Family payments have been shown not to increase birth rates.

Births, deaths, migration – and taxes

The intergenerational reports have been our only glimpse of responsiveness and preparedness. But these have increasingly been criticised for their political tone. Who could forget the Challenge of Change campaign?

Dr Karl Kruszelnicki fronted the Challenge of Change campaign.

What we know is that Australia’s population continues to age, so among the nation’s pressing issues is fewer taxpayers. The total age-related dependency ratio, of people aged over and under working age relative to the working-aged population, was 52 per 100 people in 2016.

While the child-dependency rate (0-14 year olds) is higher than the aged-dependency rate (people 65 and over), the rate of people aged less than 15 has steadily declined as the population aged 65 and over has driven increases in the so-called dependency burden.


The relative increase in people older than working age is increasing pressure on the economy and government budgets. While government spending on young people is substantial, the highest per person spending is among people aged 65 and over.

A robust workforce contributing income tax and services is essential to ensure current lifestyles are afforded to the young while also sustaining the public spending necessary for people over 65 years who have over their lives contributed to the nation.

With birth rates low and deaths increasing, natural increase is no longer driving Australia’s population. Immigration is increasingly relied on to offset the ageing of the workforce. Over half (54%) of Australia’s population growth is from net overseas migration.


Preparing for an older population

In a 2013 United Nations survey, the Australian government reported concerns about population ageing, a desire to increase the “too low” birth rate, but satisfaction with the level of net overseas migration. Interestingly, a preference for migration away from cities was also cited.

From current policy and discourse, you would not know these views were held. Most Australians also report a preference for the level of immigration to remain the same or be increased, contrary to sentiments we often hear.

Australia has time to prepare for, and make opportunities of, the challenges of an ageing population. Some countries are facing tough decisions now and it is interesting to watch the politics play out. What Japan, China and Germany show is that we need to take action now.

Insightful guides are in place already. South Australia has had a population strategy since 2004. Tasmania recently adopted one.

These state strategies focus on growth to curb economic downturn. What is important in these two cases is that both emphasise policy portfolio linkages, as well as evidence and reporting against targets without coercive measures.

What is a sensible approach to population policy?

A renewed, earnest and transparent population conversation is needed. With ever more reliance on immigration, we must go beyond the unhelpful pro-immigration versus pro-nationalism debate to consider our population prospects.

The key question is: how can Australia make opportunities of its demographic challenges?

Australia has the potential to be a global leader in innovative markets and research and development. An ageing population provides an interesting market opening; we just need to be smart about it. Without careful consideration, Australia will be merely a bystander in the increasingly competitive global market.

Policy connectedness should exist between portfolios. These include: health; housing; education, skills and training; employment; infrastructure; regional development; water and energy; environment; and migrant settlement.

We can invest more effectively in young people — our future workforce and economic lifeblood — if we consider a life-course approach to population dynamics. Family friendly, gender-equal workplaces will go a long way to ease the pressures of having children. Integral to this is affordable and accessible child care.

And establishing a ministerial portfolio overseeing population strategy would be a good start.

Author: Liz Allen , Demographer, ANU Centre for Social Research and Methods, Australian National University