Fair Work Commission to cut wages within four weeks

From The New Daily.

More than 600,000 low-wage workers in the services sector will suffer a wage cut on the first day of next month, after a judicial bench refused pleas to cancel or delay cuts to penalty rates.

In a decision handed down on Monday, the Fair Work Commission denied requests from unions for the wage cuts to be postponed for two years or, at the very least, for currently employed Australians to be quarantined from the cuts.

Instead, the Commission chose to stagger the cuts to Sunday loadings, which means workers will have their wages cut every year on July 1 until 2019 or 2020, depending on their industry.

The verdict applies to workers paid Award rates in the hospitality, fast food, retail and pharmacy sectors.

ACTU secretary Sally McManus urged Parliament to legislate against the “devastating” cuts.

“This can be stopped. Our Parliament can stop it. Malcolm Turnbull can stop it,” she told reporters.

“There is a bill before Parliament as we speak and it can be voted on in the next two weeks and bring a stop to these penalty rate cuts.

“These cuts are devastating. It’s $70 a week in total on average for workers. These are the lowest paid workers in our community.”

Employer groups had urged the Commission to not phase in penalty rate cuts at all, arguing this would boost employment sooner.

The Commission dismissed this argument by acknowledging it was “cautious” about any boost to employment flowing from lower rates of pay. Instead, it argued that workers would benefit from “an increase in overall hours worked”.

However, it did decide to impose the public holiday penalty cuts all at once, from July 1, 2017.

Ms McManus disagreed, telling The New Daily that workers would end up “working longer for less pay”.

From July 1, Sunday penalty rates will be cut by 5 percentage points across the four sectors for full- and part-time workers, bringing penalty rates to 145 per cent for fast food; 195 per cent for pharmacy and retail; and 170 per cent for hospitality.

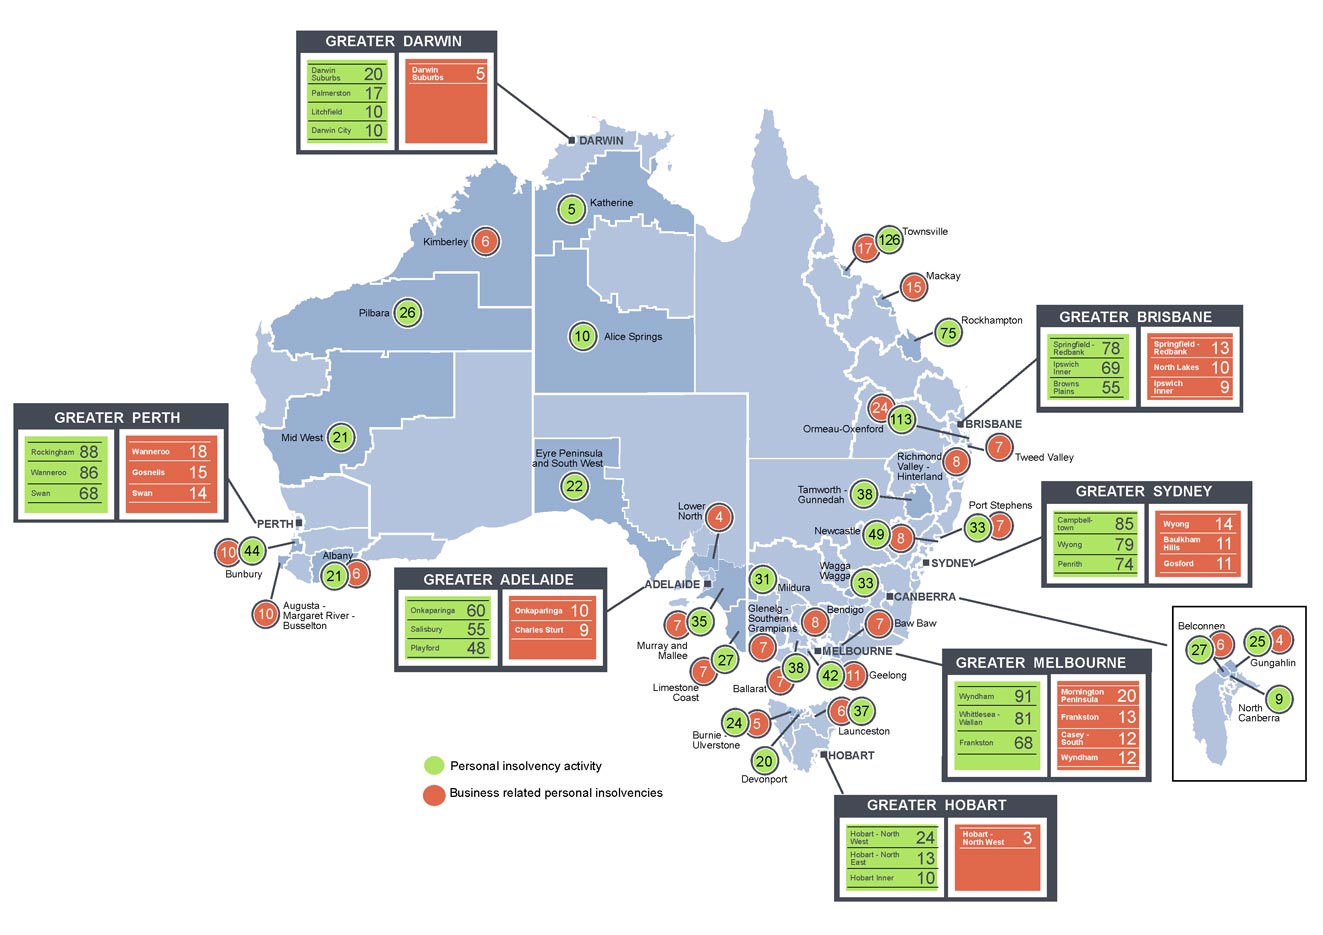
The McKell Institute, commissioned by the ACTU, has calculated, based on 2011 census data, that if the Sunday penalty rate cuts had been implemented in full on July 1, roughly 621,000 workers would have lost $1.4 billion in disposable income a year, with rural and regional areas the worst hit.

Some, such as Warren Entsch, Liberal MP for the worst affected electorate of Leichardt, have dismissed these numbers as exaggerated.

But even if the disposable income and affected worker numbers were overstated by the McKell Institute’s methodology, it would not affect the rankings. Rural and regional workers would remain the worst hit.

penalty rates electorates

The Australian Industry Group said the Commission’s decision was “fair”, but that it would have preferred for the cuts to be implemented straight away, not phased in.

Rob Mitchell, Labor MP for Australia’s second-worst affected electorate, told The New Daily that penalty rates are important because weekend workers “are missing out on what we value in Australia”.

“I know from my experience when I was with the RACV, having to work on Christmas Day and doing weekend work on both day shifts and night shifts, how this had a big impact on family life and the loss of participation in special family occasions,” Mr Mitchell said.

“This cut attacks the young, it attacks the vulnerable. The FWC does its work, and in this case it got it wrong – very badly wrong.”

Mr Mitchell was especially concerned about the impact of the cuts on consumer spending.

“For many in our communities, these cuts will mean that people have less discretionary spend. If they’ve got less discretionary spend, they’re going to be tightening things up, they won’t be going to restaurants or to the shops, so you could actually see a contraction in small town economies.”

How the changes will be phased in:


NSW first home buyer demand set to surge post July 1

From CoreLogic.

Abolishing stamp duty for first home buyers is likely to create some headaches for eligible buyers who have recently entered into contracts. Additionally we can expect first home buyer activity to stall before surging higher on July 1 2017. The long term outcome may be self-defeating due to higher demand pushing up prices.

The decision yesterday by the News South Wales Government Premier Gladys Berejiklian to provide first home buyers with a stamp duty exemption for properties with a price tag under $650,000 is likely to boost demand for this under represented segment of the market. Based on recent Australian Bureau of Statistics (ABS) data, first home buyers comprised only 8% of owner occupier mortgage commitments in March 2017, which is only marginally higher than the record low of 7.5% recorded in September last year and well below the long term average of 17%.

According to the latest CoreLogic ‘Perceptions of Housing Affordability’ report, it highlighted that across New South Wales the largest proportion of respondents (48%) identified that stamp duty was the most significant obstacle to housing affordability. Additionally, almost three quarters of respondents (74%) felt that removing or reducing stamp duty would be an effective way to improve housing affordability in New South Wales.

Clearly the state government is responding to one of the most significant pain points for prospective buyers.

The current policy provides a stamp duty exemption to first home buyers purchasing a new home with a price tag under $550,000. The new policy has substantially broader scope, providing an exemption for both new and established housing with a price tag under $650,000 and sliding discounts up to $800,000.

To put these limits into context, over the past twelve months, 45.4% of dwellings sold across New South Wales had a price tag of $650,000 or less and 58% of dwelling sales had a price tag $800,000 or less. The proportion of properties that meet the exemption criteria falls away sharply if the analysis is confined only to the Sydney metropolitan area where 25.8% of dwelling sales over the past twelve months were at a price of $650,000 or less.

With a substantial premium on detached housing, the proportions are also substantially different between the broad product types. The past twelve months saw 20.0% of Sydney houses sell for $650,000 or less while unit sales comprised just over one third of all sales (33.5%) at or below this price.

Additionally, with investor demand likely to be slowing due to higher mortgage rates, tighter credit policies and low yields; there is the potential that a rise in first time buyer demand could fill the ‘hole’ left by fewer investors in the market and offset the recent slowdown in the pace of capital gains.

First home buyers still need to contend with the challenges of raising a deposit, which is another major barrier to market entry. Housing prices in Sydney are the highest amongst the capital cities, with the latest data from CoreLogic putting the median house price at just over $1 million and median unit price at just under $743,000. Those buyers who can’t stump up a 20% deposit have been given another leg up, with stamp duty for lenders mortgage insurance also abolished.

Stamp duty on lenders mortgage insurance is charged at 9% of the premium; so a first home buyer with a 5% deposit on a $650,000 property is likely to save themselves around $2,250 (based on a premium of $25,000).

Removing or reducing the transactional costs for first home buyers is likely to provide both positive and negative consequences across the New South Wales housing market.

From a positive sense, policies aimed at improving housing accessibility for first time home buyers are likely to be positively received. Sydney is Australia’s most unaffordable housing market by any measure, and for many buyers, the cost of entry, including stamp duty and raising a deposit, is the most significant barrier to entry. On a $650,000 dwelling purchase, a non-first home buyer would be paying stamp duty costs of around $25,000; so the exemption is a substantial cost saving for a first home buyer.

On the negative side, it’s widely accepted that policies aimed at stimulating demand tend to push prices higher; there is a possibility that the new policy could ultimately be self-defeating, increasing housing demand which could place further upwards pressure on the price of housing which will exacerbate the affordability challenges even further.

The new policy comes into effect on July 1st, so we can expect first home buyer sales to stall over the remainder of June and likely surge higher from the beginning of the new financial year. For those buyers who are potentially eligible for the new exemptions but have recently entered into contacts, there is likely to be some severe disappointment that these rules aren’t applied retrospectively.

Perfect storm for housing affordability

From Mortgage Professional Australia.

First home buyers’ day of reckoning as Sydney and Melbourne prices drop and stamp duty is slashed

Property prices fell in Sydney and Melbourne over the month of March, by 1.3% and 1.7% respectively, according to CoreLogic’s Home Value Index.

Published yesterday, the Index coincided with an announcement by NSW’s State Government that stamp duty was to be abolished for first home buyers on existing and new properties under $650,000. Discounts on stamp duty will be available on properties up to $800,000.

“I want to ensure that owning a home is not out of reach for people in NSW,” explained NSW premier Gladys Berejiklian “These measures focus on supporting first homebuyers with new and better-targeted grants and concessions, turbocharging housing supply to put downward pressure on prices and delivering more infrastructure to support the faster construction of new homes.”

The state government will commit $3bn of funding for infrastructure and abolish stamp duty charged on lender mortgage insurance for FHBs. Conversely, stamp duty concessions have been removed for investors buying off the plan and the stamp duty charged on foreign investors will double to 8%.

Improving landscape for FHBs across Australia

Prospects are finally improving for first home buyers on the eastern seaboard. Both NSW and Victoria now have stamp duty exemptions for first home buyers and cooling housing markets, with property prices not moving in Sydney and increasing by just 0.7% in Melbourne over the past quarter.

CoreLogic’s data also revealed that prices in Perth and Darwin continue to fall, with sudden reversals in Hobart and Canberra and only moderate growth in other cities.

However Corelogic head of research Tim Lawless warned that price falls may not continue: “The May home value results should be viewed in the context of demonstrated seasonality; values have fallen during May in four of the past five years. Reading through the seasonality indicates that value growth in the market has lost momentum, particularly in Sydney and Melbourne where affordability constraints are more evident and investors have comprised a larger proportion of housing demand.”

Further action by APRA could reduce demand, according to Lawless: “considering we are yet to see the full effect of the recent round of macroprudential measures flow through, there is a high possibility that investor activity, and consequently housing demand, will slow further during 2017.”

Are stamp duty concessions the right way forward?

Former RBA governor Glenn Stevens, who advised the NSW government, has stated he’s not a ‘big fan’ of measures such as grants and concessions as these can simply drive up prices.     He argued that “the government might expect to achieve much more for affordability in the longer run by spending this money in other ways that would lead to lower cost supply of new housing.”

Labor has pledged to scrap negative gearing, although Treasurer Scott Morrison has claimed removing it could actually harm affordability by raising rents.

The UK government has turned against negative gearing for investors, with tax relief being phased out by 2021. This has had a huge effect on prices in London, which grew by 1.5% in the year to March compared with 15% growth the year before.

Sydneysiders blame foreign investors for high housing prices

From The Conversation.

Sydneysiders are concerned that foreign investors, and particularly Chinese real estate investors, are pushing up housing prices, according to survey findings published this month. A majority believed foreign investors should not be allowed to buy residential real estate in Sydney.

The federal budget was the government’s latest attempt at navigating a policy solution that supports its pro-foreign investment position while responding to public concern about housing affordability in Australian cities.

China’s government is also searching for a policy solution to restrict the large amount of capital that’s flowing out of the country. But the Chinese crackdown “doesn’t appear to be working”.

We surveyed almost 900 Sydneysiders to investigate their views on foreign real estate investment. The effectiveness of government regulations on foreign investment and investors was a major concern for respondents.

Views on government regulations

The survey obtained the views of people aged over 18 living in the Greater Sydney region. They were asked about housing affordability, foreign investment, the drivers of Sydney housing prices, and perceptions of Chinese investors specifically.

Support for the government’s regulation of foreign investment in housing was weak. Only 17% of respondents thought it was effective.

Almost 56% of participants believed foreign investors should not be allowed to buy residential real estate in Sydney. Only 18% believed this should be permitted.

More than 63% of participants disagreed that the “government should encourage more foreign investment in greater Sydney’s housing market”. Only 12% of participants agreed with this.

These views stand in stark contrast to the government’s geopolitical support for foreign investment in Australia.

Views on foreign investors

There is little fine-grained data about the impacts of foreign capital and investors on specific neighbourhoods and developments in Australian cities. Therefore, we did not set out to compare public attitudes against the limited empirical evidence on the effects of foreign real estate investment in Sydney.

What’s significant about the survey results is that Sydneysiders have strong views on foreign investment, despite the absence of reliable evidence. Participants’ concerns about foreign investors and investment were consistent with their concerns about the government’s foreign investment rules.

Around 63% of Sydneysiders identified the Chinese as the heavyweights of foreign investment. This is likely to be accurate, given the concentration of Chinese investment in Sydney and Melbourne.

When presented with the statement “I welcome Chinese foreign investors buying properties in my suburb”, more than 48% of participants disagreed.

Other studies, however, have shown the potential for public confusion between domestic Australian-Chinese and international Chinese buyers.

Views on the drivers of housing prices

Respondents were asked to choose up to three drivers of house prices based on their understanding of Sydney’s housing market. By far the most commonly nominated driver of house prices (64% of respondents) was foreign investors buying housing.

Roughly one in three survey participants saw low interest rates (37% of respondents) and domestic home owners (32%) and investors (32%) as the drivers of higher housing prices. Local housing analysts generally agree with this.

But more than three in four participants (78%) agreed with the statement:

Foreign investment is driving up housing prices in greater Sydney.

When framed inversely, as “Foreign investment has no impact or very small impact on greater Sydney’s housing market”, more than two-thirds of participants (68%) disagreed with the statement.

Only 6% of our participants disagreed that foreign investment was increasing real estate prices. Around 11% agreed that foreign investment had no or minimal impact.

Views on housing supply and affordability

We expected people to report that foreign people and capital are driving up housing prices and making it more difficult for Australians to compete in the housing market. But we were surprised by the findings about Sydneysiders’ views on foreign capital and housing supply.

A strong message from the real estate and property development industries is that foreign investment increases housing supply, which in turn puts downward pressure on prices.

Politicians and lobby groups argue this will help improve housing affordability in major Australian cities. But many housing analysts argue that this supply solution does not stack up for purchases made by either foreign or domestic investors.
It seems that Sydneysiders don’t accept the real estate industry message about foreign investors increasing housing supply, and therefore helping to ease housing affordability pressures.

When asked if “Foreign investment can help increase housing supply in greater Sydney”, 48% of participants disagreed with the statement. Another 25% “neither disagreed or agreed”.

An unresolved policy dilemma

The government’s dilemma is how to manage foreign investment alongside an increasing housing affordability problem in major Australian cities.

This month’s federal budget included a crackdown on foreign investors, but the government still supports foreign real estate investment.

Our survey results support other studies that suggest this pro-foreign investment stance must be accompanied by strategies to protect intercultural community relations. This must happen alongside efforts to improve housing affordability.

Authors: Dallas Rogers, Senior Lecturer, Faculty of Architecture, Design and Planning, University of Sydney; Alexandra Wong, Engaged Research Fellow, Institute for Culture and Society, Western Sydney University; Jacqueline Nelson, Chancellor’s Postdoctoral Research Fellow, University of Technology Sydney

Cost of ‘modest’ retirement up 33%: ASFA

Rising costs of living are impacting retired households according to new research.  The figures reveal couples aged around 65 will need to spend $59,971 a year and singles $43,665.

Significant hikes in the cost of power, health care, food and rates over the past 10 years have driven increases in the amounts needed to achieve both modest and comfortable retirements, according to the latest data from the Association of Superannuation Funds of Australia (ASFA).

It is more than a decade since the first release of the modest and comfortable ASFA Retirement Standard (RS) budgets.

Every three months since June 2006, they have tracked the rise and fall of items that comprise average household budgets. Updates reflect inflation and provide detailed budgets of what singles and couples need to support their chosen lifestyle.

Between June 2006 and March 2017, the RS budget at the modest level for a single person increased by 33 per cent, while the single comfortable budget rose by 23 per cent.

The budget for a couple at the modest level increased by 36 per cent and at the comfortable level by around 26 per cent.

ASFA CEO Dr Martin Fahy said the figures compared to an overall 28.6 per cent increase in the Consumer Price Index (CPI).

“The categories of expenditure that really impacted the budgets are not altogether surprising,” he said.

“Over the period, electricity costs increased by 124 per cent, health costs by 60 per cent, property rates and charges by 83 per cent and food costs by 24 per cent.

“Price changes for less essential items tended to be lower and in some cases prices fell.

“The price of clothing fell by a total of three per cent over the period with an eight per cent fall in the cost of communications (including telephone and mobile phone charges).

“The cost of international holidays rose by a relatively modest 16 per cent over the period.”

Over the more than 10 year period, the maximum Age Pension increased in real terms, by 70 per cent for a single person and 54 per cent for a couple, from a starting base far too close to the poverty level.

The Age Pension is adjusted by what is the greater of the increase in average wages or the CPI. During the period, average earnings rose by 43 per cent.

There also were some discretionary increases made to the rate of the Age Pension, particularly to the single rate. However, despite these various increases, the Age Pension alone still does not permit a retiree to achieve even a modest standard of living in retirement at the levels set by the ASFA RS.

The increases in the Age Pension over and above the increase in the CPI and in wages have helped contain the savings required at the time of retirement, in order to support either a modest or comfortable lifestyle.

On the other hand, the tightening of the means test has led to an increase in the amount of retirement savings needed to support a comfortable standard of living in retirement.

Other price increases of interest included: tobacco (not in RS budgets but consumed by many retirees) up by 178 per cent; wine up by only six per cent, but beer up 45 per cent; rents up 51 per cent; postal services up 45 per cent; vet fees (not in RS budgets) up 49 per cent; and, insurance costs up 72 per cent.

Dr Fahy said both budgets assume retirees own their own home outright and are relatively healthy.

“Of increasing concern is the reality of many more retirees at the mercy of the private rental market, so when you consider the increase in renting costs, it highlights the need for increasing numbers of retirees to have much greater super balances to support a reasonable retirement,” he said.

In the latest RS updates for the March quarter, there was a slight increase in the cost of living for retirees, with increases in the prices of petrol, medical and hospital services and electricity.

The ASFA RS March quarter figures indicate couples aged around 65 living a comfortable retirement need to spend $59,971 per year and singles $43,665, both up 0.3 per cent on the previous quarter.

Total budgets for older retirees increased by around 0.3 per cent at the comfortable level and 0.6 per cent at the modest level.

Over the year to the March quarter, there was a 1.8 per cent increase in the budgets, slightly lower than the 2.1 per cent increase in the All Groups CPI.

Dr Fahy said the cost of retirement over the most recent quarter only increased by a relatively small amount but many individuals would still find it difficult to achieve a comfortable standard of living in retirement.

“Over the longer term, the cumulative increase in retirement costs has been considerable,” he said.

The most significant price increases in the March quarter contributing to the increases in annual budgets were for automotive fuel (5.7 per cent), medical and hospital services (1.6 per cent) and electricity (2.5 per cent). Fluctuations in world oil prices continue to influence domestic fuel prices.

The most significant offsetting price falls were for international holiday travel and accommodation (-3.8 per cent) and fruit (-6.7 per cent).

Overall, food prices fell 0.2 per cent in the March quarter. The main contributor to the fall was fruit (-6.7 per cent), due to plentiful supplies of both year-round and summer fruit. Over the last 12 months, food prices rose by 1.8 per cent.

International holiday travel and accommodation prices fell 3.8 per cent due to the winter off-peak seasons in Europe and America.

Clothing and footwear prices fell 1.4 per cent in the quarter, reflecting discounting during the post-Christmas sales.

The price rises for both medical and hospital services and pharmaceutical products reflect the annual cycles for the Medicare Benefits Scheme and Pharmaceutical Benefits Scheme (PBS).

Insurance prices increased 0.8 per cent in the quarter. Over the last 12 months, insurance prices have increased by 6.8 per cent.

Expenditure on education is not included in the retirement budgets but some retirees paying school fees for their grandchildren would be affected by a 4.1 per cent increase in secondary education school fees following the commencement of the new school year.

Experts bust the mortgage deposit ‘myth’

From The New Daily.

When it comes to the housing debate, there’s one number that just won’t go away: 20 per cent.

Many fear that’s how much they’ll have to save for a deposit. It’s easy to understand why – popular measures of affordability, such as those compiled by CoreLogic and CoreData, often assume a 20 per cent lump sum.

Except it’s not.

Back in 2015, the Reserve Bank noted: “the deposit required of a first home buyer is no longer necessarily around 20 per cent of the purchase price, but rather, more often in the 5–10 per cent range.”

Regulators have tightened the screws since then, but there are still mortgages with below 20 per cent deposits to be found, according to Dr Ashton De Silva from RMIT’s Centre for Urban Research.

He said homebuyers taking out bigger loans should consider the benefits of getting into the housing market now, rather than waiting to reach a certain deposit.

“It’s not just a case of working out that you’ve got to pay another $50,000 in interest. What is the economic benefit of securing that place now?” Dr De Silva told The New Daily.

“We expect people are making the decision that: ‘It is better for me to take on that extra cost and secure this dwelling.’”

Two Australians earning the average full-time wage, with average living costs, will likely qualify for a loan just over $1 million with one of Australia’s big banks.

Finder, a financial comparison website, lists a bevy of acronyms that offer low deposit loans, including: NAB, ME, CUA, IMB and HSBC.

Many lenders have created new financial products to help homebuyers enter the market, resulting in Australia having, according to Dr De Silva, “one of the most product diverse markets in the world”.

One option is lenders’ mortgage insurance, which lowers required deposits to a minimum of 5 per cent, meaning purchasers of a $500,000 property can require a lump sum of only $25,000.

Mortgage insurance is usually paid as a one-off charge, with the cost calculated as a percentage of the loan amount and based on the size of your deposit.

Occasionally, it can even be ‘capitalised’ into the value of the loan – which means you borrow more to cover the cost of the insurance. If you do this, you’ll pay slightly higher repayments, rather than a big sum up front.

It’s important to note the insurance only protects the lender against the risk of you defaulting on the mortgage, not you.

You need $200,000 to meet the 20 percent deposit on a $1 million dollar mortgage, an enormous sum for most Australians.

With mortgage insurance, a couple taking out a loan with a 5 per cent deposit would need $50,000, plus the cost of the insurance.

Some lenders won’t charge insurance on loans with a 10 per cent deposit, but this depends on job security and credit history.

Two Australians earning the average full-time wage, with average living costs, will likely qualify for a loan just over $1 million with one of Australia’s big banks.

Dr De Silva warned home buyers should do their homework and weigh up the costs and benefits of different loans.

“One thing that needs to be at the forefront is, ‘Can I afford to ride out any crisis that may arise?’”

Associate Professor Chyi Lin Lee, an expert in property market economics at the University of Western Sydney, pointed to 20 per cent deposits as a main source of difficulty for many homebuyers.

“We need to find an innovative way to help owner-occupiers to get into the market,” he told The New Daily.

Professor Lee said schemes which help homebuyers jump over the deposit hurdle – such as controversial first homebuyer grants – can be successful, despite the upward pressure they put on prices.

A caution: don’t overextend

Professor Lee warned lower deposits shouldn’t be an excuse for buyers to take out bigger loans than they can pay off.

This was backed by Dr Rachel Ong, deputy director at the Bankwest Curtin Economics Centre, who said people taking out loans with low equity can expose themselves to higher repayments.

“It isn’t a good idea to try and lower the minimum deposit because there’s people who might not be able to meet the payments, and the consequences of that are all the negative and quite severe,” Dr Ong said.

“There’s a reason why the minimum deposit is set at what it is.”

First home buyer demand bounces higher

Low rates combined with recent changes to various first home buyer initiatives has helped encourage more potential property buyers into the market, new research has revealed.

Mortgage Choice’s latest Loan Purpose Report found first home buyers accounted for 14% of all loans written by the company in April, up from 12.2% in January.

“In the first quarter of 2017, we saw a rise in the number of first home buyers taking out loans through Mortgage Choice,” Mortgage Choice chief executive officer John Flavell said.

“This growth in first home buyer demand can be attributed to a number of factors, including low interest rates, stagnating property price growth and enhanced first home buyer incentives.

“In the first instance, property prices have started to stagnate across the country, with CoreLogic data showing the median dwelling value in Australia rose just 0.1% over the month of March.

“Furthermore, interest rates remain at historical lows, which has helped keep the cost of borrowing at affordable levels.

“In addition, some states have made changes to their various first home buyer incentives over the first quarter of 2017.

“In Western Australia, the Government announced a temporary $5,000 boost to the First Home Owners Grant. The boost payment is available to eligible first home buyers who enter into a contract between 1 January and 30 June 2017 to purchase or construct a new home, and owner builders who commence laying foundations of their home between those dates.

“As a result of all of these factors, we have seen a slight uptick in the total level of first home buyer demand.”

Looking ahead, Mr Flavell said he wouldn’t be surprised to see first home buyer demand increase further as potential buyers look to take advantage of the low rate environment and various home buyer incentives soon to be on offer.

“In Victoria, some first home buyers will soon be given access to a $20,000 boosted grant. Those purchasing or constructing new homes in regional Victoria will be eligible for the grant.

“In addition, from 1 July 2017, first home buyers purchasing a home with a dutiable value of no more than $600,000 will not have to pay stamp duty – which can be a real financial impost for many first home buyers.

“These two initiatives alone are likely to encourage more first home buyers in Victoria – especially regional Victoria – onto the property ladder.”

But while Mr Flavell said he wouldn’t be surprised to see first home buyer demand climb slightly higher in places like Victoria, he said more still needs to be done by the other states and territories to help this home buyer group.

“While we have seen a slight improvement in first home buyer demand over the first few months of the year, total first home buyer demand remains very low.

“In April 2014, first home buyers made up 17.8% of all loans written through Mortgage Choice. Today, that percentage has slumped to just 14%.

“We believe more needs to be done to help first home buyers get onto the property ladder.

“The Federal Government announced earlier this month that it would allow first home buyers to salary sacrifice part of their income into their superannuation account in order to help them build their property deposit faster.

“While this initiative is great in theory, it is unlikely to have a huge impact. At best, a couple who salary sacrifice a portion of their income into their super might be able to scrape together enough money to pay for the stamp duty charged in markets like Sydney.

“Indeed, there is nothing to suggest that this new scheme will deliver a different result to the spectacularly unsuccessful First Home Saver Account initiative that was launched by the Rudd Government in 2008 and withdrawn from the market in 2014.”

Digital Finance Analytics – Quenching The Thirst For Accurate Household Mortgage Data

Digital Finance Analytics Core Market Model is now being used by a growing number of financial services companies and agencies who want to understand the true dynamics of the current mortgage market and the broader footprint of household finances across Australia.

The DFA Approach

By combining our household survey data, with private data from industry participants as well as public data from government agencies we have created a unique statistically optimised 52,000 household x 140 field resource which portrays the current status of households and their financial footprint. Because new data is added to each week, it is the most current information available. We also estimate the extent of future mortgage defaults, thanks to the data on household mortgage stress.

Posts on the DFA blog uses data from this resource.  Momentum in our business has picked up significantly as concerns about the state of household finances grow and the thirst for knoweldge grows. We plug some of the critical gaps in the currently available public data which is in our view both limited and myopic.

A Soft Sell

The complete data-set is available purchase, either as a one-off transaction, or by way of an annual subscription which includes the full current data plus eleven subsequent monthly updates.

Other clients prefer to request custom queries which we execute on a time and materials basis.

In this video you can see an example of the core model at work. We show how data can be manipulated to get a granular (post code and segment) understanding of the state of play.  This is important when the situation is so variable across the states, and across different household groups.

We Hold Granular Data

  • Household Demographics (including age, education, structure, occupation and income, location, etc.)
  • Household Property Footprint (including residential status, type of property, current value of property, whether holding investment property, purchase intentions, etc.)
  • Household Finances (including outstanding mortgages and other loans, credit cards, transaction turnover, deposits, superannuation and SMSF, and other household spending)
  • Household Risk Assessment (including loan-to-value, debt servicing ratio, loan-to-income ratio, level of mortgage stress, probability of default, etc.)
  • Household Channel Preferences (including preferred channel, time on line, use of financial adviser, use of mortgage broker, etc.)
  • Segmentation (derived from our algorithms; for household, property, digital and others)

Request More Information

You can get more information about our services by completing the form below, where you can also request access to our Lexicon which describes in detail the data available.

You should get confirmation your message was sent immediately and you will receive an email with the information attached after a short delay.

Note this will NOT automatically send you our ongoing research updates, for that register here.

[contact-form to=’mnorth@digitalfinanceanalytics.com’ subject=’Request Details of DFA Core Market Model’][contact-field label=’Name’ type=’name’ required=’1’/][contact-field label=’Email’ type=’email’ required=’1’/][contact-field label=’Email Me The Information’ type=’radio’ options=’Yes Please’ required=’1′ /][contact-field label=’Email Me The Lexicon (option)’ type=’radio’ options=’Yes Please’ required=’0′ /][contact-field label=’Comment If You Like’ type=’textarea’/][/contact-form]


The ‘jobs growth’ myth leading us to breaking point

From The New Daily.

When the ratings agency S&P Global downgraded its outlook for the Australian economy earlier this week, it would have caught many people by surprise.

That hasn’t been the story coming out of Canberra in recent months. Treasurer Scott Morrison put on a sterling display of optimism during budget week, telling us that not only were lots of jobs being created, but the tax revenue flowing from those jobs would help bring the budget back to surplus.

Sadly, S&P has the more accurate picture. As noted on Wednesday, it sees our economy as “very high risk” due to “strong growth in private sector debt and residential property prices in the past four years”.

But the housing bubble is only half the story. Times have changed from the years when a large mortgage would quickly get easier to service as inflation eroded the real value of the debt.

Now, other forces of erosion are at work. Number-crunching last week’s jobs data from the Bureau of Statistics shows that it’s not debts that are eroding, but the number of hours of work available in the economy.

When the Treasurer quotes the jobs data, he tends to focus on the ‘seasonally adjusted’ unemployment rate, which fell from 5.8 to 5.7 per cent in April – the more reliable ‘trend’ figure remains stuck at 5.8 per cent.

But it’s what is happening behind those figures that is worrying.

First, there’s the ongoing trend towards part-time work. In the past year, the 49,300 full-time jobs created were easily eclipsed by 102,800 part-time jobs.

The growth rate for part-time jobs is three times that for full-time jobs, and if that trend continues over the next year, many heavily indebted households will start to reach breaking point.

The debt problem

Australia now has a middle strata of homeowners, between renters and those who’ve paid off their mortgages, who are carrying historically high levels of debt.

Not only are their debts not being significantly eroded by inflation, but the purchase price of homes in most cities continues to climb, loading up new generations of home buyers with even bigger debts.

That’s what S&P is concerned about. Mortgage holders are also struggling with two other trends – below-inflation wages growth, and the fall in hours worked revealed by the ABS last week.

While for an individual, having a part-time job is a lot better than none at all, for many families the problem of having one or even two breadwinners wanting more hours is growing.

This is what you need

Australia’s population is growing at a rapid annual rate of 1.4 per cent.

The workforce doesn’t grow quite that quickly due to the ageing population profile, but it’s not far behind – 1.36 per cent in the past year according to the ABS.

If workers’ hours had remained constant on average, the total hours worked would have risen by 22.5 million in the past year to reflect the expanding workforce.

What we saw last week was a fall of two million hours in the month of April, and growth over the year at half the level it should be – 10.4 million hours.

Those figures say a lot more about how the economy is progressing than simple ‘jobs’ figures, but even the job figures fell behind.

There have been 152,100 jobs created in the past year (to April), but the workforce has grown by 172,400 people in the same period. That is, more people than jobs available.

Household debt, meanwhile, continues its march higher. The average household debt is 190 per cent of disposable income, according to the RBA.

It’s important to remember, too, that most of that debt is concentrated in the one-third of households which have a mortgage.

That’s the slice of middle Australia for whom celebrations over a ‘fall in unemployment’ will make no sense.

RBA figures show that one third of mortgage-holders has less than a one-month buffer in the household finances before they fall into arrears.

That’s a risk for them, but also for the economy.

S&P is only telling us what the economists in the Department of Treasury already know, but the politicians aren’t keen to say.

Personal Insolvencies On The Rise

The Australian Financial Security Authority (AFSA) released regional personal insolvency statistics for the March quarter 2017. Looking across the regions, again we see signs of people in financial difficulty.  This data will feed into our updated mortgage stress modelling to be published in early June.

New South Wales

  • Greater Sydney
    • In the March quarter 2017 compared to the December quarter 2016:
      • the number of debtors rose 11.0%; the main contributor to the increase was Wyong
      • the number of debtors who entered a business related personal insolvency rose 8.6%; the main contributors to the increase were Wyong and Penrith.
  • Rest of NSW
    • In the March quarter 2017 compared to the December quarter 2016:
      • the number of debtors rose 1.9%; the main contributor to the increase was Lachlan Valley
      • the number of debtors who entered a business related personal insolvency fell 10.7%; the main contributor to the fall was Coffs Harbour.

Australian Capital Territory

  • In the March quarter 2017 compared to the December quarter 2016:
    • the number of debtors rose 26.9%; the main contributor to the increase was Belconnen
    • the number of debtors who entered a business related personal insolvency rose 84.6% (from 13 debtors to 24).

Victoria

  • Greater Melbourne
    • In the March quarter 2017 compared to the December quarter 2016:
      • the number of debtors rose 13.4%; the main contributor to the increase was Whittlesea – Wallan
      • the number of debtors who entered a business related personal insolvency rose by 5.7%; the main contributor to the increase was Mornington Peninsula.
  • Rest of Vic
    • In the March quarter 2017 compared to the December quarter 2016:
      • the number of debtors rose 10.8%; the main contributor to the increase was Glenelg – Southern Grampians
      • the number of debtors who entered a business related personal insolvency rose 8.3%; the main contributor to the increase was Bendigo.

Queensland

  • Greater Brisbane
    • In the March quarter 2017 compared to the December quarter 2016:
      • the number of debtors rose 19.3%; the main contributor to the increase was Ipswich Inner
      • the number of debtors who entered a business related personal insolvency rose 13.9%; the main contributor to the increase was Springfield – Redbank.
  • Rest of Qld
    • In the March quarter 2017 compared to the December quarter 2016:
      • the number of debtors rose 9.4%; the main contributor to the increase was Caloundra
      • the number of debtors who entered a business related personal insolvency fell 2.1%; the main contributor to the fall was Rockhampton.

South Australia

  • Greater Adelaide
    • In the March quarter 2017 compared to the December quarter 2016:
      • the number of debtors rose 12.6%; the main contributor to the increase was Marion
      • the number of debtors who entered a business related personal insolvency rose 9.8%.
  • Rest of SA
    • In the March quarter 2017 compared to the December quarter 2016:
      • the number of debtors rose 51.0%; the main contributor to the increase was Murray and Mallee
      • there were 25 debtors who entered a business related personal insolvency in the March quarter 2017, a rise from 12 in the December quarter 2016.

Northern Territory

  • The number of debtors rose 18.8% in Greater Darwin in the March quarter 2017 compared to the December quarter 2016
  • There were 18 debtors in rest of NT in the March quarter 2017, a fall from 20 in the December quarter 2016
  • There were 13 debtors who entered a business related personal insolvency in Northern Territory, a fall from 16 in the December quarter 2016.

Western Australia

  • Greater Perth
    • In the March quarter 2017 compared to the December quarter 2016:
      • the number of debtors rose 11.6%; the main contributor to the increase was Cockburn
      • the number of debtors who entered a business related personal insolvency was unchanged at 155 debtors.
  • Rest of WA
    • In the March quarter 2017 compared to the December quarter 2016:
      • the number of debtors rose 5.3%; the main contributor to the increase was Albany
      • the number of debtors who entered a business related personal insolvency rose 9.1%; the main contributor to the increase was Bunbury.

Tasmania

  • In the March quarter 2017 compared to the December quarter 2016:
    • the number of debtors who entered a personal insolvency in Greater Hobart fell 7.2%; the main contributor to the fall was Brighton
    • the number of debtors rose 35.5% in rest of Tas; the main contributor to the rise was Launceston

the number of debtors who entered a business related personal insolvency in Tasmania was unchanged at 28 debtors.