Social impact investment can help retirees get the housing and care they need

From The Conversation.

A recent report raised concerns about the erosion of retirement income by ongoing rental or mortgage payments.

The report by the Australian Institute of Superannuation Trustees is timely, given the Australian aged pension system is predicated on an assumption of outright home-ownership. Yet increasing numbers of people are still paying mortgages after retirement, use superannuation to pay off mortgage debt, or do not own a home and must rent.

Any significant decline in home ownership or equity in a home also has impacts on higher care needs. This is because older people will not have an asset to sell to fund the bonds required to enter aged care accommodation.

Author provided

These developments – and the increasing housing insecurity for older people – potentially undermine the sustainability of Australia’s retirement system and, in turn, public finances.

Addressing the problem

Social impact investment strategies could fund more affordable housing and aged care for seniors.

Social impact investments are:

… investments made into organisations, projects or funds with the intention of generating measurable social and environmental outcomes, alongside a financial return.

Impact investment in Australia may take a variety of different forms. It can be organised through direct equity investment, acquisition of units in a mutual fund, debt, venture capital, social impact bonds or other fixed income mechanisms, which might combine blended social impact and financial return.

The sources of investment are equally diverse. These may include philanthropists, funds, businesses, government, private investors, or a combination of two or more.

In Australia, social impact investing is a relatively recent phenomenon although it is developing rapidly in a variety of areas. Impact investing in Australia will be worth $A33 billion by 2022 and extends to a diverse range of investments.

In relation to housing support, examples include the Aspire Social Impact Bond, which targets people experiencing long-term homelessness, and Homeground, a not-for-profit real estate service.

In relation to housing developments, projects such as the innovative CapitalAsset partnerships instigated by ShelterSA. The project aims to collaborate with developers, landowners and investors to build affordable housing developments through a property unit trust.

Housing is likely to be a focus area of social impact investment partnerships between Social Ventures Australia and organisations such as HESTA and Macquarie.

Financing is the key to increasing stocks of affordable housing. It seems the federal government is likely to institute a bond aggregator model involving institutional investors and affordable housing providers.

Retirement housing issues have not been a focus for social impact investing in Australia or elsewhere. However, it is suggested this form of investing could tackle the problems outlined in the Australian Institute of Superannuation Trustees report in three ways.

(Almost) home owners

For those who must maintain a mortgage into retirement, or who want to avoid using most of their superannuation funds to pay off the mortgage, thought could be given to offering lower-cost loans or products akin to reverse mortgages at lower than commercial rates.

Alternatively, under a shared equity arrangement – where reduced payments are made until the sale of the property or the death of the owner/s – the property could be sold and the sale price shared by the older person to put towards care or the estate and the lender.

Social impact investment lenders could finance this in the same way as banks do but at reduced rates. There would still be a healthy return, and older people could live better in retirement with reduced payments but secure in the knowledge they do not have to leave or lose their home.

Regarding the older people who rent, again social impact investing could focus on ensuring that any housing projects developed have a certain percentage of the accommodation available for older people.

Models proposed for social impact investing in affordable housing could be applied to ensure this accommodation is suitable for older people.

Wrap-around services

In both cases, the financing models could be supported by social impact investing provided for support services.

For example, wrap-around services, such as those provided in the Newquay project in Britain, aim to keep older people in their homes and out of hospitals and aged care.

If housing costs are a problem for people in retirement, that’s also going to hamper their ability to pay for care. shutterstock

Ripe for repair

Social impact investing could mobilise private capital to work with not-for-profits to attract investment funds. Grace Mutual has mooted such a project in Australia.

Furthermore, social impact investments could work in areas, such as rural and regional Australia, that are traditionally left to government because of low population and problems with profitability and economies of scale.

Sabina Lim recently suggested the services gap in health and aged care is ripe for social impact investing in Australia.

It’s time to bridge the gaps

Governments alone cannot bridge the gaps and support affordable housing for seniors.

Although government will certainly continue to play a significant role, impact investment should be encouraged as a way to resolve financing and development issues in meeting seniors’ needs for accommodation and care.

Such involvement can be fostered through partnerships between government, NGOs and private investors, together with taxation and other financial incentives. Legal, policy and planning impediments to financing and investment in seniors housing also need to be removed.

Importantly, we need other players in the market who are prepared to invest in affordable housing and aged care for Australians in retirement.

Authors: Eileen Webb, Associate Professor, Curtin Law School, Curtin University; Gill North, Professorial Research Fellow, Deakin University; Richard Heaney, Professor of Finance, University of Western Australia.

Taxable Income Mapping Greater Adelaide 2015

We continue our series on the latest ATO data with a look at Greater Adelaide, using the recently released 2015 taxable income data from the ATO, as a drill down on the all Australia data we previously posted. Blue shows the higher taxable income areas.

Here are the top and bottom 10 across SA.

Australia’s housing market and the great intergenerational tax rort

Interesting perspective from The Guardian. However, it seems to miss the root cause of the housing affordable issue, namely the financialistion of property, now seen as a financial asset, rather than somewhere to live.  This has created demand from investors, lifted the volume of loans which can be written, and created a leveraged edifice which may topple should prices fall. This phenomenon explains the behaviour of many western housing markets, which have been stoked by ultra low interest rates and QE. But the Guardian piece is still worth reading…

Owning your own home was once the great Australian dream but it has turned into a nightmare for young aspiring homeowners.

Based on the evidence, government housing policy appears to be as follows: keep prices high at all costs, enslaving new buyers with obscene levels of debt for the benefit of banks and existing landowners. In a nutshell, this is called intergenerational taxation.

This is a social form of taxation in which there is a significant transfer of wealth from one generation of society to another. In Australia’s economic model, as house prices continue to soar, young homebuyers are forced to take on huge debts to acquire a home that turns to capital for the older seller of the home.

Our banks and mortgage companies are writing the largest home loans in the world both relative to what a young homebuyer earns and in sum value. Putting all financial stability risks and issues aside, the more a bank lends to a new homebuyer the greater the profit a seller and lender will make. When irrational exuberance is rife, lenders increase the sum of debt they issue to young homebuyers and property investors alike. This essentially increases the rate of intergenerational taxation. And the greater the young are effectively taxed in this way, the richer older generations become.

However, when house prices fall hard, like they have already in some parts of Australia, the intergenerational taxation rate falls hard too – even to the point where the flow reverses and younger people can benefit.

Take the Western Australian mining town of Karratha where a median-priced house back in 2011 would have cost about $850,000, or roughly seven times the median income of a household. Today the same house costs less than $300,000, which is roughly two-and-a-half times the median household income.

So, back in 2011, the ballpark intergenerational tax rate from the young to the old in Karratha was a one-off payment roughly the equivalent of 400%-450% of the younger person’s annual income. Today, however, Karratha homeowners are now likely paying a one-off intergenerational tax rate of 15%-25% to younger Australians.

Karratha saw a remarkable transfer of wealth from young to old but now the reverse means an older cohort of Australians are left with a liability they may never repay in full. It serves as a warning for people who have bought into the Sydney and Melbourne housing markets in recent years and who are vulnerable to a fall in prices.

To head off some of these problems, the government now wants to allow younger Australians to tap their super for deposits on homes, thereby increasing their tax transfer to the older generation.

Behind the scenes is our banking system and our financial regulators. The Reserve Bank has been the primary facilitator of the intergenerational transfer by bringing interest rates down to a record low and promising a safety net for banks.

So the question a young homebuyer must ask themselves is why have the government, mortgage lenders, landowners and the RBA built a wealth transfer system that leaves the aspiring young homebuyer as the most leveraged in the world?

The answer to this question is very simple. The reality is a very small number of powerful lobby groups in Canberra have a hundred times more influence on shaping housing policy than young people. In other words, the voice of our youth is unfortunately all but irrelevant and ignored.

Taxable Income Mapping Greater Perth 2015

We continue our series on the latest ATO data with a look at Greater Perth, using the recently released 2015 taxable income data from the ATO, as a drill down on the all Australia data we previously posted. Blue shows the higher taxable income areas.

Here are the top and bottom 10 across WA.

Taxable Income Mapping Greater Melbourne 2015

We continue our series on the latest ATO data with a look at Greater Melbourne, using the recently released 2015 taxable income data from the ATO, as a drill down on the all Australia data we previously posted. Blue shows the higher taxable income areas.

Here are the top and bottom 10 across VIC.

Taxable Income Mapping Greater Brisbane 2015

We continue our series on the latest ATO data with a look at Greater Brisbane, using the recently released 2015 taxable income data from the ATO, as a drill down on the all Australia data we previously posted. Blue shows the higher taxable income areas.

Here are the top and bottom 10 across QLD.

Next time we will look at Greater Melbourne.

ATO data shows inequality is in everything from super to the property market

From The Conversation.

The Australian Taxation Office (ATO) has released data for 2014-15 that paints a picture of how much Australians earn and what they claim in tax concessions. We asked our tax experts to tell us what the data says to them.


John Daley and Danielle Wood, The Grattan Institute

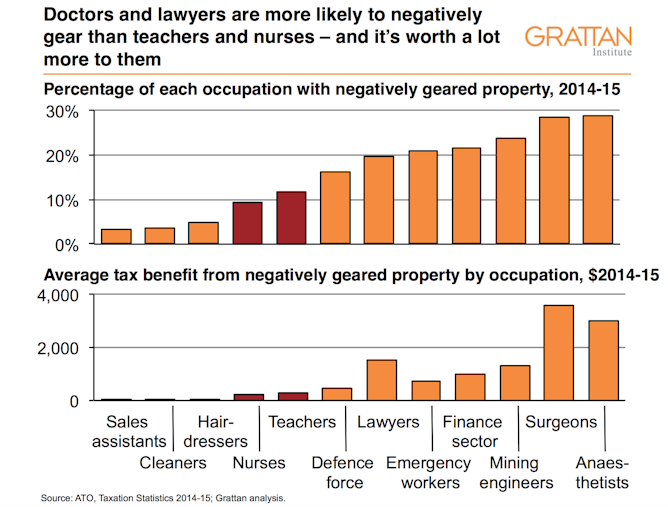
The latest data from the ATO is consistent with what we’ve seen in the past. It shows that people with high-income occupations – doctors, lawyers, and others – are more likely to use negative gearing than the nurses and teachers on whom Treasurer Scott Morrison focuses when he tries to justify retaining negative gearing. It also shows that negative gearing is typically worth four to five times more for doctors and lawyers than nurses and teachers.

Author provided

The tax data shows that with falling interest rates, fewer landlords are negatively geared, and the average loss is also falling. Overall the investor property market seems to be concentrating a little, with slightly fewer landlords but more investment properties per landlord.

Author provided

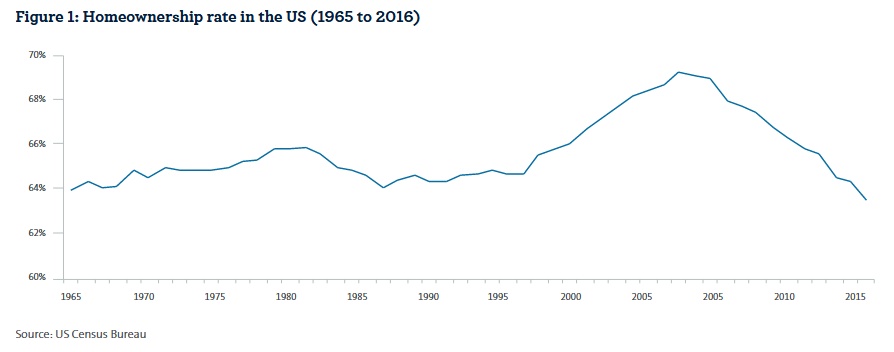
Negative gearing has lots of problems. It costs the budget a lot of money, distorts investment decisions, increases house prices, and reduces home ownership, while doing little to increase supply.

The government claims it should nevertheless be retained because it’s primarily an investment strategy for “mums and dads”. But the detailed tax data from previous years shows that about two-thirds of the benefit goes to the one-fifth of taxpayers with the highest income before the negative gearing deduction.

We will have to wait until later this month for the release of more detailed data to check that this is still true.

Professor Fabrizio Carmignai, Griffith Business School

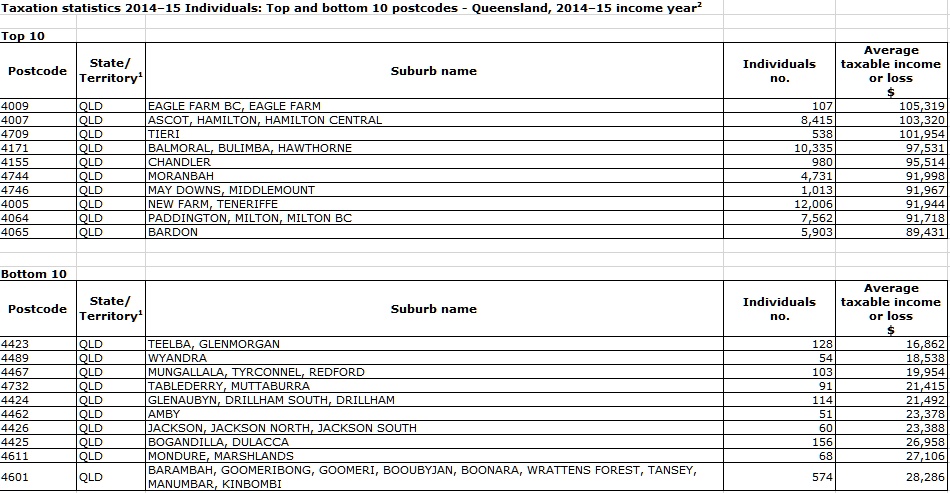
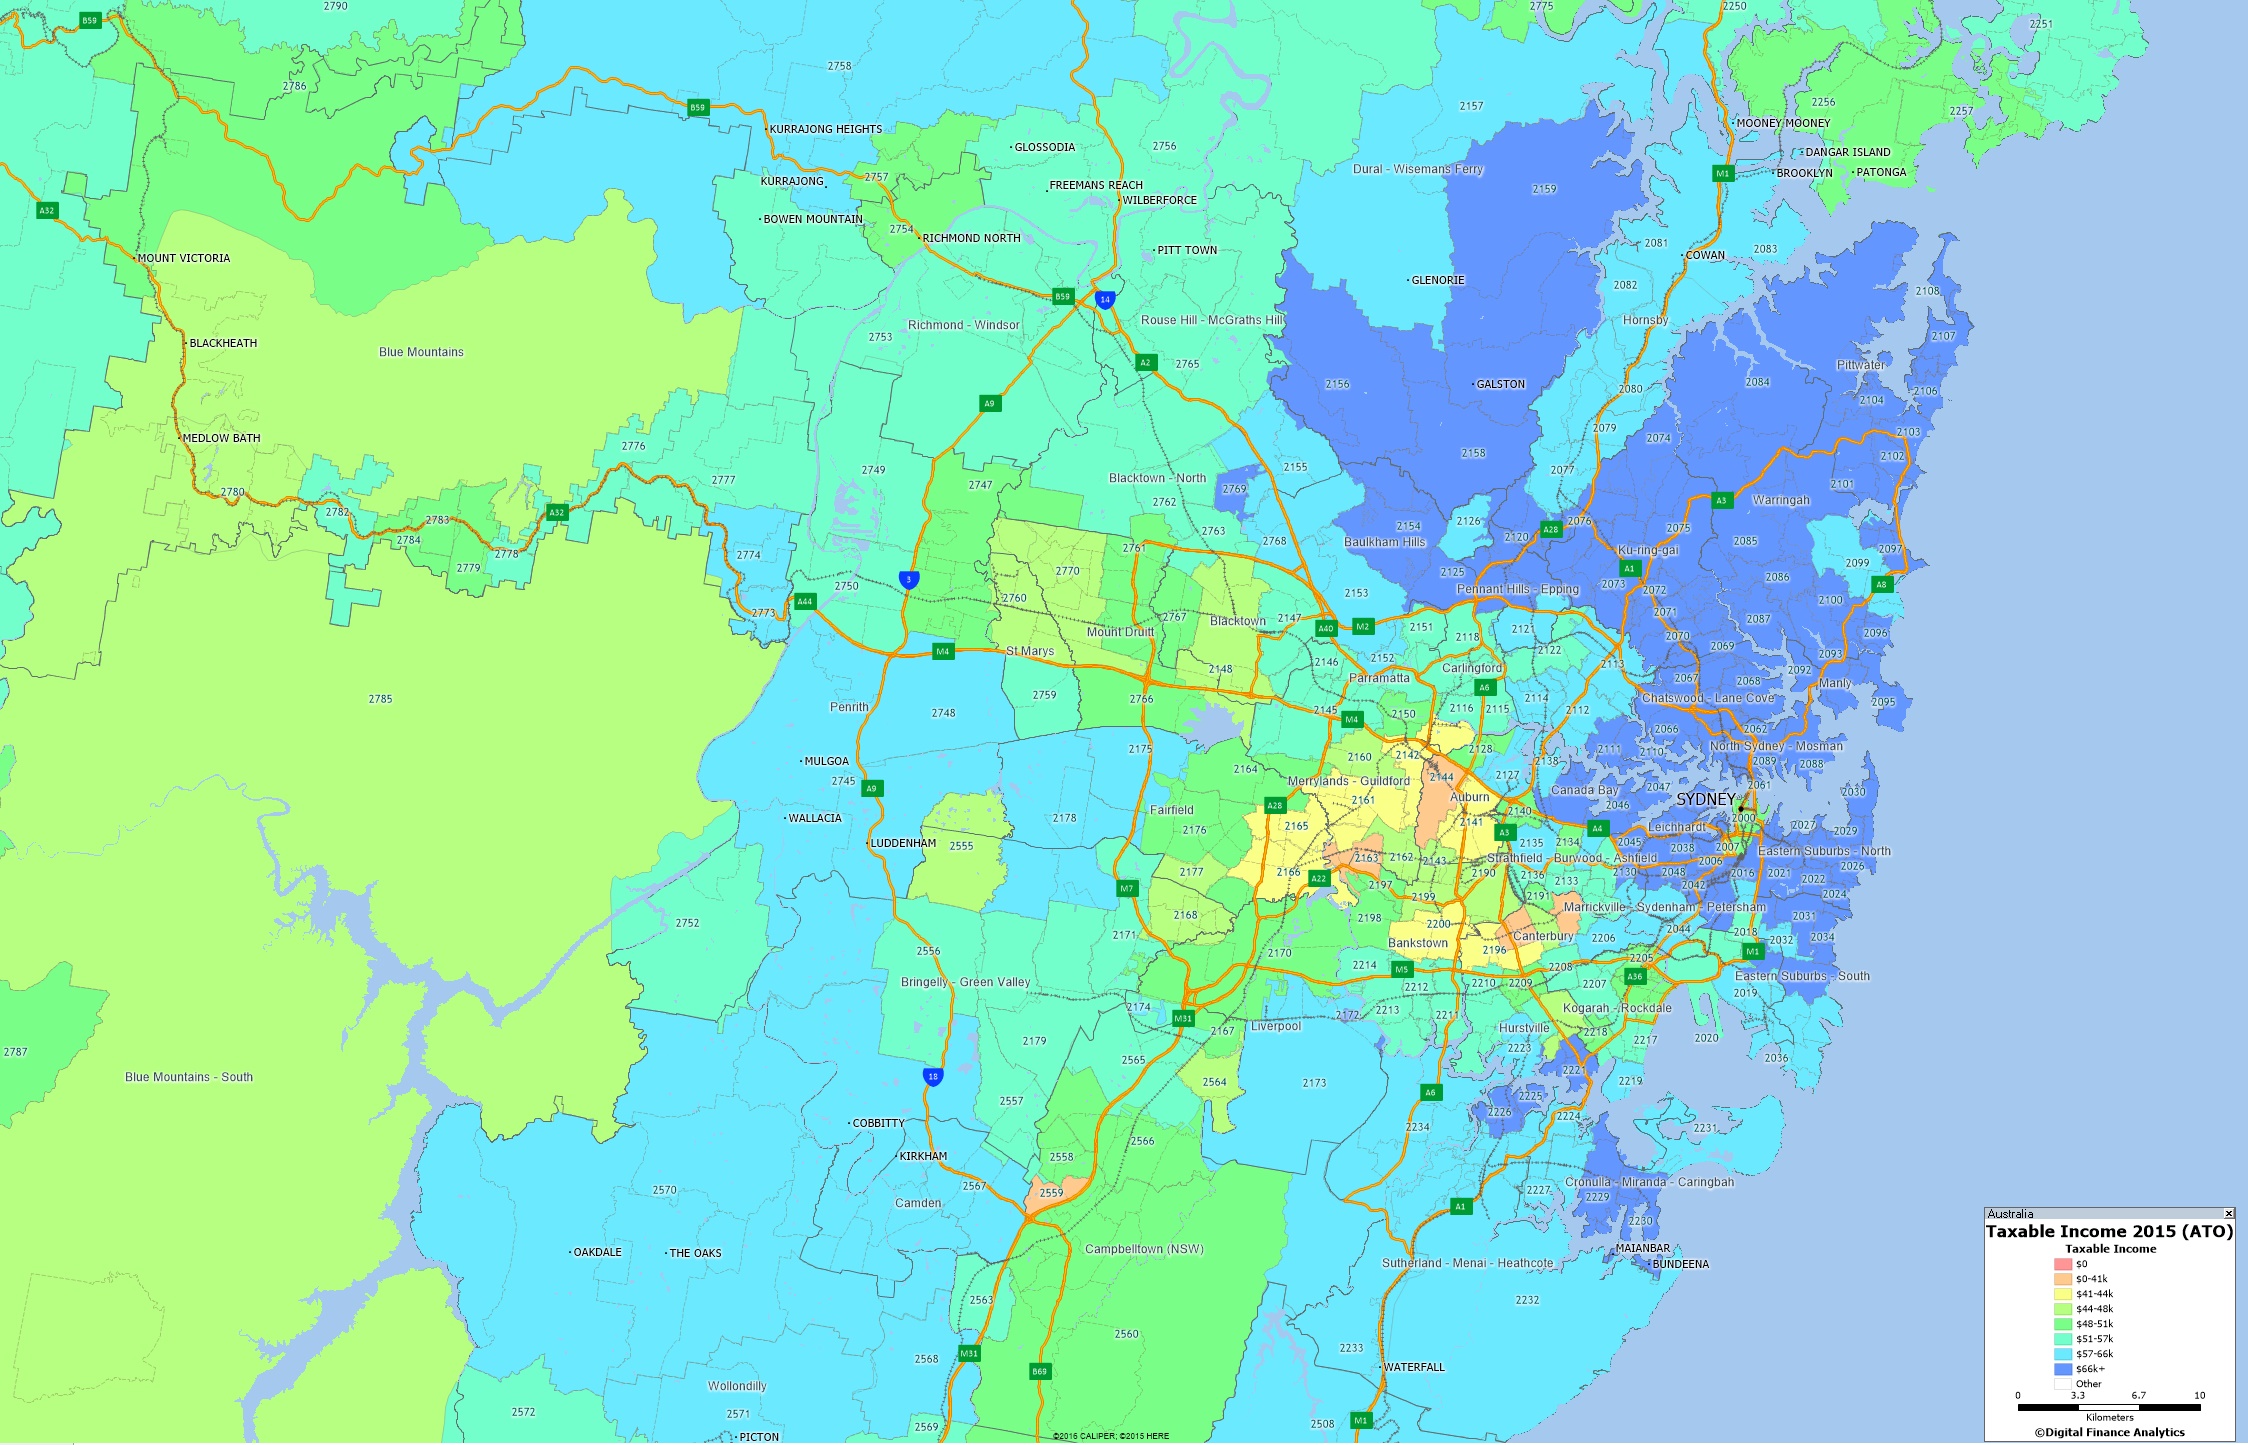
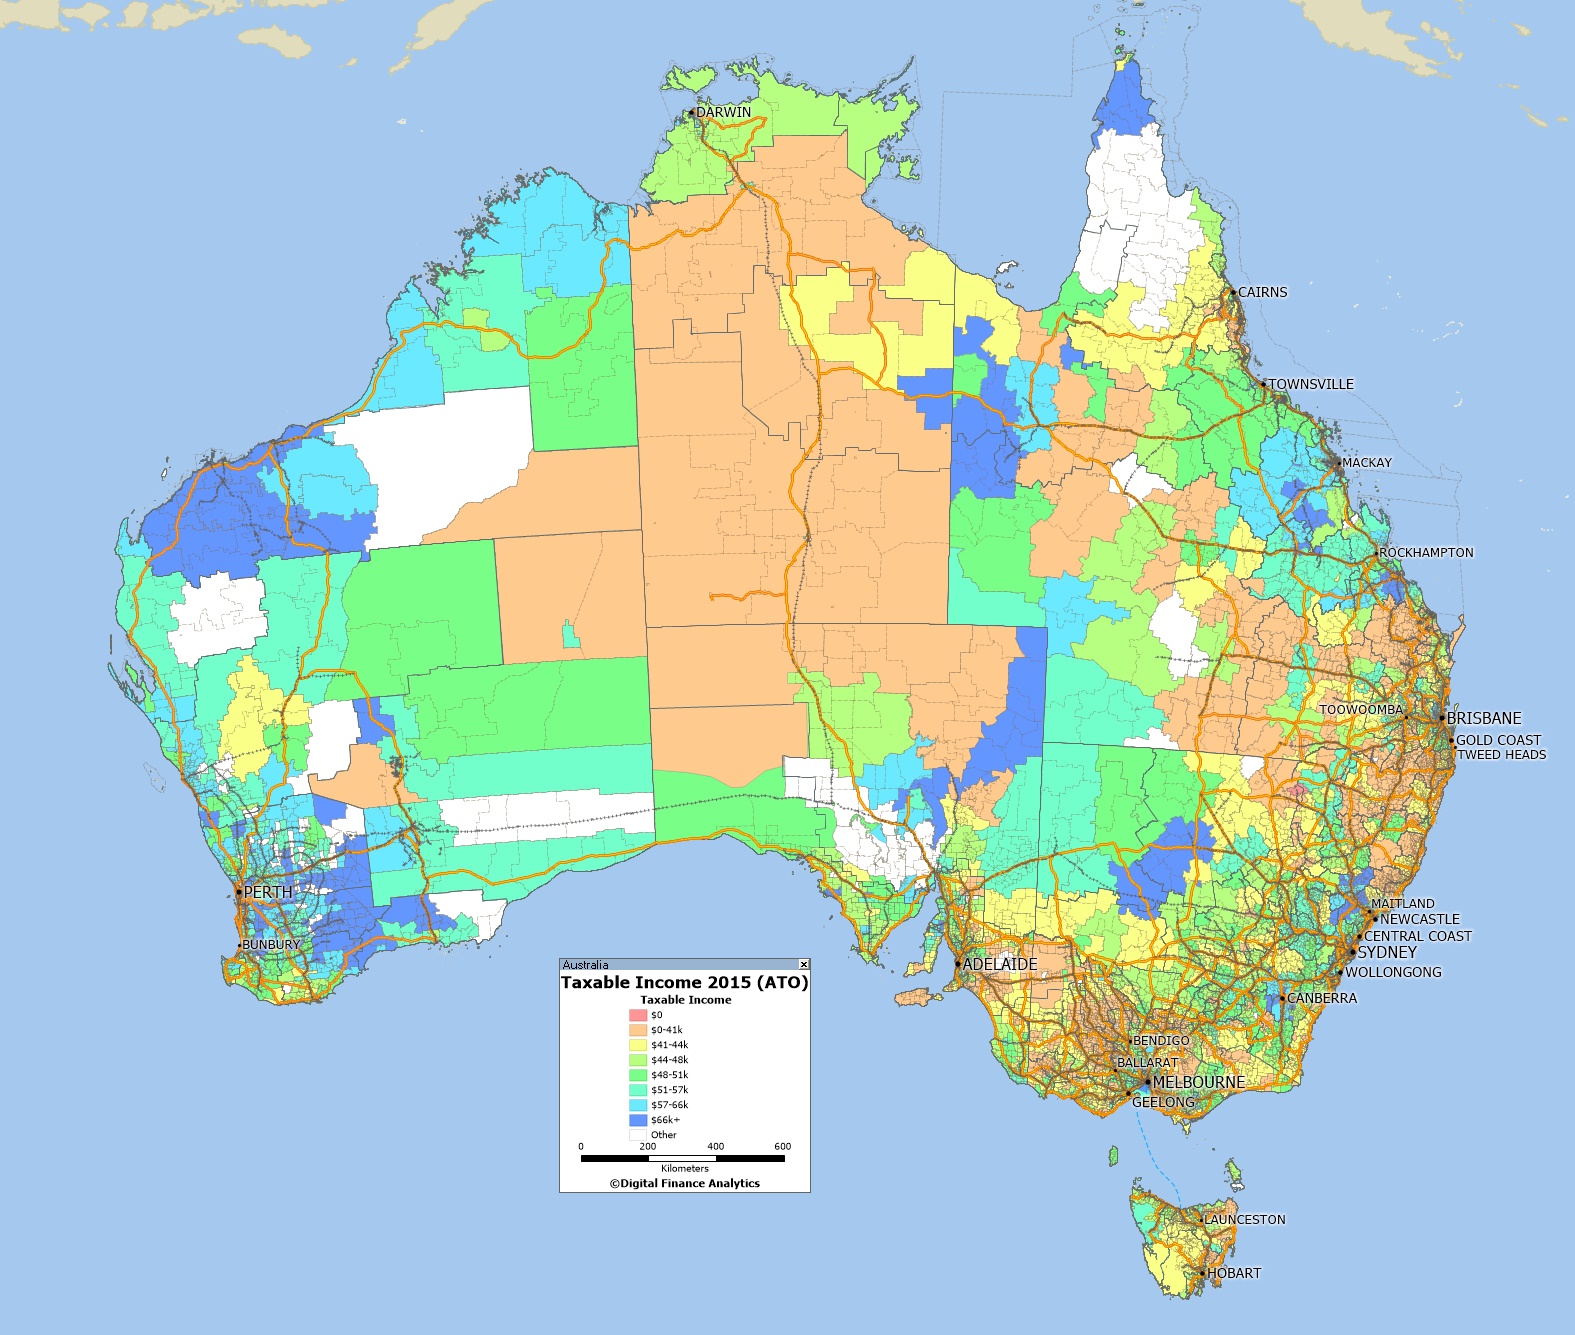
This data delivers a simple, probably not unexpected, but still concerning message: inequality in Australia is increasing.

We can see this in terms of the growing gap between the richest and the poorest suburbs, as well as an increase in dispersion across all suburbs.

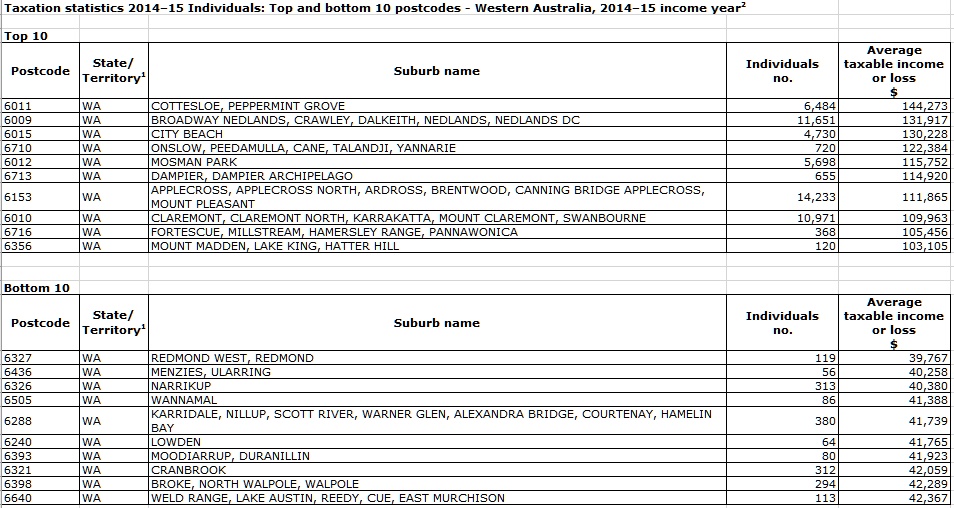
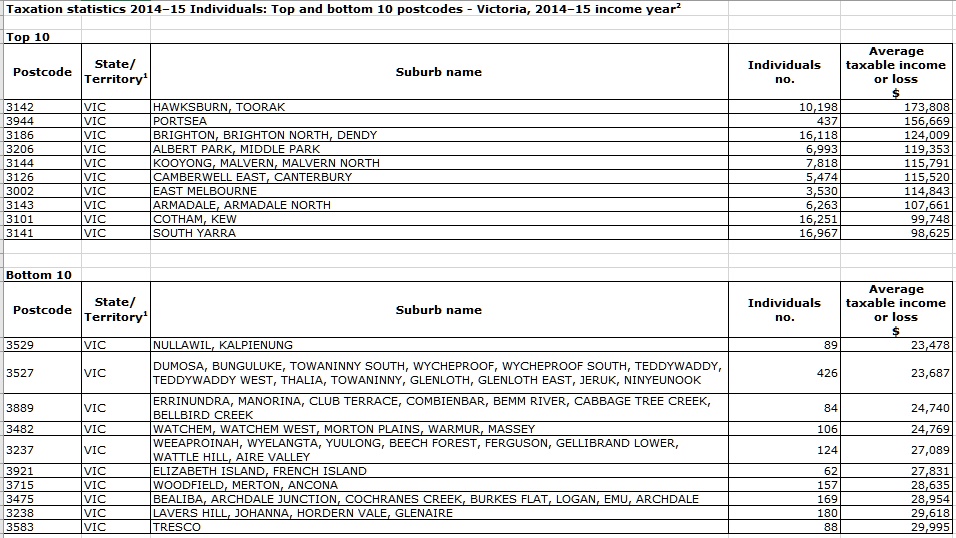
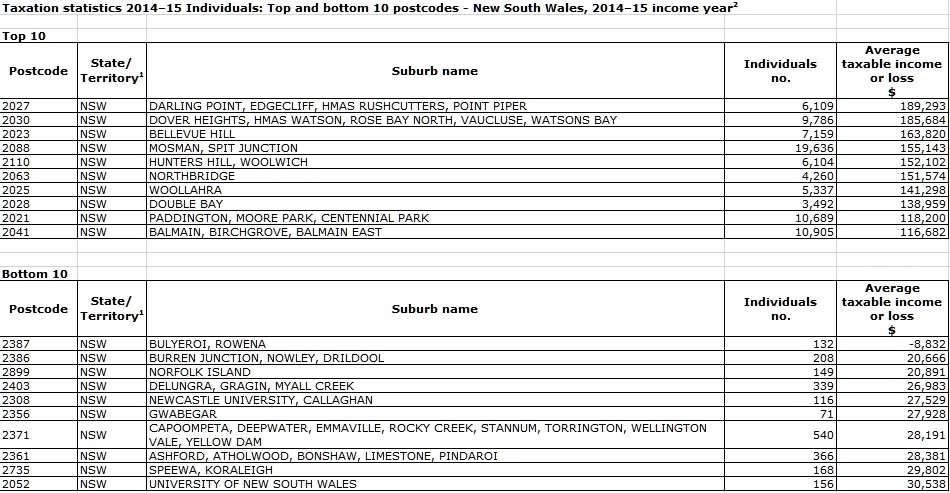
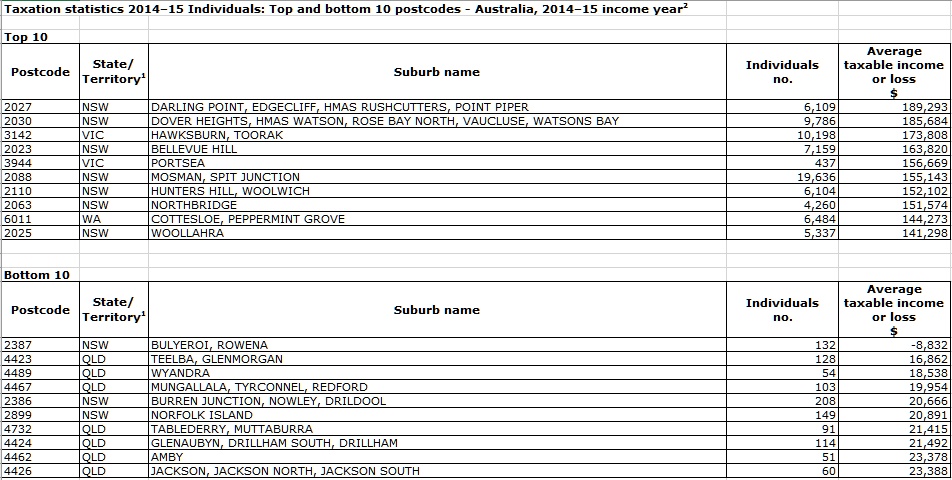
For example, the data published yesterday indicates that average taxable income in the ten poorest postcodes was only 11% of the average taxable income in the ten richest postcodes. A decade ago, in 2004-05, income in the ten poorest postcodes was 21% of income in the richest postcodes.

In fact, while the average income at the top of the distribution has grown by 30% in a decade, average income at the bottom has actually declined by 33%. If we look at the overall dispersion of incomes by postcode, we can see that this has gone up by approximately 25% in ten years.

Whichever way we look at it, the conclusion is that there is more income inequality today than ten years ago.

The other interesting aspect to the data is that the richest postcodes today are more or less the same as ten years ago. Indeed, seven of the top ten postcodes in 2014-15 were already in the top ten in 2004-05. But this same trend is not observed at the bottom: none of the ten poorest postcodes today were in bottom ten in 2004-05.

And there is some bad news for Queensland in particular: the proportion of the state’s postcodes in the bottom ten has increased considerably, from three out of ten in 2004-05 to seven out of ten in the latest data. This data might be indicative of a growing poverty problem in this state.

Associate Professor Helen Hodgson, Curtin Law School

The ATO’s data clearly shows that the self-managed superannuation fund (SMSF) sector is not only continuing to grow, but is used primarily by people with the ability to make higher contributions; either high income earners or those late in their careers.

Members of self-managed superannuation funds made significantly higher contributions and have higher balances than members of Australian Prudential Regulatory Authority (APRA) regulated funds.

The data shows that on an individual basis, the median contribution to a SMSF was A$20,000. Meanwhile, members of APRA funds made median contributions of A$4,507.

Similarly, the super balances of members of SMSFs are significantly higher than APRA funds. SMSF members have median balances of A$289,483, compared to just A$32,734 for those in APRA regulated funds. The data also shows that a small proportion of people have very high balances, which is reflected in the difference between the median and mean balances in the statistics.

Two of the forthcoming changes to superannuation will limit contributions and impose a cap on balances, which should impact higher earners. Most people who made contributions in excess of A$25,000 are over 45 and earned more than A$180,000.

But the changes to the superannuation system will not take effect until July 2017, so it is too soon to know how that will impact superannuation funds. However the division between the self-managed and APRA regulated funds is clear.

Authors:Jenni Henderson, Editor, Business and Economy, The Conversation; Josh Nicholas, Deputy Editor Business & Economy, The Conversation; Interviewed: Danielle Wood, Fellow, Australian Perspectives, Grattan Institute; Fabrizio Carmignani, Professor, Griffith Business School, Griffith University; Helen Hodgson, Associate Professor, Curtin Law School and Curtin Business School, Curtin University; John Daley, Chief Executive Officer, Grattan Institute.
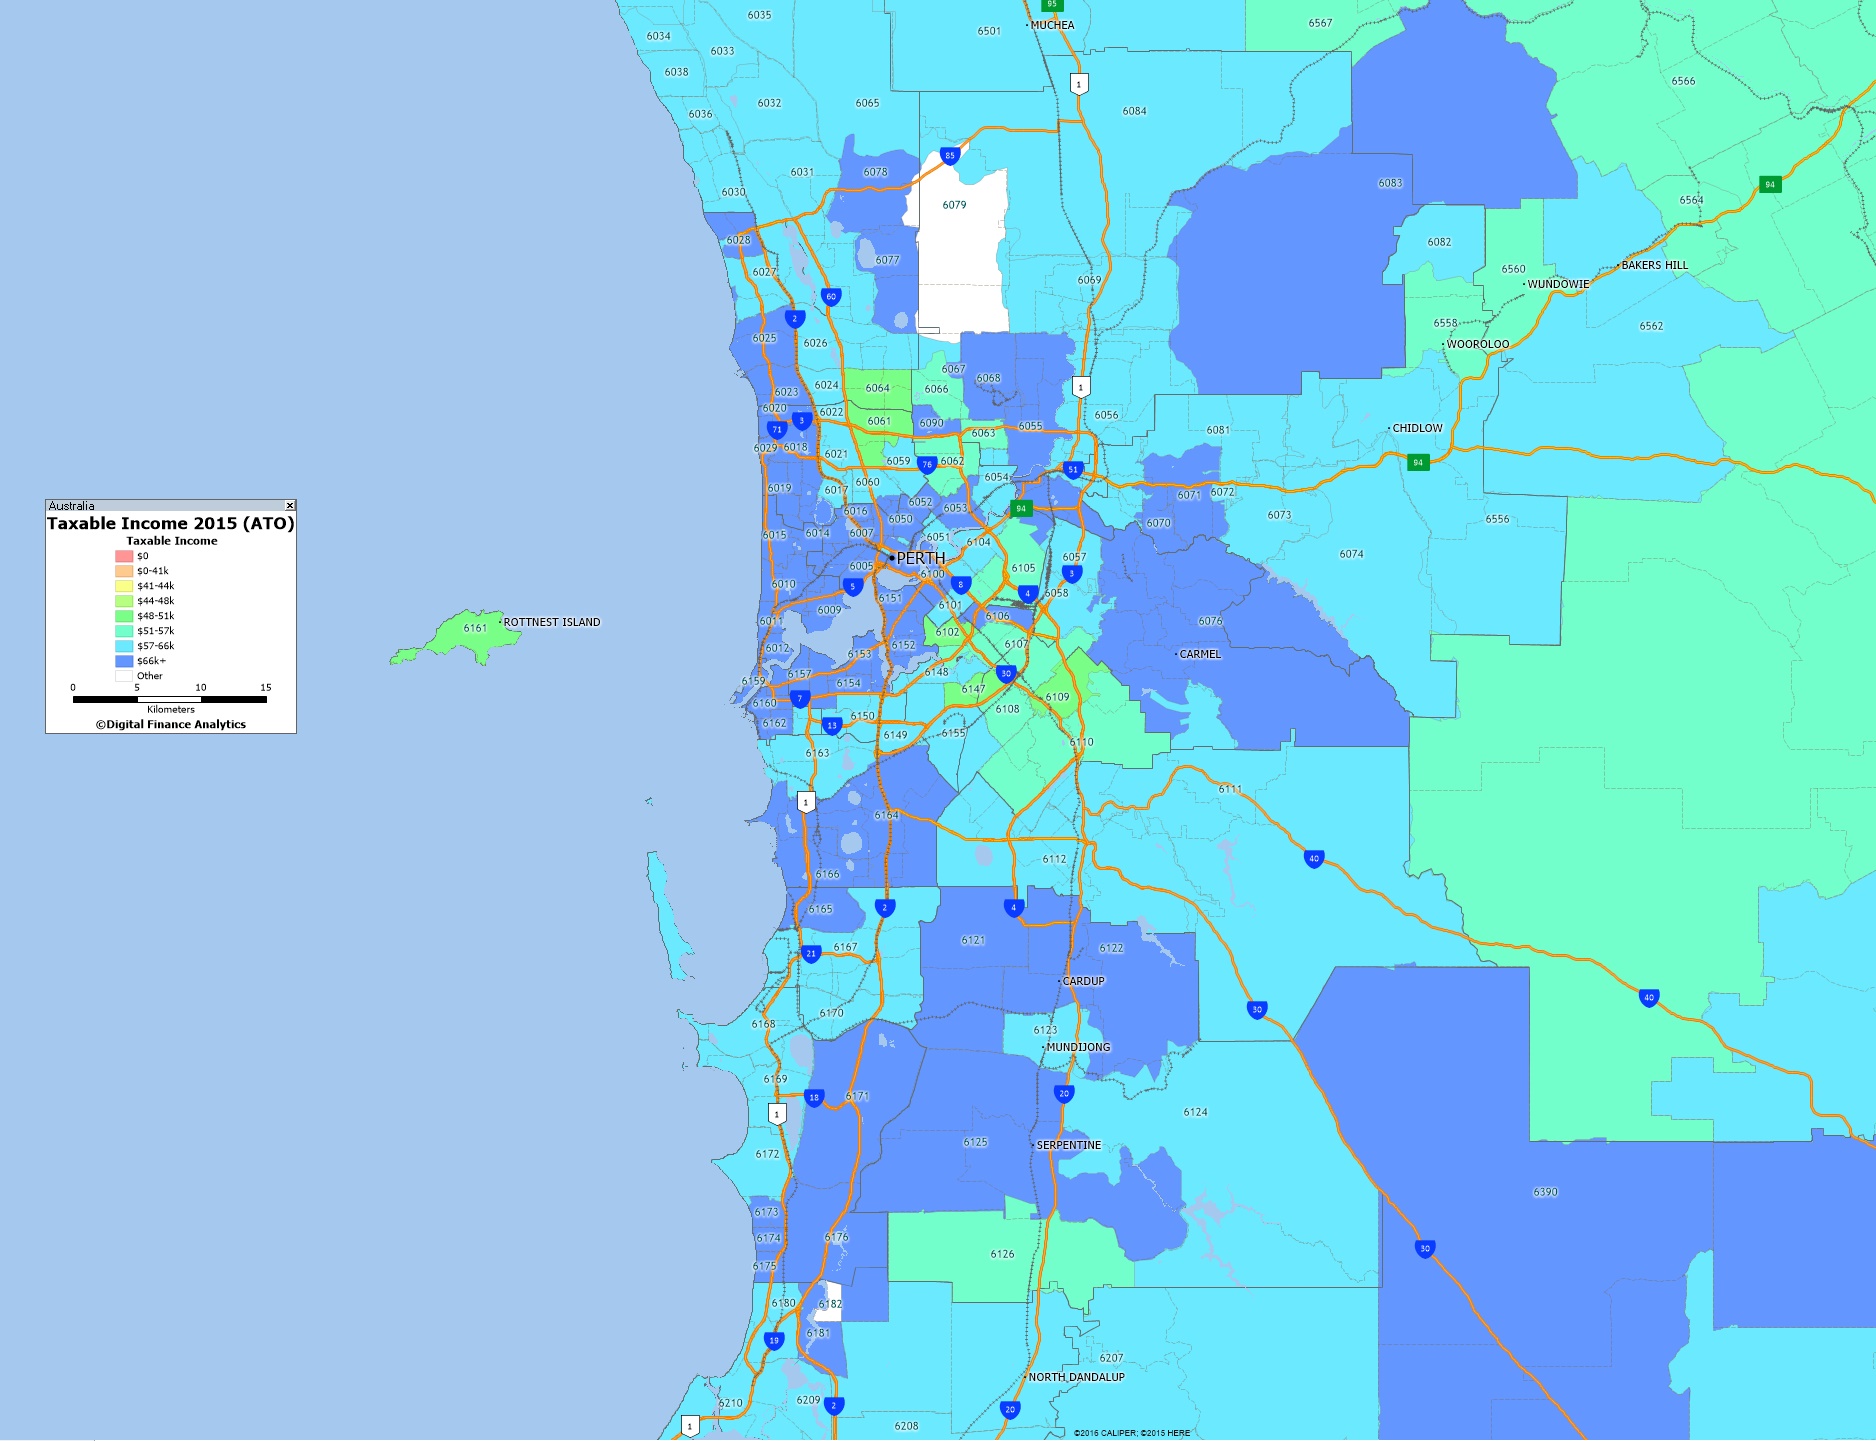
Taxable Income Mapping Greater Sydney 2015

Here is the geomap for Greater Sydney, using the recently released 2015 taxable income data from the ATO, as a drill down on the all Australia data we previously posted. Blue shows the higher taxable income areas.

Here is the top 10 and bottom 10 from the listings.

Next time we will look at Greater Brisbane.

Taxable Income Mapping Australia 2015

Using data from the latest ATO release from 2015, we can map average taxable incomes to post codes. Of course taxable incomes are the residual amounts the tax authorities get their hands on after tax management strategies (such as allowances, expenses, trusts, negative gearing, income sharing and the like) so they do not tell the full story. Nevertheless the results are interesting.

The blue areas show the zones of highest taxable income. Here are the top and bottom postcodes from the list, Australian wide.

In coming days we will drill into the various states, again with interesting results.

ATO reveals Australia’s richest and poorest postcodes

From The New Daily.

Sydney’s eastern suburbs have retained their title as the home of Australia’s richest residents.

That’s the word from the Australian Taxation Office, which names postcode 2027 as the single largest concentration of blue-chip earners in the nation, with an average individual income of $189,293, based on newly released tax return statistics from 2014-15.

That shouldn’t come as a surprise. The plush pocket of harbourside high-earners includes Point Piper, where Prime Minister Malcolm Turnbull makes his home in a waterfront mansion estimated by Domain.com.au to be worth as much as $50 million.

That makes him wealthy even by the solid-gold standards of neighbouring Darling Point, Edgecliff and Rushcutters Bay, all in the same 2027 postcode.

NSW accounted for seven of the top 10 rated postcodes, while Victoria occupies two rungs at the top of the wealth ladder, according to the data released on Wednesday for the 2014-15 year.

That’s the upside. The other side of the coin is that the state also has the poorest postcodes, with the 132 residents of Bulyeroi, in the north-central part of the state, scraping by on an average taxable loss – yes, loss – of $8832.

That makes Bulyeroi the most down-at-heel town in the entire country.

Overall pauper honours, however, go to Queensland, where seven of the poorest postcodes are to be found. The other three entries at the bottom of the income ladder are all in NSW.

The Melbourne suburb of Toorak is the third-richest, with the Victorian seaside town of Portsea, grandly positioned at the entrance to Port Phillip Bay, ranking fifth in the wealth stakes.

The only other state to figure in the top 10 was Western Australia, where Cottesloe/Peppermint Grove secured the ninth spot, just ahead of Sydney’s Woollahra on $144,273.

The most common professions reported among the top 10 postcodes included medical specialists and practitioners, financial dealers, psychiatrists, judicial and other legal professionals, mining engineers, chief managing directors, and engineering managers.

Surgeons were the highest earners, with an average taxable income of $377,044, followed by anaesthetists at $341,041.

Australia’s wealthiest postcodes, by suburb

  1. 2027 (NSW): Darling Point, Edgecliff, Hmas Rushcutters, Point Piper
  2. 2030 (NSW): Dover Heights, Hmas Watson, Rose Bay North, Vaucluse, Watsons Bay
  3. 3142 (VIC): Hawksburn, Toorak
  4. 2023 (NSW): Bellevue Hill
  5. 3944 (VIC): Portsea
  6. 2088 (NSW): Mosman, Spit Junction
  7. 2110 (NSW): Hunters Hill, Woolwich
  8. 2063 (NSW): Northbridge
  9. 6011 (WA): Cottesloe, Peppermint Grove
  10. 2025 (NSW): Woollahra

Australia’s poorest postcodes, by suburb

  1. 2387 (NSW): Bulyeroi, Rowena
  2. 4423 (QLD): Teelba, Glenmorgan
  3. 4489 (QLD): Wyandra
  4. 4467 (QLD): Mungallala, Tyrconnel, Redford
  5. 2386 (NSW): Burren Junction, Nowley, Drildool
  6. 2899 (NSW): Norfolk Island
  7. 4732 (QLD): Tablederry, Muttaburra
  8. 4424 (QLD): Glenaubyn, Drillham South, Drillham
  9. 4462 (QLD): Amby
  10. 4426 (QLD): Jackson, Jackson North, Jackson South

DFA notes this a TAXABLE INCOME, so after offsets and other tax saving measures. It tells you little about the status of gross household income.