The 2016 Property Market In Review

Today we start a short series which will review the property market in 2016, and then look forward to 2017. We will start by looking at demand for property, then look at property and funding supply, before examining the risk elements in the market for both property owners, lenders and the broader economy.

Remember that there is more than six trillion dollars invested in residential property in Australia, three times as much as in the whole superannuation system, and close to a third of households rely on income from property, either directly or indirectly, (from rents, or jobs in the sector across construction, maintenance and management), to say nothing of the capital two thirds of Australians are sitting on thanks to strong recent price rises. So what happens to property really matters.

Property Demand

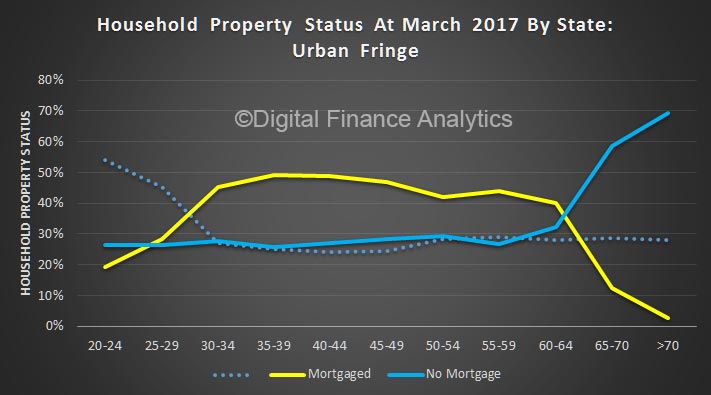
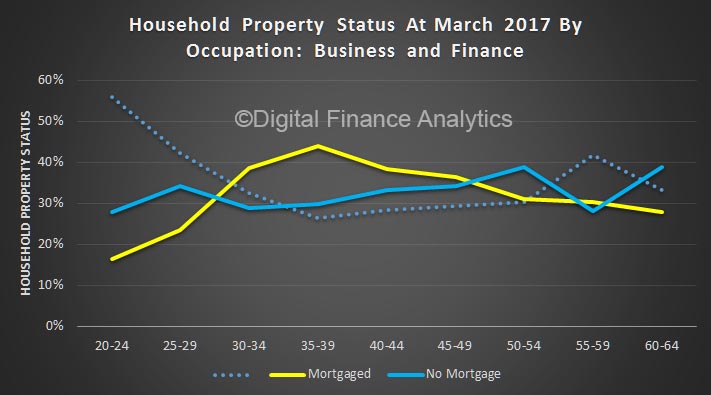
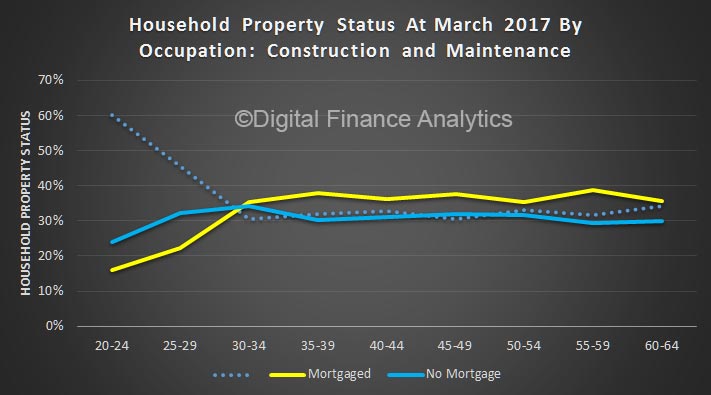
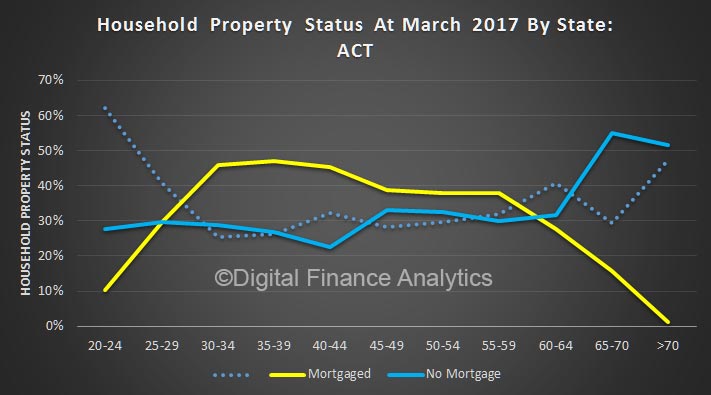
We start with demand for property. The latest data from our household surveys shows that demand for property is very strong. Two thirds of households have interests in property, and about half of these have a mortgage. Owner occupied home owners are a little more sanguine now, but property investors, after a wobble earlier in the year, are still strongly in the market. In addition, there is still demand from overseas investors, and migrants. Overall demand is now stronger than at the start of the year. This is reflected in continued high auction clearance rates, especially down the east coast.

First time buyers are finding it difficult to compete with cashed up investors, and with incomes static and tighter underwriting standards, it is harder than ever for them to enter the market.  Down traders – people looking to sell and release capital – are active, and are in the market for smaller homes, and investment property. Households seeking to trade up are also active, driven by the expectation of ongoing capital gains. Investors are attracted by the generous tax breaks, including negative gearing and capital gains.  This despite rental incomes falling again, and the fact that about half of investors are underwater on a cash-flow basis, though bolstered by continued capital gains.

So overall demand is strong, and it has not yet been impacted by the rising mortgage interest rate bias that we have seen in the past couple of months.

Property Supply

Turning to property supply, there have been a significant surge in new building, mainly in and close to the central business districts in Melbourne, Brisbane and to some extend in Sydney, though here new building is more widely spread. Well over two hundred thousand new properties are coming on stream and more than half of these will be high-rise apartments. That said forward approvals are slipping now, so we may have passed “peak build” in the current cycle.

We are also seeing significant subdivision of existing residential land, and a rise in new house construction as well. The average plot size continues to fall, but we still place larger buildings on these smaller plots.

In Sydney and Melbourne, the amount of housing on the market is not meeting demand, though this is not true in some other markets – for example in areas of Western Australia and Queensland, especially in the mining belts. The Reserve Bank is concerned about the impact of potential oversupply in apartments in the main centres.

Finance Supply

Turning to finance supply, Households can still get mortgage finance, but in recent times there has been a significant tightening of underwriting standards. Interest rate buffers are now higher than they were, income flows are being examined more critically, and lenders who are making interest only loans, which account for about one third of transactions, are looking for greater precision as to how the capital will be repaid later. Foreign investors are finding it harder to get a loan from the major lenders, although a number of smaller banks, and other non-traditional lenders are more than willing to do a deal. In addition, foreign income is now under greater scrutiny, following a number of recent frauds.

Overall credit growth is a little slower than a year ago, but at above 6% is still well above inflation and income growth. Within the mix, recently, investment mortgages have been growing faster than owner occupied loans. Household debt has reached an all-time high, thanks mortgage growth, with the ratio at 186 percent of debts to disposable incomes, one of the highest ratios in the world. Low interest rates mean that currently the servicing burden is not currently too bad, but this would change quickly if rates were to rise, thanks to excessive leverage.  Household savings ratios are falling.

Whilst unemployment rates remain controlled, at 5.6%, the main issue for many households is that real incomes are just not rising, and as a result, some are finding it harder to make their mortgage repayments on time. At the moment mortgage delinquency is rising, just a little, but faster in areas of WA and QLD.

Recently the Trump Effect has led to a rise in US bond yields, and this has had a knock-on effect in the capital markets, lifting the rates banks must pay for capital. As a result, we have seen the yield curve move up, and banks have been lifting their mortgage rates – somewhat selectively so far – with investors taking the brunt, but the trend is widening. The recent RBA cash rate cuts are being offset by these rises, and we think it unlikely the RBA will lower rates again, so mortgage rates will continue to rise. We will discuss the possible impact in 2017 later.

Summary

So we can say that 2016 has been a positive year for those in the market, with sizable capital gains for many, significant transaction momentum and construction, and in line with the RBA’s intention part of the re-balancing of the economy away from mining construction. The cost has been, first higher home prices, as well as larger pools of debt and more households excluded from the market.  Banks have 62% of their assets in residential property, a high, and are more exposed to the sector than ever, despite holding more capital than they did. We believe regulators should be doing more, but only reluctantly, and lately, are they coming to the party.

Next time we will look at prospects for 2017.

Why Productivity Growth is Faltering in Aging Europe and Japan

From The IMF Blog.

Many countries are experiencing a combination of declining birth rates and increasing longevity. In other words, their populations are aging. And graying populations pose serious issues for people, policymakers, and society. 

Health care costs rise, mainly because older people need more of it. Pension payments—whether from public or private plans—also increase at the same time there are relatively fewer younger workers paying into the pension systems. And there are also fewer people producing goods and services relative to the total population. The old-age dependency ratio—the number of people over 65 divided by the number of people between 15 and 64—rises. In other words, there are economic strains and many countries that haven’t faced them yet will soon.

One way to alleviate those strains would be to increase the amount of goods and services each worker produces—that is to boost productivity. Productivity is a major driver of economic growth. When it is rising, more goods and services are produced from the same amount of input—giving society more output to divvy up. When productivity is falling, GDP growth is retarded.

How aging affects productivity

But two recent papers by IMF economists suggest that there are limited prospects for productivity to come to the rescue. That’s because not only is the overall population aging, so are those still in the workforce. And the aging workforce is holding down productivity growth in both Europe and Japan.

The decline in productivity in Japan and Europe manifested itself in what economists call Total Factor Productivity, which is the portion of economic growth that is not the result of changes in inputs (such as capital and labor). Total factor productivity measures how efficiently capital and labor are used in the production process and is affected by such things as innovation, institutions and the quality of the workforce.

Productivity generally increases until workers are in their 40s, then tails off until they stop working. In Japan, for example, workers in the 40 to 49 age group were the most productive, with productivity declining after that. Authors Yihan Liu and Niklas Westelius calculated that the aging workforce could have reduced Japan’s annual total factor productivity growth by as much as 0.7–0.9 percentage points between 1990 and 2005. The decline was largely due to the reduction in the 40 to 49 age group. Starting in 2010, the 40 to 49 group increased a bit, but after 2025 shifts in the working age population age will again reduce total factor productivity growth.

The story is similar for 28 countries in Europe. Authors Shekhar Aiyar, Christian Ebeke, and Xiabo Shao found that the growing number of workers aged 55 and older on average “lowered total factor productivity growth by about 0.1 percentage points each year over the past two decades.” But that varied across countries. In Latvia, Lithuania, Finland, the Netherlands, and Germany, workforce aging shaved about 0.2 percentage points off annual total factor productivity growth.

Future could be worse

Under current demographic projections, the future will be worse. From 2014 to 2045 workforce aging will intensify in Europe and could reduce annual total factor productivity growth by 0.2 percentage points. But in countries where aging will be most pronounced—Greece, Hungary, Ireland, Italy, Portugal, Slovakia, Slovenia, and Spain—annual total factor productivity growth could be reduced by as much as 0.6 percentage points.

Aiyar, Ebeke, and Shao write that some of the effects of total factor productivity erosion from workforce aging might be offset in Europe by such policies as:

  • Broadening access to medical services to improve the overall population health;
  • Improving workforce training;
  • Reforming labor markets to make it easier for older workers to change jobs; and
  • Promoting technological innovation to improve overall productivity—among other things, through increased spending on research and development. To the extent that such changes (for example, devices that reduce physical labor associated with manufacturing) disproportionately benefit senior workers, they could mitigate the adverse effects of an aging workforce on total factor productivity growth.

New Banking Model For Latrobe Valley

Nab says Latrobe Valley residents will for the first time have access to a unique model of financial services – with plans for Victoria’s fourth Good Money store to open in Morwell next year.

A partnership between the Victorian Government, Good Shepherd Microfinance and the National Australia Bank (NAB), Good Money stores offer responsible financial products and services including no interest and low interest loans, financial counselling and affordable insurance.

The Minister for Families and Children, the Honourable Jenny Mikakos MP, said that the Latrobe Valley Good Money store would also be the first to offer in-house financial counselling services.

“We’re working to make sure that local people have improved access to appropriate and affordable financial services and products now and into the future,” said Minister Mikakos.

“Importantly, this will be the first Good Money store in regional Victoria and it will have a financial counsellor on site providing free support, information and advocacy for people who are experiencing financial difficulty,” she said.

The Victorian Government is investing $2.9 million to establish and operate the store over four years. Good Money will initially provide services from the Latrobe Valley Authority site in Morwell until the store opens in May 2017.

Chief Executive Officer of Good Shepherd Microfinance, Adam Mooney, said that the Victorian Government investment in the new Good Money store was an important step in helping to secure the economic future of the Latrobe Valley.

“Over the coming years, Good Money will enable people in the Latrobe Valley to keep their cars on the road, meet the costs associated with education and retraining, and afford the things that keep families running like washing machines and fridges,” said Mr Mooney.

“There is high demand for safe, fair and affordable finance options in many parts of regional Victoria and we’re delighted to open a Good Money store here in Morwell. This store will provide valuable services to individuals and families who are excluded from mainstream finance in the Latrobe Valley region,” said Mr Mooney.

NAB General Manager of Retail (Victoria), Mary Scoutas, said the announcement is part of NAB and Good Shepherd Microfinance’s joint commitment to provide more than one million people on low incomes with access to fair and affordable finance by 2018.

“We know there is a real need for initiatives such as this within the community to help build resilience and reduce the risk of falling into a situation of long-term financial hardship,” said Ms Scoutas.

“The Latrobe Valley Good Money store meets the evolving needs of the local community, extends the Good Money franchise to regional Victoria for the first time and builds on our growing network of stores, with three in Melbourne, one in South Australia and another two set to open in Queensland next year.”

The products and services offered through Good Money include:

  • No Interest Loan Scheme (NILS) – Loans of between $300 and $1,200 for essential goods and services, including educations costs and equipment needed for training.
  • StepUP Loan – Loans of between $800 and $3,000, typically used for car related expenses, that keep people on the road and enable them to get to work, get the kids to school and stay engaged with their community.
  • Affordable insurance – simple car and contents insurance with flexible payment options.
  • Financial counselling – free, confidential and independent debt management and budgeting advice.

The partnership between Good Shepherd Microfinance and NAB has reached almost half a million people in Australia with no and low interest loans since 2005.

Background

The Victorian Government provides operational funding for three Good Money community finance stores in Collingwood, Dandenong and Geelong, with microfinance loan capital provided by NAB. In 2015 Good Money expanded to South Australia and, in 2017, two stores will open in the Queensland. Good Money is a three-way partnership between Good Shepherd Microfinance, NAB and state governments.

Is Australia’s Property Market One of the Worst Speculative Manias in Human History?

From The NewDaily.

Former bank boss David Murray has warned of disastrous property crash.

Australia’s property market now mirrors one of the worst speculative manias in human history, according to a former Commonwealth Bank CEO.

In a televised interview that drew little media attention, David Murray warned that the entire economy is “vulnerable” because of overvalued house prices in Sydney and Melbourne.

“All the signs of a bubble are there. Many of the signs are the same as the Dutch tulips,” Mr Murray told Sky News on December 1.

Starting in 1634, the Dutch bid up the price of tulip bulbs to extraordinarily high levels. Then, in 1637, the price collapsed, turning the craze into a byword for speculative insanity.

Since 2009, Sydney dwelling prices have risen by 95 per cent and Melbourne by 85 per cent, according to CoreLogic, a prominent property analysis firm.

Mr Murray, who chaired a recent inquiry into the health of Australia’s financial sector, said we may yet avoid a Dutch-style price plunge. It is a risk, not a certainty.

“If the economy tracks along okay, it might turn out that this thing sorts itself out. But when those risks are there, something needs to be done about it in a regulatory sense, and the Reserve Bank and APRA need to stay on it.”

Australia’s central bank (the Reserve Bank) and its prudential regulator (APRA) share the task of protecting the financial sector.

In recent years, APRA has imposed tougher lending policies on the big banks, including forcing them to hold more capital as a buffer against mortgage defaults. This was a recommendation made by Mr Murray during his financial sector review.

The former bank boss has been warning of a property bubble since at least last year. The fact that prices in Melbourne and Sydney have not corrected already is a further cause for concern, he said in his latest interview.

“When we get a momentum in a market like this, when you get these self-amplifying price spirals, the fact they keep going on and on longer than expected is another sign that it’s not very healthy.”

The crash, if it eventuates, would be triggered by a large number of landlords being forced to sell their investment properties all at once, thereby driving down prices, Mr Murray said.

“We have more investors in the market than we’ve had historically and those investors typically, even people on lower incomes, own multiple properties and those properties are often collateralised in the system. So they’re the people who become forced sellers, and that’s the risk to the system.”

Unlike those who predict a property crash with glee, Mr Murray gloomily delivered his warning. A crash might make it easier for first home buyers to enter the market, but it would have terrible consequences overall, he said.

“If home prices fall significantly, there’s a wealth effect on the economy and a constraint on consumption and that doesn’t help everybody, it doesn’t help jobs, so we don’t want that.”

Mr Murray was CBA chief executive between 1992 and 2005. Two years after leaving the bank, he was awarded an Order of Australia for his service to the finance sector.

In 2014, at the request of the Abbott government, he chaired the financial system inquiry, which recommended a slew of reforms to increase the sector’s resilience to crisis, including an increase in bank capital levels.

Also in the Sky News interview, Mr Murray said he had faith in the ability of Australian banks to protect themselves from the risks of mortgage defaults.

“They are basically well-managed institutions,” he said.

He also said Australia’s federal government should invest more in productive public infrastructure in order to boost jobs and growth.

“Infrastructure – great public goods in transport, energy, whichever area – are very valuable to the economy and can lift productivity, subject to proper cost-benefit analysis and correct choice of project.

“So if there are ways that some government funds can be used and public-private partnerships can be used wisely, that is a good way of getting productivity and growth in the economy.”


Household Finance Confidence Higher Again

The latest data from the Digital Finance Analytics Household Finance Confidence Index shows a further improvement, with the November score now just above the 100 neutral position at 100.02. This is up from 98.2 in October, and the first time since 2014 we have been above the neutral setting.

fci-nov-2016-summaryThe full effect of recent rate changes and the availability of low-rate fixed mortgages, together with climbing home values in most states, combined,  have driven both home owners, and property investors confidence higher. In fact, for the first time in more than a year, property investors are more confident than owner occupiers. On the other hand, the one-third of households excluded from the property market drifted lower, thanks to higher costs of living and static or falling incomes.

fci-nov-2016-propertyLooking across the states, households in NSW are much more confident, with VIC slightly behind. Households in WA reported a fall in confidence, thanks to poorer employment prospects and falling home prices.

fci-nov-2016-statesjpgOn average households were a little less comfortable with the amount of debt they hold, thanks to expectations that interest rates have passed their low point, and will rise. 27.6% of households were less comfortable, up 3.9% from last month.

fci-nov-2016-debtWe also see a continued fall in real incomes, thanks to rising costs and flat or falling pay. 47.5% said their incomes had fallen, in real terms, in the past year, up 2.3% last month.

fci-nov-2016-income Households reported improved investment incomes from stocks and term deposits. However, appetite for investment property, especially down the east coast remains strong.

On average, younger households were less confident compared with those aged above 50 years.

By way of background, these results are derived from our household surveys, averaged across Australia. We have 26,000 households in our sample at any one time. We include detailed questions covering various aspects of a household’s financial footprint. The index measures how households are feeling about their financial health. To calculate the index we ask questions which cover a number of different dimensions. We start by asking households how confident they are feeling about their job security, whether their real income has risen or fallen in the past year, their view on their costs of living over the same period, whether they have increased their loans and other outstanding debts including credit cards and whether they are saving more than last year. Finally we ask about their overall change in net worth over the past 12 months – by net worth we mean net assets less outstanding debts.

Unpaid super tally hits $3.6 billion

From Smart Company.

Businesses should review their obligations for compulsory superannuation contributions or potentially suffer the consequences, say experts, as a spotlight is shone on the $3.6 billion of unpaid super across the nation.

super-underpaid-dec-16

On its last sitting day on Thursday, the Senate referred the non-payment of superannuation guarantee contributions by Australian employers to the economics references committee for review in 2017. Superannuation groups have been busy modelling the scale of these non-payments, with a report from Industry Super Australia (ISA) and industry super fund Cbus released over the weekend pinning the value of unpaid super at $3.6 billion in 2013-14.

The report was completed by former Treasury official Phil Gallagher, who believes the $3.6 billion figure is “conservative”. The report highlights underpayment in the building and hospitality industries in particular, claiming the Australian Tax Office has to date been too laid back in pursuing businesses that fail to comply with the 9.5% employee super payments required by Australian law.

Over the past two years a number of studies have revealed that Australian SMEs are not focused enough on retirement planning, are sometimes tempted to put off contributing to their own superannuation and can be confused about their obligations to other staff members, particularly when employees volunteer to forgo their super. But experts warn that businesses must be vigilant in key areas of confusion, because the consequences can cost you.

Key concerns: Contractors and loopholes

The ISA report draws attention to the tendency of some businesses to incorrectly classify employees as contractors so as to avoid paying superannuation and other conditions – and that this problem increases or decreases depending on wider employment conditions.

However, David McKellar of Allied Accountants told SmartCompany that while businesses might not have to pay super contributions for a sole contractor for certain types of work, too often businesses continue to classify a worker as a contractor even after their role has come to fit the characteristics of an employee.

“In these cases, both the employer and contractor might not know there’s a liability there,” McKellar says.

The Fair Work Ombudsman directed SmartCompany towards its checklist for classifying employees and independent contractors, highlighting that contractors need to use their own equipment to complete work, work to a specific project outcome rather than on an ongoing basis, and have a high level of control over how the project is completed.

“The main thing is if the majority of the work is provided in the labor, not materials, provided by a person, then in all likelihood and most probability they will need to pay super,” senior lecturer at Deakin Business School Dr. Adrian Raftery says.

If a business owner is unsure about their responsibilities, the ATO also has a tool to calculate payments, but Raftery says some employers may be advised to pay the super guarantee to avoid facing fees for non-compliance later.

“If anything, err on the side of being conservative.”

One “loophole” the ISA report highlights as a key issue is around employees volunteering to salary sacrifice some of their wage into super. Under the current regulations, an employer is able to count this amount as part of the 9.5% that it pays into a worker’s super. However, super groups view this as contributing to further issues down the line, with many Australians already stressing over whether their retirement savings will see them through to the end of their lives.

“With access to government pensions tightening and home ownership in decline, future generations of retirees will be increasingly reliant on superannuation,” the report says.

What small businesses need to know

Small business owners have reported that they’re behind in their own retirement planning for a variety of reasons, from uncertainty over the future of the Coalition’s now-passed super changes to issues with cashflow that see them pay the business’s costs before paying themselves.

However, the costs of not upholding your obligations on super in smaller businesses can be high – even if the only person you’re not paying is yourself. While sole contractors don’t have the same requirements, the minute you operate as a business, you have to uphold your obligations, even if staff have volunteered to forgo super, says Raftery.

“Ethically, these small businesses who are struggling with super say, ‘I’ll pay all the other employees first’ and will be a bit more slack with themselves,” he says.

This is problematic because the fees that the ATO charge for late payments apply even if a business owner has chosen not to pay themselves.

The ATO highlights the interest charges that get applied when a business fails to pay the super guarantee on time.

“It’s essentially a penalty on each quarter that you’re late – however much super that you should be charging plus an interest rate of 10%, plus an admin fee per employee, per quarter,” says Raftery.

“The other thing that is really important is that if you get hit up with the super guarantee charge, you cannot claim that as a tax deduction.”

McKellar says for those in small family businesses, there’s only really one scenario where super contributions don’t need to be paid.

“The only way around it would be perhaps if someone is working for no payment,” he says.

Other than that, you must pay up. And while business owners might feel stress in the short term, when it comes to their own retirement planning, paying themselves is the best choice for tax planning, says Raftery.

“There’s a legal obligation and if you don’t pay your own and the ATO does its investigation, they won’t treat you any differently than a independent employee,” he says.

“But for their tax incentives it’s to their advantage to pay into super – otherwise they’re just being taxed at the corporate tax rate.”

The inquiry into superannuation payments will look at the accuracy of data collected by regulatory bodies around the value of payments made, as well as the ATO’s approach to compliance.

Submissions to the inquiry are open until February 17, with a view to report by March 22, 2017.

Job Ads Higher In November

ANZ says Job advertisements rose 1.7% m/m in November following a 1.0% rise in the previous month. Annual growth in job ads accelerated to 6.1% y/y, up from 5.2% y/y in October. In trend terms, job ads rose 0.5% m/m in November, slightly lower than the 0.7% rise in the previous month.

anz-job-ads-nov-16“The rise in ANZ job ads over the past four months is quite encouraging given the recent softness in the employment data. It is consistent with our view that although the pace of improvement in the labour market has slowed, conditions remain supportive of ongoing recovery.

The RBA has cited the labour market as a key risk to the economic outlook, reflecting concern over the degree of spare capacity given the high rate of underemployment. This spare capacity has the potential to weigh on wage growth and jeopardise the timing of the return of underlying inflation into the 2-3% target band next year. Moreover, the recent soft patch in activity also poses some risk to employment growth in the near term. As such, we expect that the labour market and the weakness in wage growth will be a key topic of discussion at this week’s RBA board meeting.

The strength in job ads recently, however, suggests that moderate economic growth should remain supportive of an ongoing gradual fall in the unemployment rate, given still solid business conditions and low interest rates.”

Neighbours’ fears about affordable housing are worse than any impacts

From The Conversation.

Housing affordability is a hot topic in Australia. Governments are increasingly recognising that more needs to be done to provide a greater range of affordable housing options, especially in the major cities. It is well documented, however, that proposals for affordable housing development often encounter opposition from host community members.

half-buit-house-pic-2

These community concerns tend to focus on the potentially damaging effects of such projects on property values and quality of life for existing residents. This is despite the public being generally supportive of affordable housing in principle. They would just prefer it wasn’t sited in their local area.

In reality, though, do the concerns that people have about affordable housing development materialise? Do property values go down? Does neighbours’ quality of life suffer?

Our case studies in Brisbane and Sydney provide evidence that, in most cases, they do not.

Testing for local property impacts

How did we test for the impacts of affordable housing projects? With thanks to Australian Property Monitors, we had access to property sales data throughout the Brisbane local government area (LGA), going back to 1999.

Using this data, we tested the impacts of 17 affordable housing developments on property sale prices through two different hedonic pricing models. The models were designed to test whether:

  1. The announcement and eventual construction of affordable housing projects had any impacts (positive or negative) on local property sale prices. Project announcement date was used to capture any “panic sales” that may have happened as a response to the announcements.
  2. The extent of such impacts depended on proximity to the development (by direct distance in 100-metre intervals, up to 500 metres away from the affordable housing project).

The two models were used to test these outcomes collectively for 17 affordable housing projects that were developed across Brisbane LGA between 2000 and 2009, and also on an individual project basis.

Collectively across the 17 projects, these had no significant negative impacts on local property prices. There were mild impacts on properties within 100 metres of affordable housing projects, but not at any statistically significant level.

We found that the characteristics of the individual properties sold (such as number of bedrooms, number of bathrooms) consistently had much greater influence on sale prices than proximity to affordable housing developments.

When looked at individually, the impacts of each project on local property prices were mixed. Some affordable housing projects had positive impacts and others negative.

Only a handful of the measured impacts were statistically significant, however. Even in these cases the impacts of proximity to affordable housing had much to do with other features of the neighbourhood (such as proximity to public transport hubs, water frontages and so on).

These two tests clearly showed that the impacts of affordable housing development on local property sales prices had been minimal. The impacts that were experienced were not universally negative (or positive).

Impacts on the quality of life of neighbours

What then of the impacts on neighbours’ overall quality of life? How does an affordable housing development affect things like traffic, crime, an area’s visual appearance, or sense of community?

To understand this, we conducted doorstep surveys with 141 residents who lived close to (within about 60 metres) eight affordable housing projects in Parramatta local government area.

These projects had been locally opposed but still completed. We selected the most-controversial projects and were able to achieve participation by between one-fifth and one-third of the 60 or so residents likely to have been most affected by those developments.

We wanted to know whether people’s fears at the planning stage had materialised once the developments were complete and occupied.

Across the eight projects, 78% of respondents had experienced no negative impacts as a result of affordable housing development. At only two of our eight sites had a significant number of neighbours experienced negative impacts. These impacts were mostly associated with the behaviours of a small number of individual residents.

At the other sites, the negative impacts were dispersed. Mostly, these related to minor issues such as parking and traffic.

Fears are an obstacle in themselves

Overall, our findings indicate that the feared impacts of planned affordable housing developments tend to be much greater than the impacts neighbouring residents actually experience once those developments are complete and occupied.

In other words, the perception of affordable housing is the key problem, not the affordable housing developments themselves. These are by and large unproblematic once completed.

These findings suggest that governments and developers need to devote much more attention to tackling negative public perceptions of affordable housing and its residents.


Authors: Gethin Davison, Lecturer in City Planning and Design, UNSW; Edgar Liu,Research Fellow at City Futures Research Centre, UNSW


Is Financial Risk Socially Determined?

From The St. Louis On The Economy Blog.

The authors of the In the Balance—Senior Economic Adviser William Emmons, Senior Analyst Lowell Ricketts and Intern Tasso Pettigrew, all with the St. Louis Fed’s Center for Household Financial Stability—found that eliminating so-called “bad choices” and “bad luck” reduced the likelihood of serious delinquency. With the exception of Hispanic families, this did not get rid of disparities in delinquency risk relative to the lower-risk reference group.

However, this exercise was based on the idea that the young (or less-educated or nonwhite) families’ financial and personal choices, behavior and exposure to luck could conform to those of the old (or better-educated or white) families. The authors suggested that such an approach may not be realistic.

A Lack of Choice?

“We believe a more realistic starting point for assessing the mediating role of financial and personal choices, behavior and luck in determining delinquency risk is a family’s peer group,” the authors wrote. They looked at how an individual family’s circumstances differ from its peer group, hoping to capture the “gravitational” effects of the peer group.

The odds are similar to those that were not adjusted, as seen in the figures below. (For 95 percent confidence intervals, see “Choosing to Fail or Lack of Choice? The Demographics of Loan Delinquency.”)

Probability Serious Delinquency1

ProbSeriousDelin2

In particular, they examined how a randomly chosen family fared against the average of its peer group, such as how much debt a young black or Hispanic family with at most a high school diploma has compared to the family’s peer-group norm.

“We assume that the distinctive financial or personal traits associated with a peer group ultimately derive from the structural, systemic or historical circumstances and experiences unique to that demographic group,” the authors wrote.

When assuming that individual families’ choices extend only to deviations from peer-group averages, the authors estimated that:

  • A family headed by someone under 40 years old is 5.8 times as likely to become seriously delinquent as a family headed by someone 62 years old or more.
  • Middle-aged families (those with a family head aged 40 to 61 years old) are 4.2 times as likely to become seriously delinquent as old families.
  • A family headed by someone with at most a high school diploma is 1.8 times as likely to become seriously delinquent as a family headed by someone with postgraduate education.
  • A family headed by someone with at most a four-year college degree is 1.4 times as likely to become seriously delinquent as a family headed by someone with postgraduate education.
  • A black family is 2.0 times as likely to become seriously delinquent as a white family.
  • A Hispanic family is 1.2 times as likely to become seriously delinquent as a white family.

These demographic groups still appear to have a higher delinquency risk than older, better-educated and white families. This suggests that younger, less-educated and nonwhite families may have little choice in the matter.

“The striking differences in delinquency risk across demographic groups cannot be explained simply by referring to differences in risk preferences,” Emmons, Ricketts and Pettigrew wrote. “Instead, we suggest that deeper sources of vulnerability and exposure to financial distress are at work.”

The authors also concluded: “Families with ‘delinquency-prone’ demographic characteristics—being young, less-educated and nonwhite—did not choose and cannot readily change these characteristics, so we should refrain from adding insult to injury by suggesting that they simply have brought financial problems on themselves by making risky choices.”

Each family was assigned to one of 12 peer groups, which were defined by age (young, middle-aged or old), race or ethnicity (white or black/Hispanic) and education (at most a high school diploma or any college up to a graduate/professional degree).

The Problem Of Home Ownership

The proportion of households in Australia who own a property is falling, more a renting, or living with family or friends. We track those who are “property inactive”, and the trend, over time is consistent, and worrying.

inactive-property-2016It is harder to buy a property today, thanks to high prices, flat incomes and higher credit underwriting standards. Whilst some will go direct to the investment property sector (buying a cheaper place with the help of tax breaks); many are excluded.

This exclusion is not just an Australian phenomenon. The Federal Reserve Bank of St. Louis just ran an interesting session on “Is Homeownership Still the American Dream?” In the US the homeownership rate has been declining for a decade. Is the American Dream slipping away? They presented this chart:

us-ownershipA range of reasons were discussed to explain the fall. Factors included: the Great Recession and foreclosure crisis; tougher to get a mortgage now (but probably too easy before the crash); older, more diverse American population; stagnation of middle-class incomes; delayed marriage and childbearing; student loans and growing attractiveness of renting for some.

Yet, there is very little association between local housing-market conditions experienced during the recent boom-bust cycle and changes in attitudes toward homeownership. The desire to be a homeowner remains remarkably strong across all age, education, racial and ethnic groups. To remain a viable option for all groups, homeownership must become more affordable and sustainable.

They went on to discuss how to address the gap.

Tax benefits are “demand distortions.” Most economists agree that tax preferences for shelter (especially homeownership) push up prices: Benefits are “capitalized” into price or rent. Tax benefits of $150 bn. annually are skewed toward homeowners in high tax brackets via tax deductibility or exclusion. Tax changes likely in 2017—lower rates and higher standard deduction—will reduce tax benefits for homeownership, perhaps slowing or reducing house prices.

There also are “supply distortions” in housing that push up prices/rents. Land-use regulations/restrictive building codes increase construction costs, making housing less plentiful and less affordable. Local governments could reduce these constraints, and housing of all types and tenures would become cheaper.

Tightening Underwriting Standards. Unsuccessful homeownership experiences stem from shocks (job loss, divorce, sickness) that expose unsustainable financing—i.e., too much debt and too little homeowners’ equity (HOE). Reduce the risk of financial distress and losing a home by encouraging or requiring higher HOE and less debt. This would increase the age of first-time homebuyers and reduce homeownership but also reduce the risk of foreclosures.

You can watch the video here.  But I think there are some important insights which are applicable to the local scene here. Not least, you cannot avoid the discussion around tax – both negative gearing and capital gains benefits need to be on the table. Supply side initiatives alone will not solve the problem.