Victoria is the most popular destination for people moving from other states. It is also Australia’s fastest growing state at 1.7 per cent, compared to an overall Australian growth rate of 1.3 per cent, according to figures released by the Australian Bureau of Statistics (ABS) today.
ABS Director of Demography, Beidar Cho said that over the year to September 2015, only Victoria and Queensland experienced net increases from interstate migration.
“Victoria gained 11,200 people from interstate migration which is up from 8,500 people in the previous year and Queensland gained 6,900 people, which is up from 5,900 people in the previous year,” Ms Cho said.
All the other states and territories recorded net interstate migration losses with New South Wales recording the largest loss with 7,500 people despite the state growing by 102,200 people over the year ending September 2015. Victoria narrowly exceeded NSW’s growth, with an increase of 102,300 people overall.
Prior to 2010, Victoria’s proportion of Net Overseas Migration (NOM) remained steady at approximately a quarter of all NOM to Australia. This began to change after 2012 when the proportion of NOM to Victoria and New South Wales began to climb as the proportion of NOM to Western Australia and Queensland began to drop. In the year ending September 2015 New South Wales continued to receive the highest proportion of NOM at 40 per cent. Victoria increased its proportion to 33 per cent of Australia’s total whilst WA and Queensland both received around 10 per cent.
Australia’s population grew by 313,200 people (1.3 per cent) to reach 23.9 million by the end of September 2015.
Net overseas migration contributed 167,700 people to the population (7 per cent lower than the previous year), and accounted for 54 per cent of Australia’s total population growth.
Net overseas migration was the major contributor to population change in New South Wales, Victoria and South Australia.
Over the year, natural increase contributed 145,600 people to Australia’s population, made up of 298,200 births (4 per cent lower than the previous year) and 152,700 deaths (1 per cent higher than the previous year).
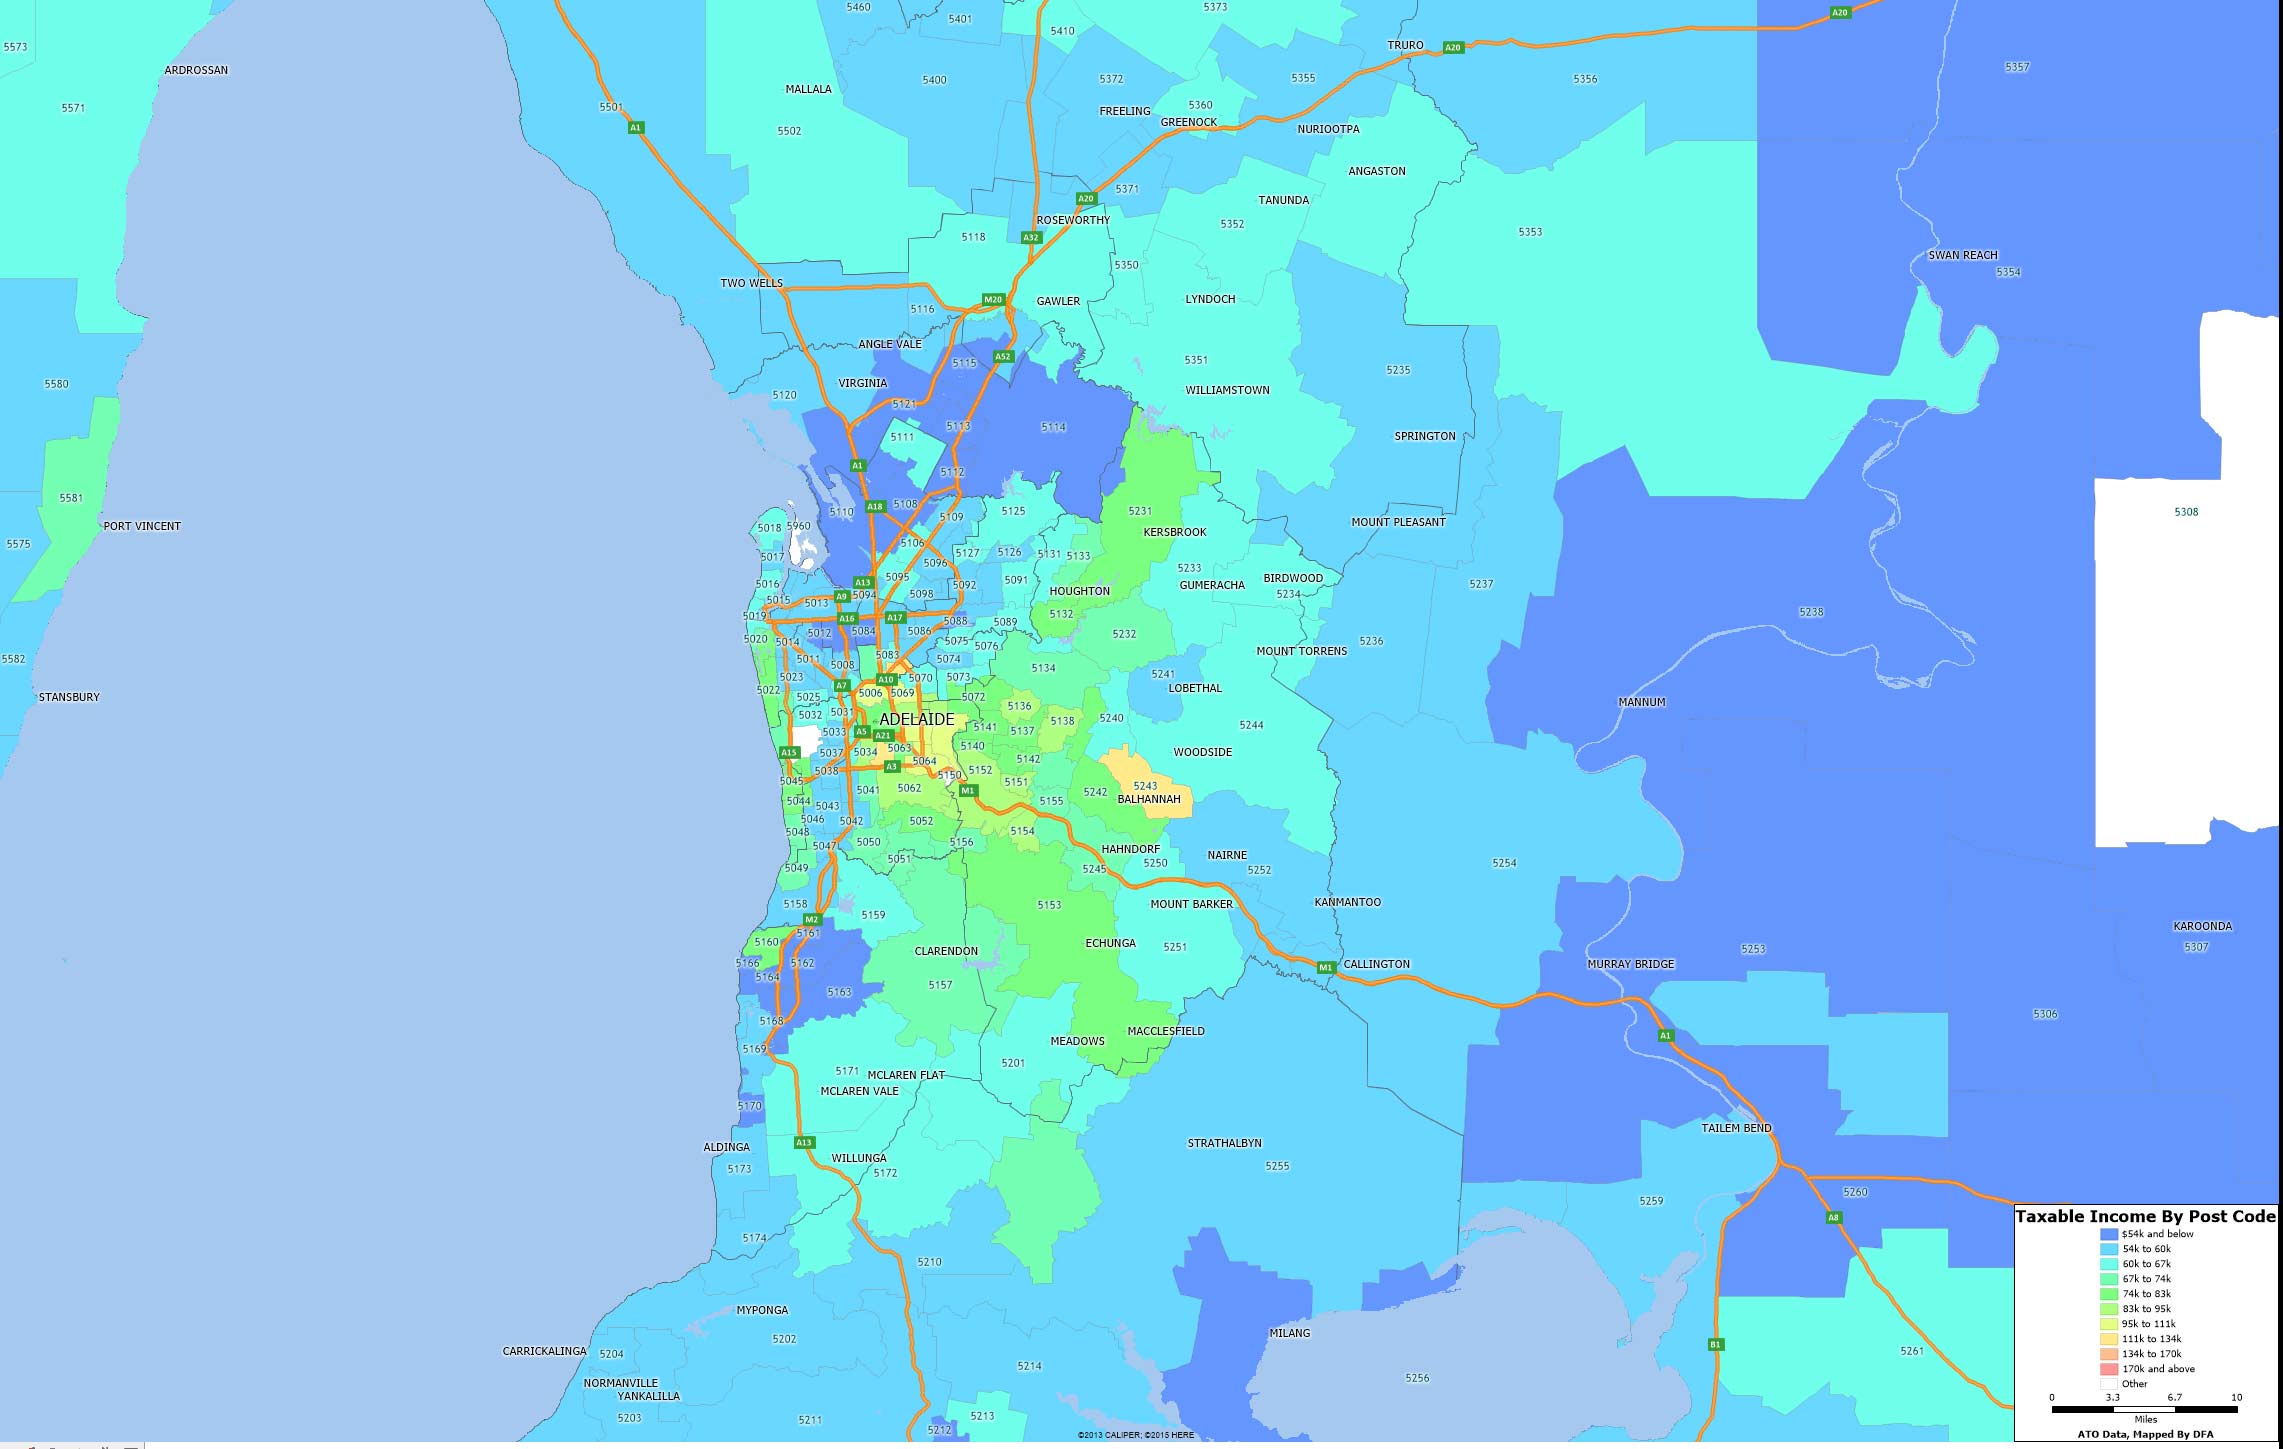
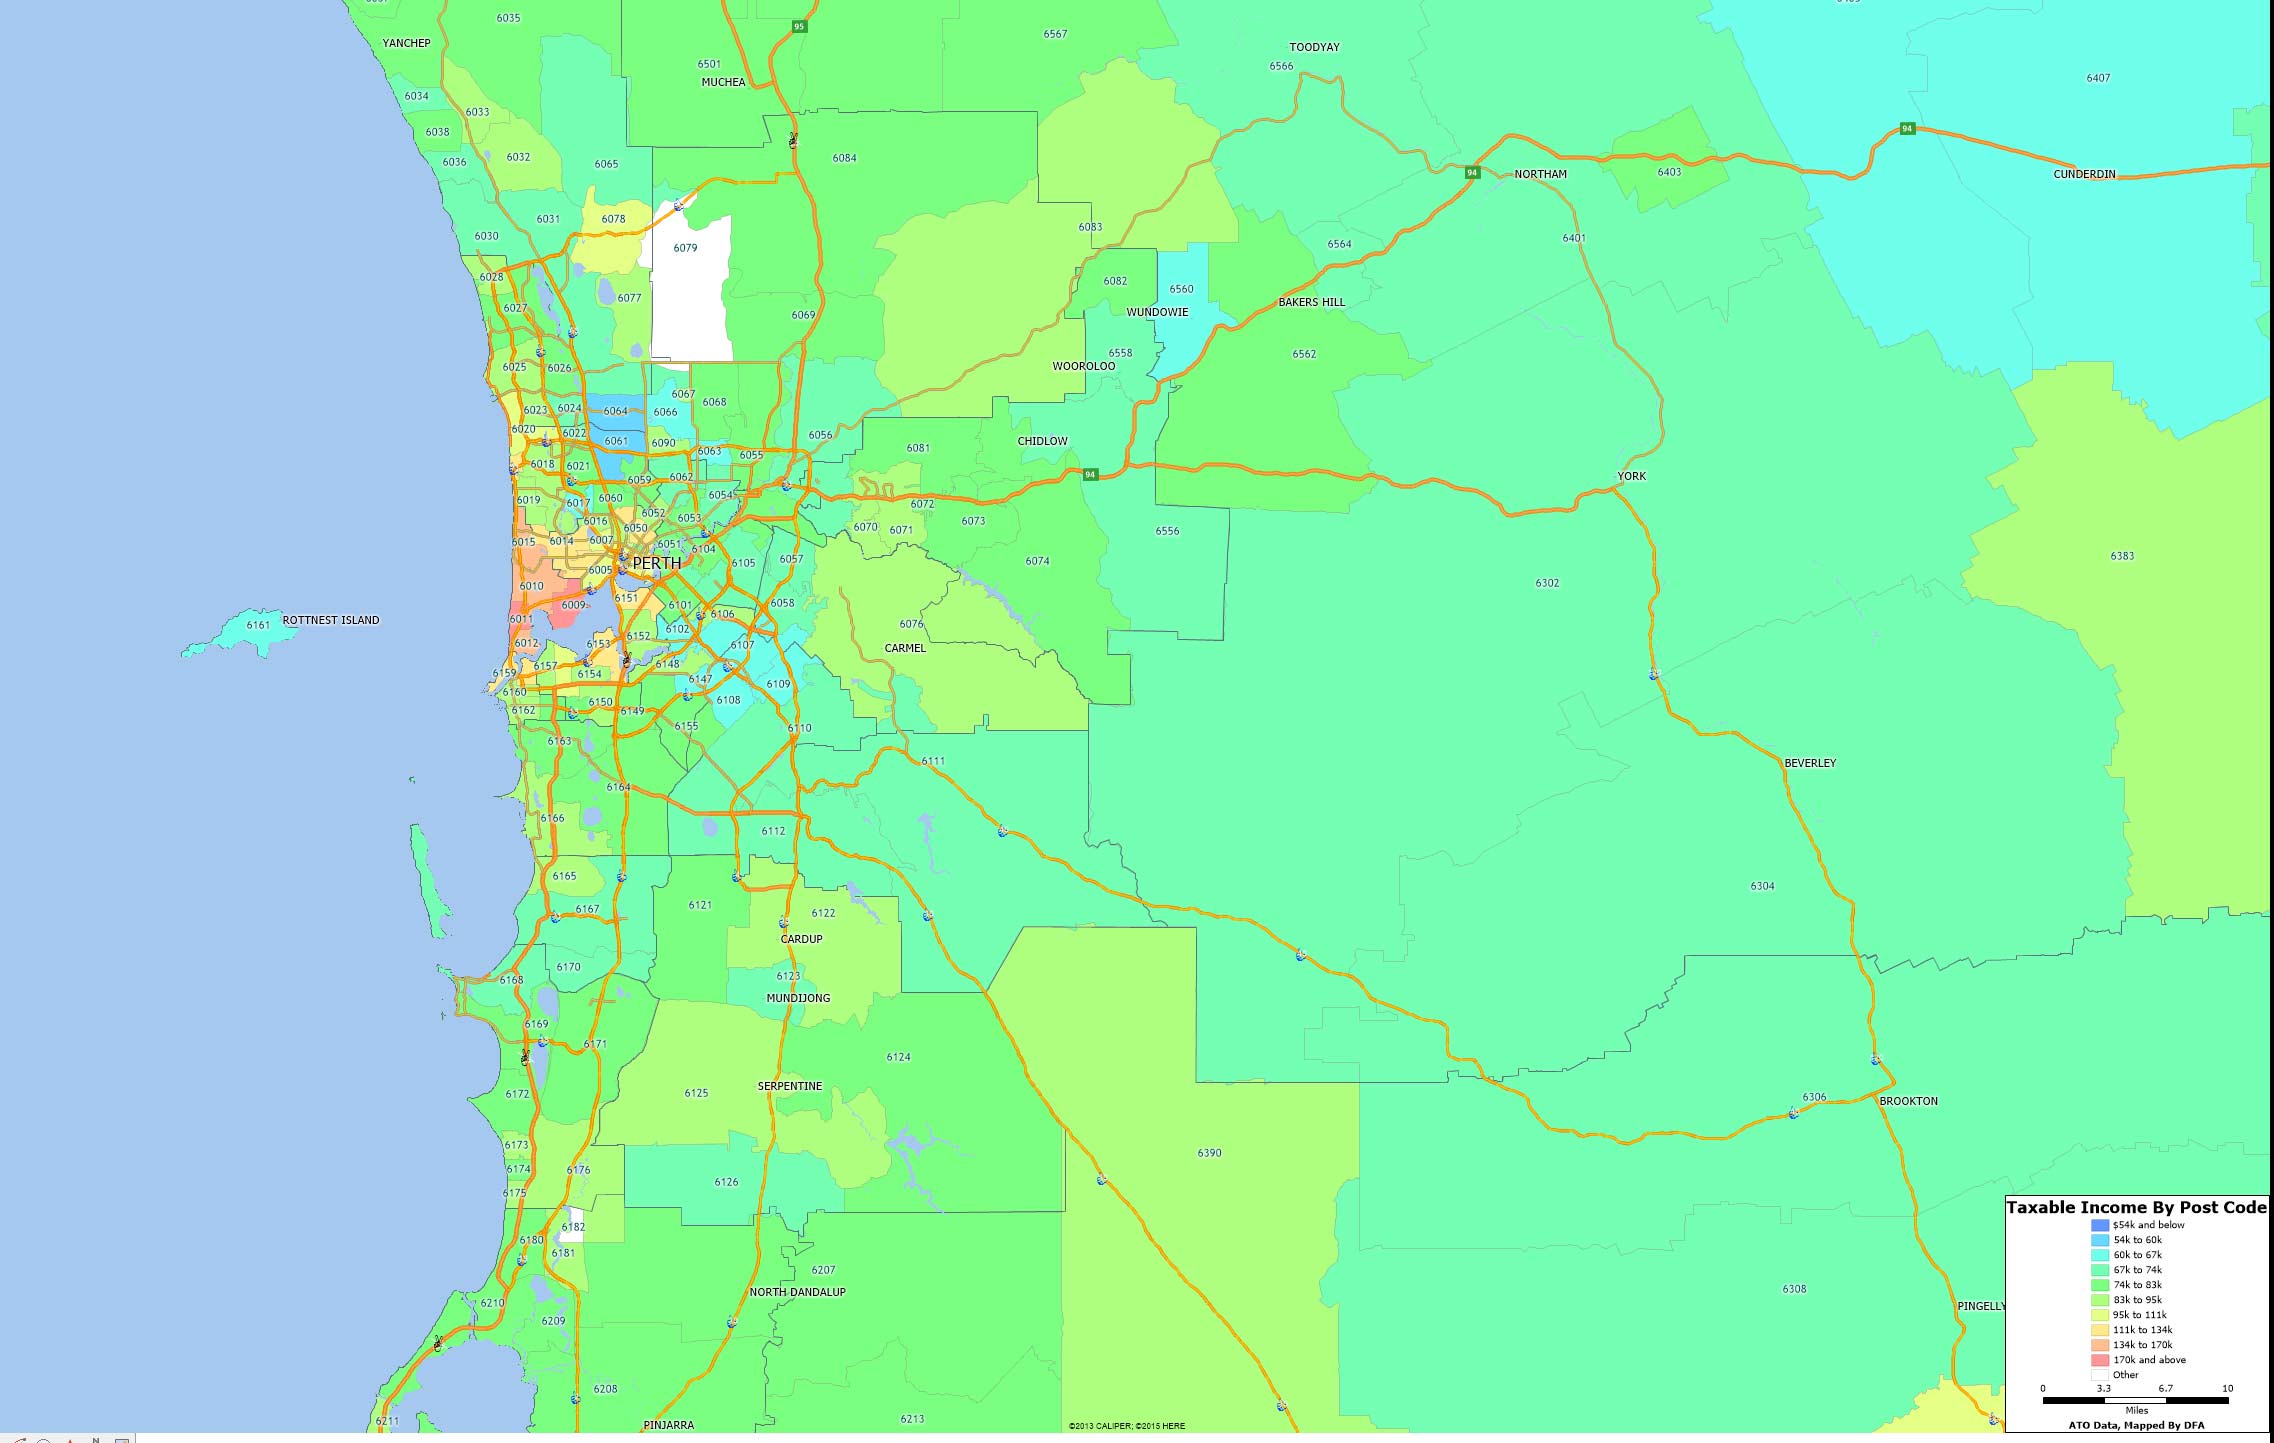
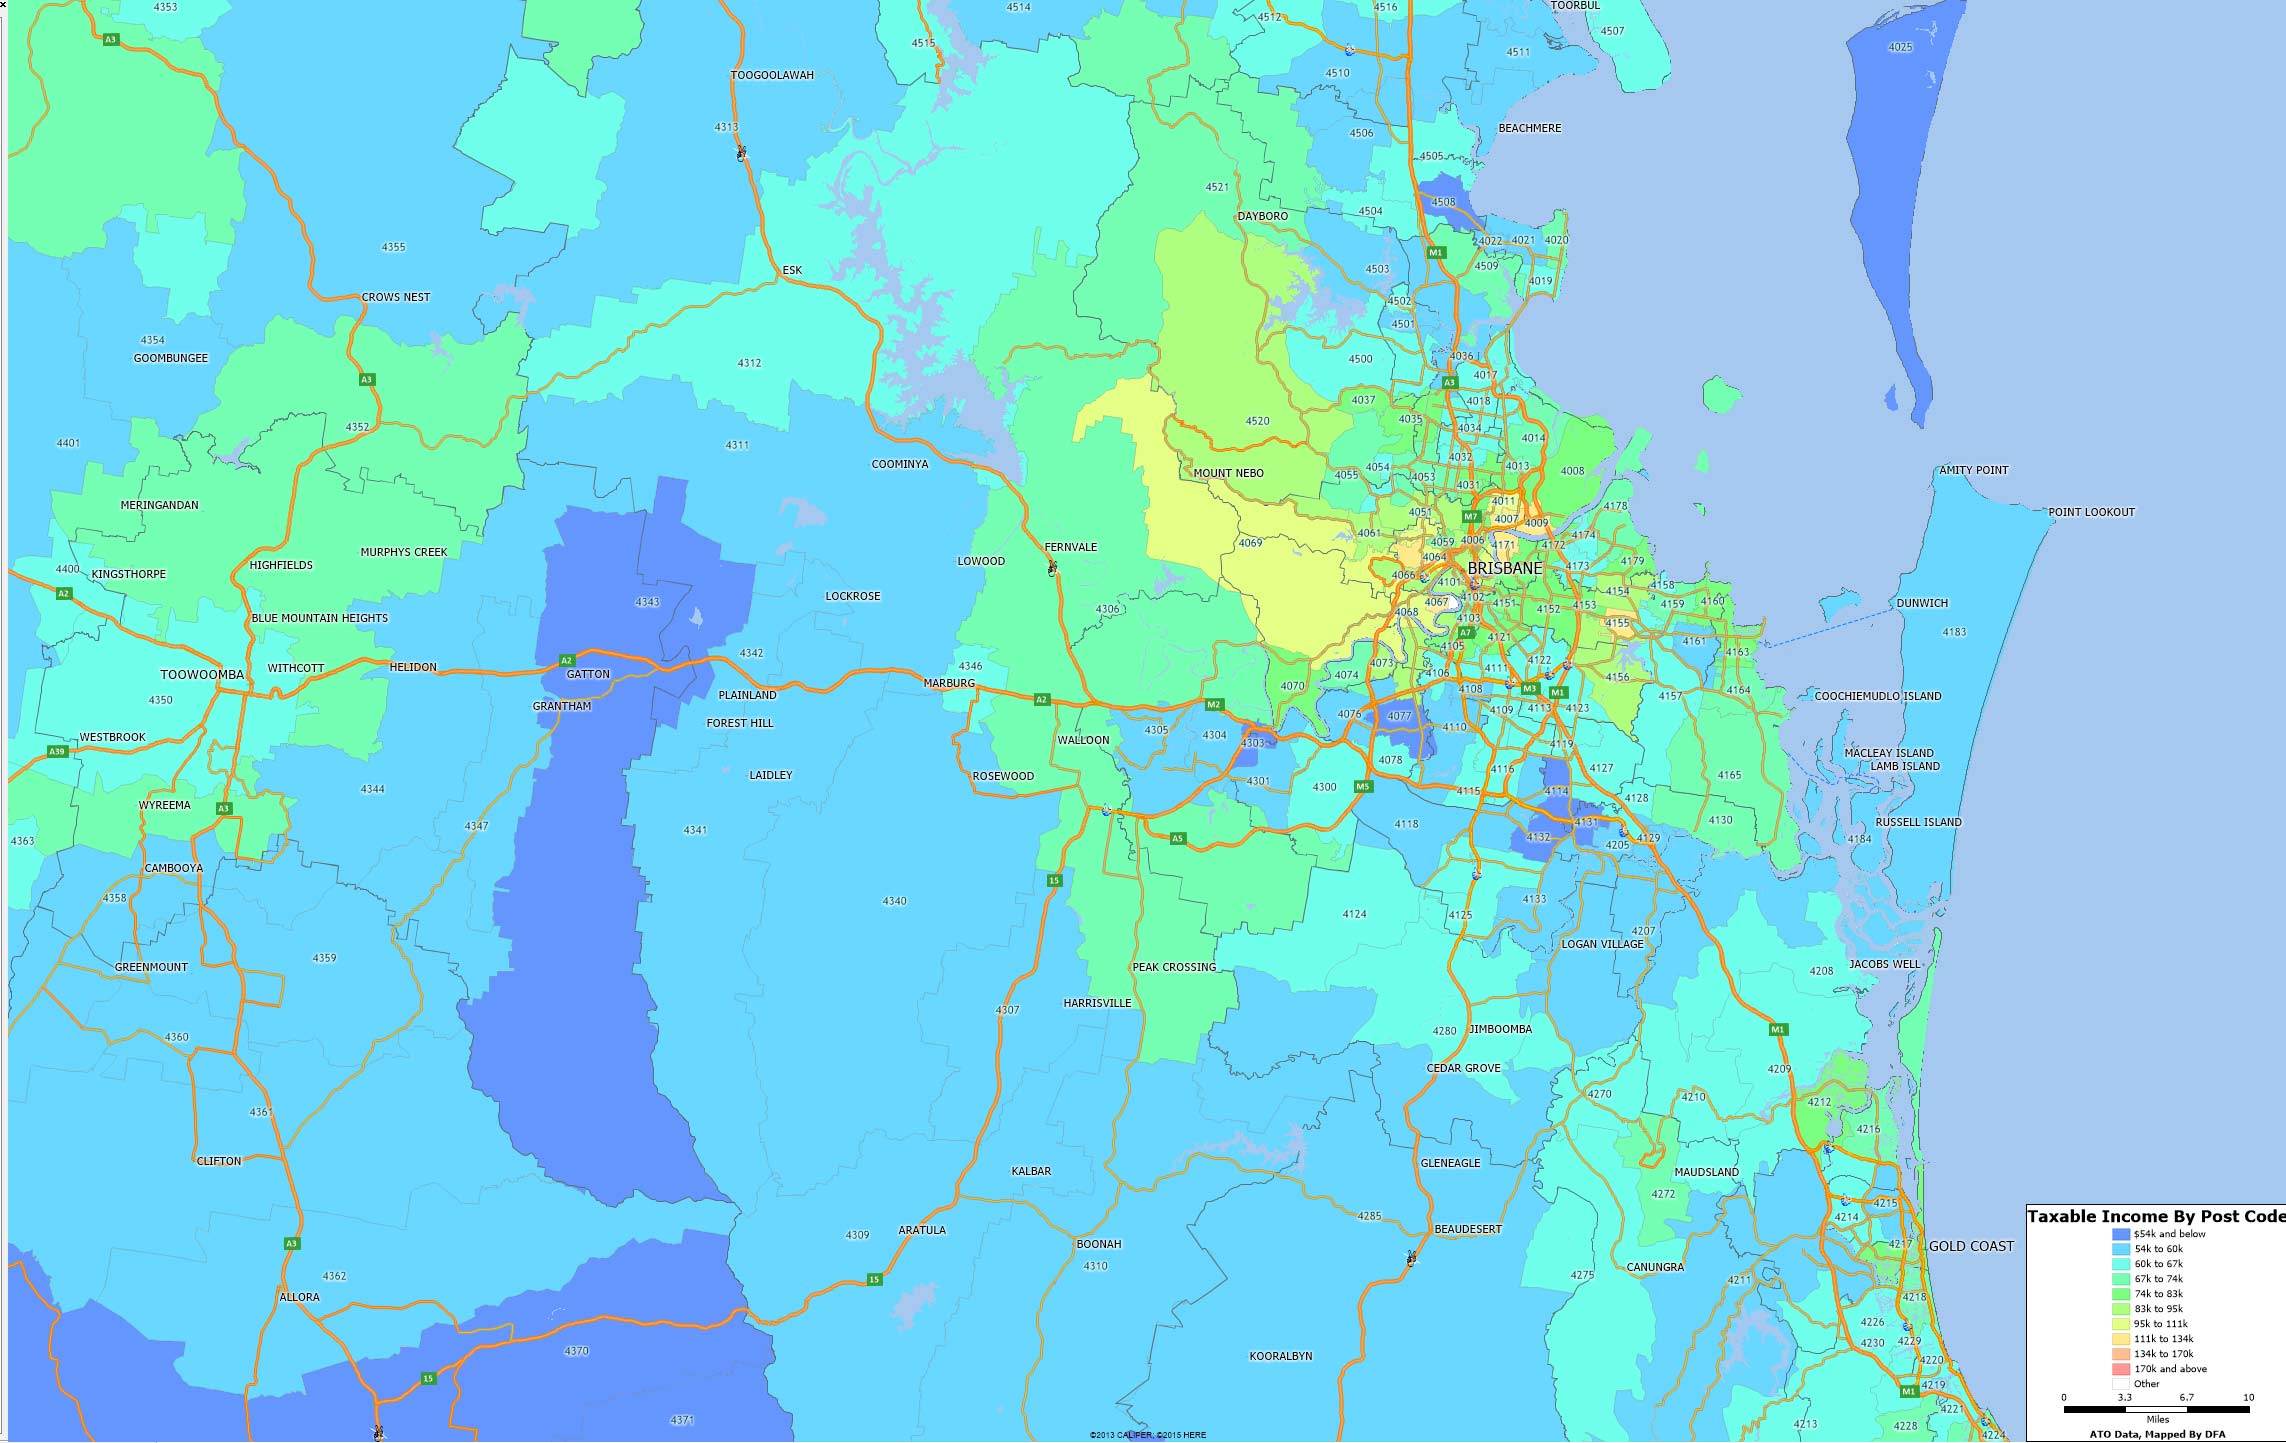
The ATO has just released its data for the 2013-2014 tax year. We have taken the average taxable income by post code and geo-mapped the data for NSW, centred on Sydney. The maps are based on clustered averages, distributed by the number of tax payers.
There are significant variations, of course (and this does not take account of those who have used various tax treatments to reduce their true income). The pink/red areas are the highest zones, the blue the lowest.
Another table gives the top and bottom post codes in NSW.
Over the next few days we will cover the other states.
The move, first announced last year, follows an aggressive campaign to get the largest private employer in the U.S. to lift worker wages and coincides with a nationwide push to raise federal and state minimum wages and a prolonged period of little growth in pay.
While Walmart’s decision is at least in part a result of that pressure, it’s still the action of a private company to revamp its own wage policies, as opposed to the result of a government forcing it to lift worker pay. Proponents of requiring just that argue raising the minimum helps reduce inequality. Critics contend it can actually worsen it by driving up unemployment and weakening economy-wide labor market flexibility by raising the costs firms face.
So what does the economic research say about the impact of minimum wages on income inequality and is there a better way to reduce it?
Minimum wage fallacies
Many of the articles in the mainstream press promoting minimum wages are incompatible with basic economic principles.
The first fallacy is that changes in the minimum wage do not affect the behavioral response among firms and individuals. The second fallacy is that higher wages will force companies to innovate in order to reduce costs. Both these arguments overlook some very basic, but informative, economic principles.
The first overlooks the fact that wages are designed to compensate workers for productivity. When wages are distorted, they affect the profit-maximizing decisions that businesses make. The textbook prediction, which is generally supported in the data, is that higher minimum wages reduce employment since companies restrict the number of workers they will hire. These adverse effects are especially likely given the pace of technological change and automation.
The second overlooks the fact that there are effective and ineffective ways to stimulate innovation among businesses. The idea that making hiring more costly will spur innovation is tantamount to requiring companies to reduce the size of their physical presence so they become more productive. While these types of distortions may prompt a small fraction of companies to innovate, misallocation more generally is a major factor behind cross-country differences in productivity.
Protests like these may have helped persuade Walmart to raise wages.Reuters
Minimum wage and inequality
Nonetheless, economists themselves have debated how minimum wages affect employer decisions for many years.
In 1994, economists David Card and Alan Krueger were the first to provide some evidence that such effects may be small. But more recently, a consensus has generally emerged that changes to minimum wages have strong effects on jobs growth.
How minimum wages affect inequality, however, remains controversial. Detecting it with standard statistical methods is very challenging because their full effects are constantly changing and require data on both individuals and companies.
Back in 1999, Princeton economist David Lee used the Consumer Population Survey (CPS) from 1979 to 1989 to argue that the declining purchasing power of the minimum wage largely explains why inequality surged in the 1980s.
Other new research, however, has put that conclusion in doubt. Perhaps the most conclusive reassessment comes from economists David Autor, Alan Manning and Christopher Smith earlier this year. Using many more years of microdata from the CPS, as well as a different statistical approach, they found that the minimum wage explains at most 30 percent to 40 percent of the rise in wage inequality among the lowest earners.
Since economists had thought that changes in the minimum wage could explain as much as 90 percent of the shift in inequality, these new estimates are important.
How wages affect worker behavior
While the extent is still uncertain, it’s clear that the minimum wage and other wage-setting forces such as tax rates and union bargaining power do in fact affect inequality and the labor market.
My own ongoing research, which focuses on the link between such wage-setting mechanisms and company behavior, suggests labor-market distortions like raising the minimum wage can have other negative effects on workers, businesses and inequality beyond the overall impact on employment.
The first adverse effect concerns how much people work. If, for example, worker wages rise due to a government mandate, the employer may reduce the number of hours staff work, leading to lower paychecks even after the raise. That’s part of the reason why we’ve seen companies like McDonald’s increasingly try to automate tasks that were once held by people.
In addition, my research suggests one of the major ways people acquire new skills is by spending more time at work. Thus policies that lead to fewer hours could lower employees’ ability to improve their long-run earnings potential.
The second is an indirect effect on the way businesses invest in workers and design compensation and organizational policies. When companies are forced to pay higher wages, they may offset the cost by reducing how much they invest in workers. There is evidence that minimum wage laws have this effect.
This can result in weaker compensation contracts (e.g., purely salary-based), which provide employees with fewer incentives to accumulate skills. As a result, workers paid fixed wages suffer greater long-run earnings volatility than those receiving performance-based pay.
Put simply, if a recession comes and an individual loses his or her job, having more skills makes it easier to find a new position and return to the previous income level.
Minimal impact on inequality
Even setting aside all the plausible economic arguments against the minimum wage, under the best case scenario, what does it really achieve?
If the average full-time employee works 1,700 hours per year, then moving from $7.25 an hour to $9 an hour produces only about $2,975 in additional annual earnings. While some may argue that something is better than nothing, this would be at best a marginal solution to inequality.
Taking a look at the most recent 2015 Current Population Survey data and restrict the sample to full-time earners with over $10,000 earnings per year, Americans at the 90th income percentile (they earn more than 90 percent of their compatriots, or $80,000 a year) make 5.6 times as much, on average, as those at the 10th percentile ($14,200). Increasing the minimum wage to $9 an hour would put the ratio around 4.65.
In other words, even in the best of worlds – where the minimum wage has no unintended side effects – it appears to only marginally reduce inequality.
Alternatives to raising the minimum wage
Where does this leave us in trying to reduce inequality?
First, companies are welcome to raise wages at any time they want. And letting them do so may be more effective at reducing inequality than when they’re forced to because it avoids the adverse consequences such as reducing hours.
Businesses are well aware of their marginal costs and benefits – how much it costs to produce an additional unit of output versus the incremental gain. When governments set uniform wage regulations, they require all companies – each with their own and distinct marginal costs and benefits – to abide by the same rules. In contrast, when companies decide to change their own pay practices – as Walmart is doing – they do so in a more efficient way.
Second, as Stanford economist John Cochrane has remarked, instead of addressing the short-term problem of low wages, governments and companies can address the more structural problem: a lack of skills.
Companies and local governments can provide training programs and support for additional education, such as through community colleges, in order to equip workers with additional skills that translate into meaningful value for their companies. Investing in worker skills can lead to increased employee productivity and creativity, which in turn translates into sustained higher wages. And these benefits have broad spillover effects throughout the labor market and make sustainable gains in narrowing the gap between the richest and the poorest.
While the economic effects of minimum wage laws are very complex and a subject of scrutiny within the economics community, there are much better ways to deal with systematic challenges in the labor market. Getting more people to work, reducing the barriers for businesses to hire and encouraging the accumulation of new skills are all strategies for promoting sustainable long-term growth in wages.
Author: Christos Makridis, Ph.D. Candidate in Macroeconomics and Public Finance, Stanford University
Four years in the making, the European Union’s new data protection rules have finally been agreed by the European Council and await the approval of the European Parliament. But a last-minute addition has sparked a debate about responsibility and consent, by proposing to raise to 16 the “age of consent” under which it is illegal for organisations to handle the individual’s data. This would force younger teenagers to gain parental permission to access social networking sites such as Facebook, Snapchat, WhatsApp or Instagram.
While raising this digital age of consent from 13 as it is in the US to 16 would strengthen the protections they receive, there are doubts about whether it would be enforceable. How would the firms behind social networks be able to verify their users’ ages, for example, or whether they had their parents’ permission? There are already Facebook and Instagram users below the age of 16, so that would entail potentially closing those accounts – how would this be policed?
Could parents or social network providers be prosecuted for allowing the under-16s to access a social network? The proposed new EU rules, the General Data Protection Regulation, would impose heavy fines (4% of annual turnover) for those organisations or firms that breach data protection laws, which means the likes of Facebook would have a great incentive to ensure they complied. But there are few obvious ways to do this.
Additionally, any ban may lead some teenagers to lie about their age in order to create or maintain an account, potentially putting them in more danger by pretending to be older than they are. Janice Richardson, former Co-ordinator of the European Safer Internet Network, said that denying the under-16s access to social media would “deprive young people of educational and social opportunities in a number of ways, yet would provide no more (and likely even less) protection”.
Sophisticated age verification software would be needed, such as scanning machine-readable documents such as passports. But would this be sufficient to satisfy the legal threshold? This would also introduce further problems with the need to acquire and store this sensitive data.
So many social networks to choose from.Twin Design/shutterstock.com
Informed consent
One of the chief concerns during the consultation process for the General Data Protection Regulation was the growth of social networking sites such as Facebook and how data protection rules applied to them. In November 2011, the then EU Justice Commissioner Viviane Reding said she was concerned about the growth of digital advertising and the lack of understanding of how it involved harvesting and analysis of personal information. These concerns led to the decision to update the Data Protection Directive to reflect the many changes in how we use the internet since it was passed in 1995.
While the preamble to the General Data Protection Regulation states that young people deserve protection as they may be less aware of risks and their rights in relation to their personal data, this appears to be a paternalistic view adopted by the European Commission.
For example, the Swedish Data Protection Board (similar to the UK Information Commissioner’s Office) conducted a study of 522 participants aged between 15-18 and found that the majority had experienced unkind words written about them, around a quarter were sexually harassed online, and half of those on Facebook had had their account hijacked. But it also found that the young people had a generally good understanding of privacy issues.
On the other hand, a study from Ofcom, the communications watchdog in the UK, found that teenagers couldn’t tell the difference between search results and adverts placed around them, demonstrating that young people’s understanding of how the web works, and the role of their personal data, is not always sufficient – and perhaps insufficient to represent real, informed consent.
Negotiations ultimately allowed member states to opt-out from the requirement to raise the digital age of consent, but issues remain. With an opt-out agreed, member state governments may lower the age to 13, which would cause confusion due to the way the internet functions across borders. Would a 15-year-old in one country find that his use of social media became illegal as he crossed the border into another?
Facebook, which started among US universities, was originally aimed at the over-17s before dropping its minimum age to 13, hugely expanding its number of users. But this move was not without difficulties, and an estimated 7.5m Facebook users are under the minimum age. Facebook founder Mark Zuckerberg wants the 13-year-old minimum removed altogether.
The question is, can such young teenagers or children take responsibility for holding social network accounts? While concerns around protecting teenagers from the potential dangers of social networking are well-intentioned, it seems rather that the genie is out of the bottle. Parental guidance and education is perhaps a better approach than applying the long arm of the law.
Author: Rebecca Wong, Senior Lecturer in Intellectual Property and Cyberlaw, Nottingham Trent University
According to ING, Aussies are taking control of their finances this holiday period, intending to spend $313 on Christmas gifts, significantly less than the US and UK.
The latest ING Special Report on Christmas and New Year found Aussies are cautious about getting caught out overspending during the festive period, with 73 per cent planning to spend less on Christmas this year.
As they focus on managing their festive finances, Aussies anticipate spending just 7 per cent of their monthly income on Christmas gifts, less than half of the 15 per cent US and UK counterparts intend to fork out.
Additional findings:
63 per cent of Australians don’t save money for Christmas and only 29 per cent put money in a separate account to pay for Christmas costs
One in ten (12 per cent) Australians went into debt to pay for Christmas last year, however this is still less than the US (20 per cent) and UK (15 per cent)
14 per cent of Victorians admitted going into debt to pay for Christmas last year, closely followed by people from NSW (13 per cent), while South Australians were the most budget conscious, with less than 8 per cent spending beyond their means last Christmas
John Arnott, Executive Director, Customers, ING DIRECT, says: “Christmas and New Year is primarily about family, friends and fun, but it can become stressful – mainly because of the potential shock to the wallet.
“While some of us can be tempted to stretch finances almost to breaking point for festivities, the great news this year is that more and more of us are planning on keeping a close watch on our wallets, helping to minimise any New Year financial hangover.”
ING Christmas Spending League versus average income
Country
Median spend on Christmas presents (AUD^)
Spend as a percentage of average monthly earnings
Average monthly net earnings (AUD)*
Unsure how much they will spend
United Kingdom
656
15%
4392
42%
Luxembourg
469
9%
4983
45%
Austria
391
11%
3626
38%
France
391
11%
3476
42%
Germany
313
9%
3618
37%
Italy
313
12%
2713
40%
Spain
313
12%
2624
46%
Czech Republic
281
25%
1135
39%
Belgium
234
7%
3490
50%
Romania
172
32%
541
40%
Poland
109
11%
991
50%
Netherlands
63
1%
4367
41%
USA
563
15%
3690
33%
Australia
313
7%
4564***
44%
^ Median spend on Christmas presents converted from Euro to AUD. Currency conversion based on exchange rate as at 18 October 2015
* Source – Eurostat. For the year 2014, average net earnings for countries other than Romania and Australia; converted from Euro to AUD based on exchange rate as at 18 October 2015
** Source – Eurostat. For the year 2013, average net earnings – Romania
***Source – Australian Bureau of Statistics, for the year 2013-14 . Currency conversion – Bloomberg rates 31 December 2014
Potentially trailblazing plans for state-assisted financing of affordable housing are emerging in New South Wales. In what looks to be a landmark policy announcement with possible national ramifications, the NSW government last week outlined the first phase of Premier Mike Baird’s March 2015 election commitment to establish a A$1 billion fund for social and affordable housing.
But for the short-lived GFC housing stimulus, this is the first significant rental housing supply subsidy in Australia since the 2008 National Rental Affordability Scheme (NRAS).
While full details are yet to be disclosed, it appears the Social and Affordable Housing Fund (SAHF) will be something like a “future fund” or endowment scheme. Government will invest a capital sum in revenue-generating assets. The resulting returns will underpin annual payments to approved consortia over 25-year terms.
This ongoing subsidy will help community housing providers bridge the gap between rental revenue and operating costs. Most importantly, it includes repayment of construction debt raised from private financial institutions such as banks and super funds. Perhaps in awareness of research evidence on ways to minimise the cost to taxpayers of private finance for affordable housing, officials acknowledged the possibility of a government guarantee or other credit support on loans to consortia.
In principle this is quite a big deal. The more familiar policymaking style involves one-off or pilot initiatives. The SAHF is presented as an ongoing budget commitment to state-supported social and affordable housing growth, with phases two, three and four of the program signalled at the launch.
Second, as the name implies, SAHF is centred on “social” housing: it has a 70% minimum social housing requirement. Unlike schemes such as the NRAS, most of the homes will be financed to allow rents set at levels manageable for very low-income groups rather than affordable only to moderate-income earners.
In the post-GFC world this is highly unusual. For example, only in Scotland does a significant UK social housing investment program remain intact.
Third, and most important, the fund’s creation reflects a long-overdue official recognition that, left to itself, the market does not and cannot provide decent housing that low-income groups can afford.
Big plans, but starting small
Having promised voters a $1 billion housing fund, the Baird government has announced phase one plans for 3,000 homes – a fraction of what’s needed.AAP/Nikki Short
While potentially important in principle, the SAHF is decidedly modest in practice, at least in its initial phase. The statewide target – implicitly to be achieved over several years – is for just 3,000 homes. This will barely scratch, let alone seriously dent, the backlog of 60,000 applicants marooned on the NSW public housing waiting list.
And that’s before you even consider the tens of thousands of unregistered low-income private tenants pushed into poverty by high rents across the state. In Sydney alone, 94,000 families and single people were in this position in 2011. Many if not most will be additional to those on the public housing list.
Nevertheless, there’s a lot to like in the NSW government’s approach. It puts non-profit community housing providers (CHPs), which have a strong track record of high-quality tenancy management, front and centre. Registered CHPs will manage all SAHF housing.
The scheme offers a long-term (up to 25 years) operating subsidy that can be matched to a private financing deal. This gives private investors like super funds the certainty they need. “We’ve listened and we’ve read the reports on that,” officials said.
And it recognises the cost to social landlords of co-ordinating services for tenants who have support needs: the operating subsidy will include a component for this. The 2010 Henry review of taxation recommended this.
Limits to affordable land must be overcome
Having access to land at an affordable price is fundamental to successful affordable housing strategies. Phase one of the SAHF relies on unlocking land to develop social housing owned by churches, NGOs and other philanthropic sources. This is a finite strategy and we query whether well-located sites for 3,000 dwellings will be forthcoming? What then?
The state government has the two-part answer in its power. First, it must require all medium- and large-scale residential projects to include a reasonable component of affordable housing. For Sydney, we suggest a city-wide target in the region of 15-25%.
There is a once-in-a-generation opportunity right now in Sydney to do this as large-scale redevelopment plans unfold along transport corridors, in precincts and renewal areas. Once developers have bought up that land it will be too late. They need to be able to factor into their feasibility plans the cost of providing the affordable housing, and thereby reduce the price they offer for sites.
Second, state and local government-owned land made available for affordable housing (for example, public housing estates slated for renewal, surplus government sites and air spaces above public sites) must be priced at a level that affordable housing developers can afford to pay to keep their costs (and therefore the government operating subsidy exposure) to a minimum.
Only by linking its financing strategy with favourable pricing of state land offers and planning policy changes will the SAHF be scalable and durable – offering potential to reduce the unacceptably high levels of unmet housing need.
Premier Baird is expected to announce further details of the fund early in the new year. With worsening affordable housing shortages around the country, it must be hoped that the prime minister, his treasurer and his cities minister, as well as premiers and treasurers across Australia, will tune in to learn more on this constructive initiative.
Authors: Hal Pawson, Associate Director – City Futures – Urban Policy and Strategy, City Futures Research Centre, Housing Policy and Practice, UNSW Australia; Vivienne Milliga, Associate Professor – City Futures Research Centre, Housing Policy and Practice, UNSW Australia.
 Here are the top and bottom 10 postcodes in the state.
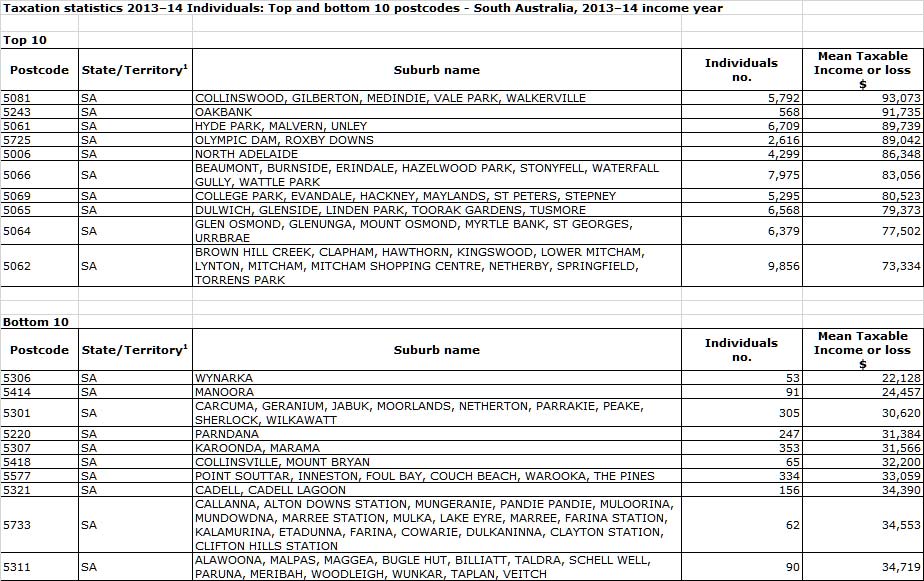

 Here are the top and bottom post codes in WA.
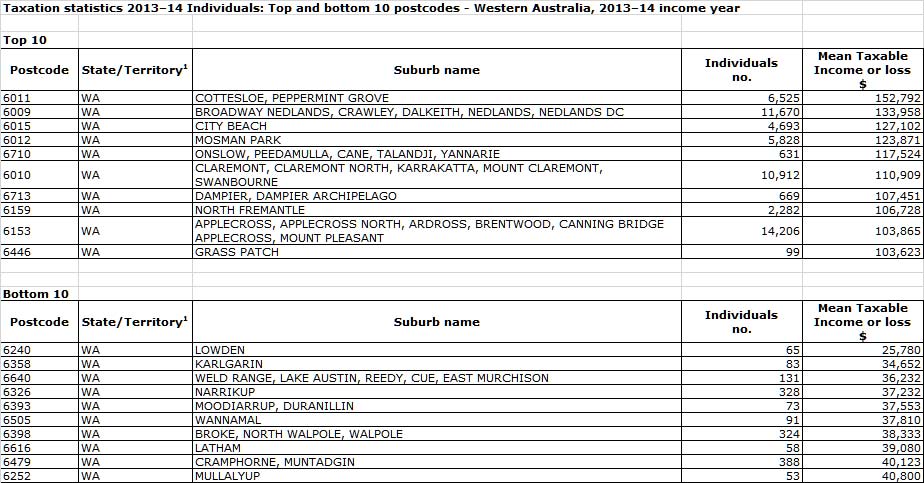
 Here are to top and bottom post codes for the state.
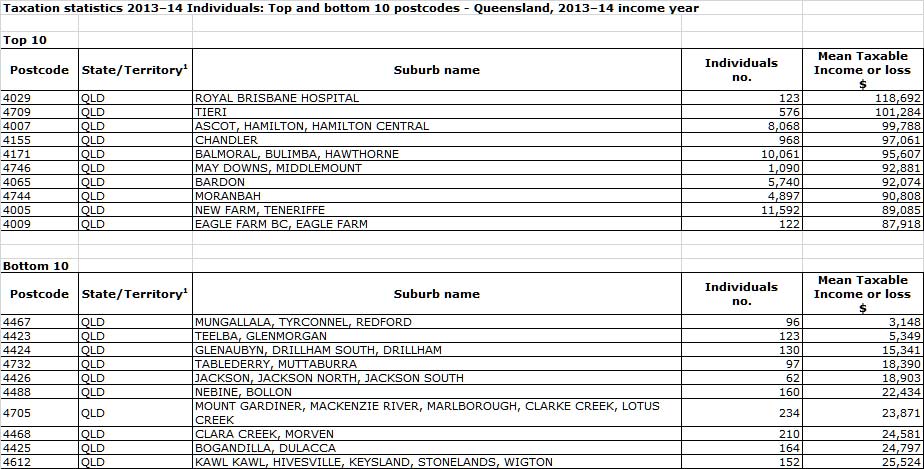
 The top 10 and bottom 10 by post code are as follows:
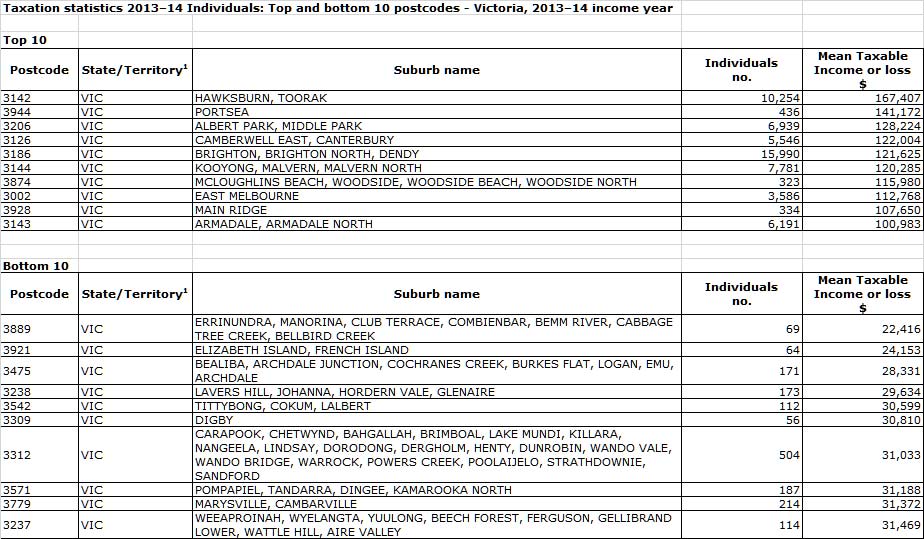
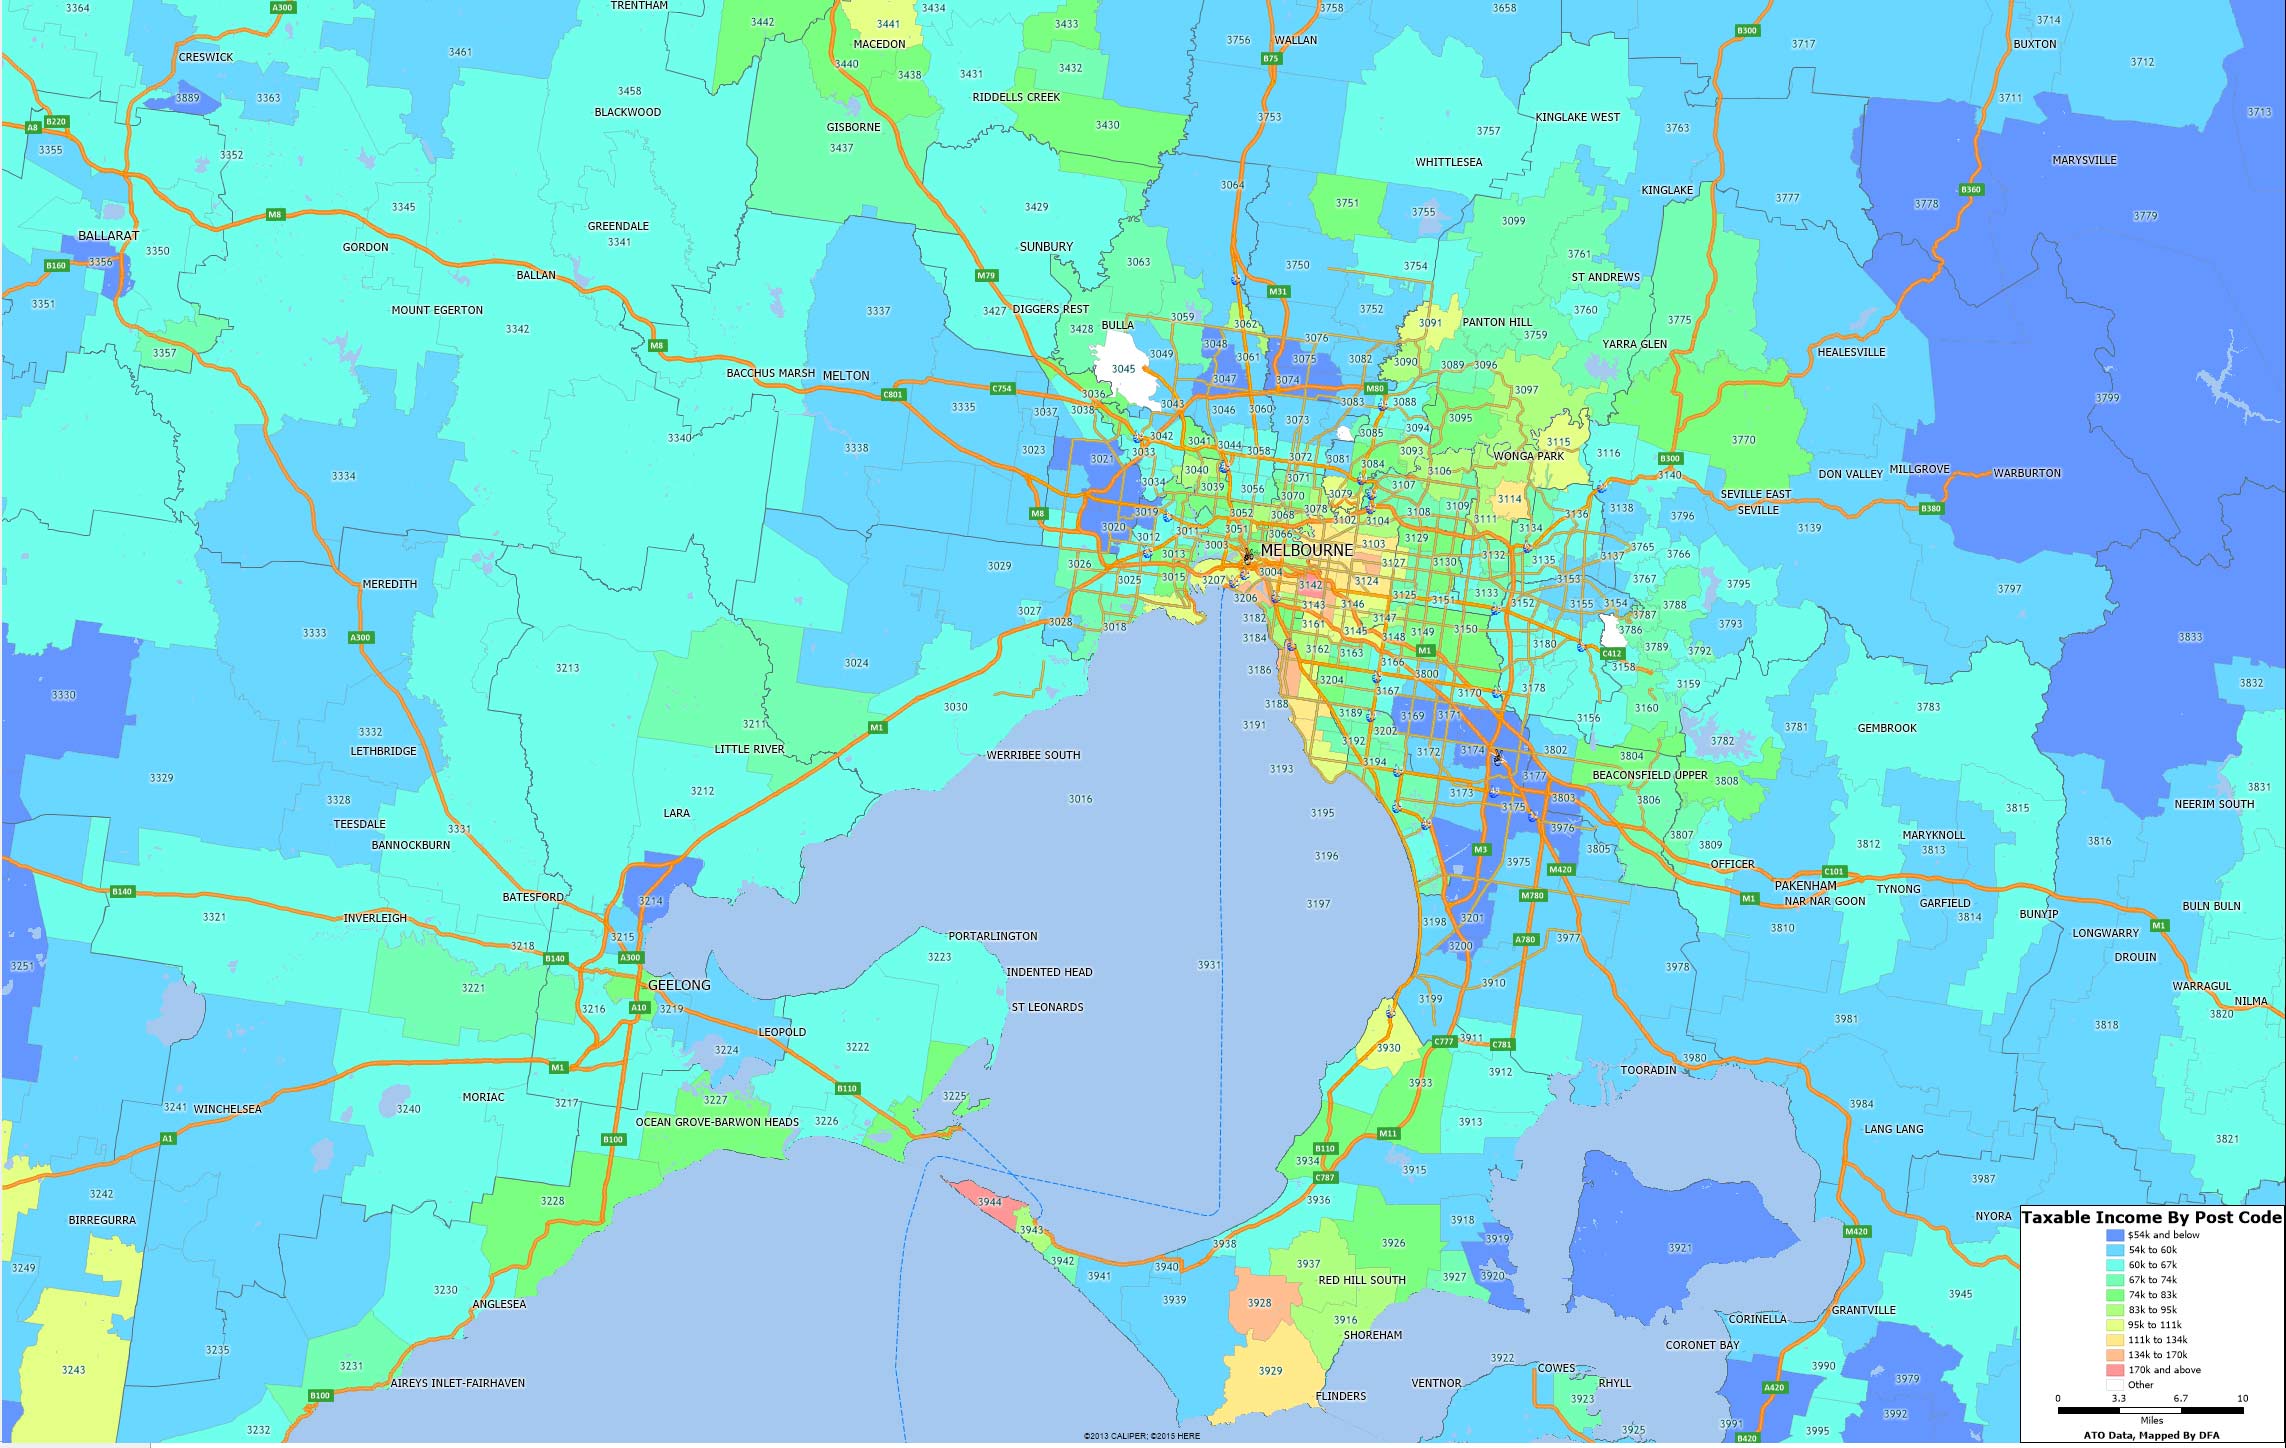
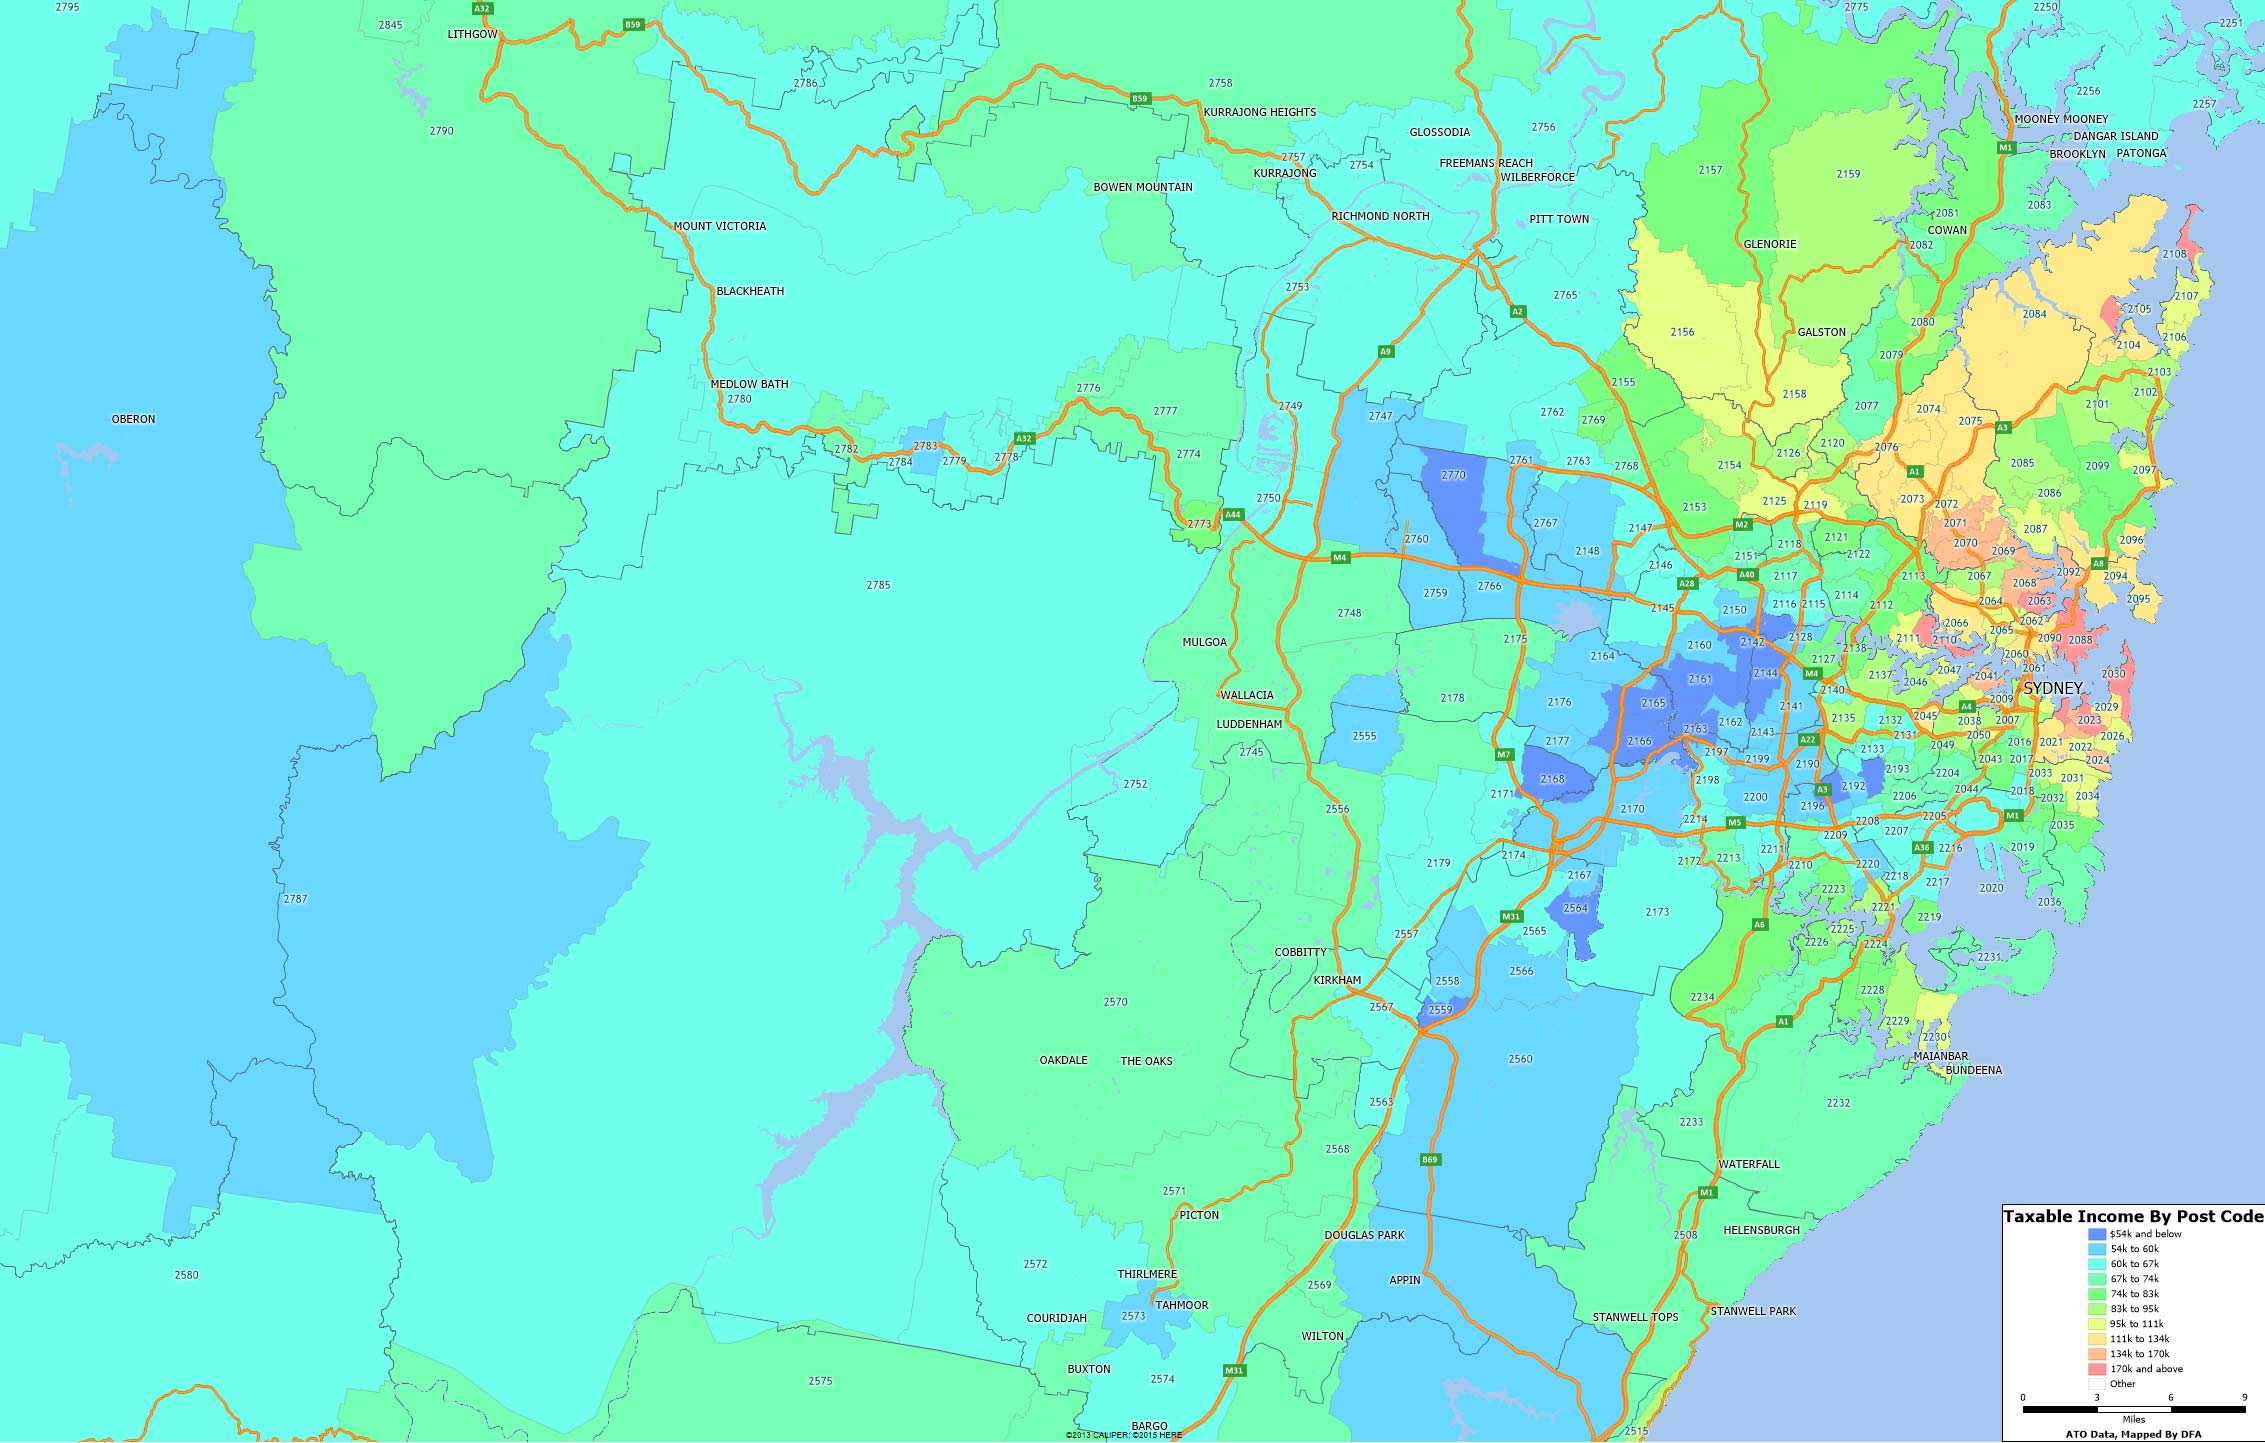 There are significant variations, of course (and this does not take account of those who have used various tax treatments to reduce their true income). The pink/red areas are the highest zones, the blue the lowest.
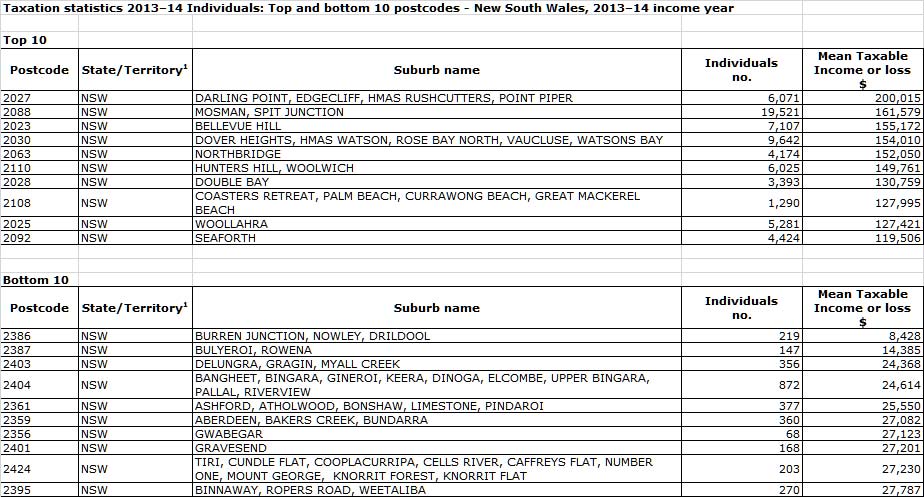 Over the next few days we will cover the other states.

