Research conducted by Tumblr into the ‘Status of Social in 2015’ shows that of the 19m Australian internet users, 67% use a mix of Tumblr, Facebook, LinkedIn, Instagram, YouTube, Pinterest, Twitter, Vimeo and other social media channels.
Around 93% of these use social media more than once a week, while 72% use it daily. Key times of access are wake up (45%) and evening and bed (40/41%). 32% of users accessed social media whilst at work.
The main reason to visit is to find interesting content. 61% of Australians surveyed said they will only engage with content they love or are truly passionate about.
Whilst access methods vary, 70% use a mobile phone, 52% use desktop or laptop and 34% use a table (more than one answer is included).
Max Sebela from Tumblr said
“Our new Social Norms report shows just how much our behaviours are changing online. Australians have moved away from using social media as a way to connect with their loved ones, and are increasingly using these channels as an identity construct. The value placed on individual online personas is higher than it has ever been before, proving that the influential power of social media is only on the rise.
… It’s not just about creating but curating beautiful content that speaks to your personal identity.”
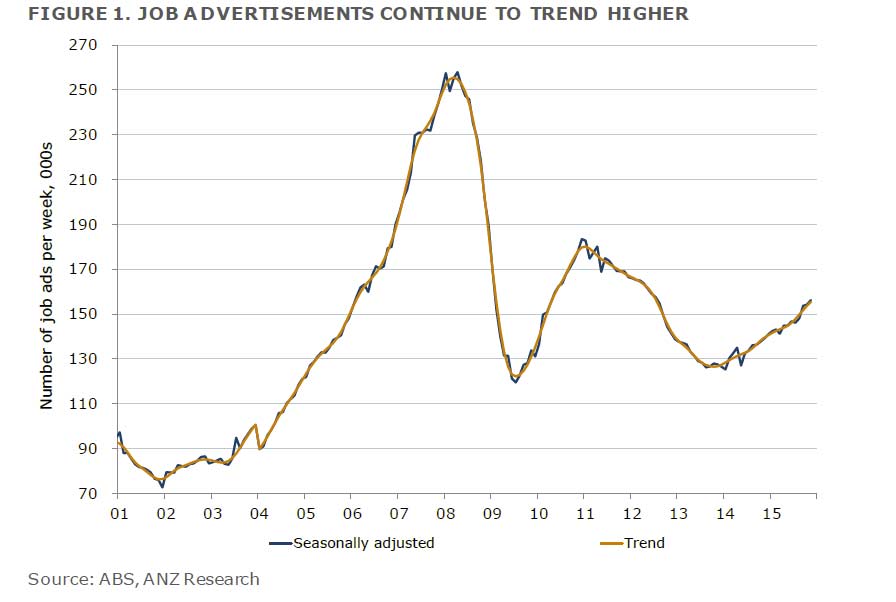
According to the ANZ, Job advertisements rose 1.3% m/m in November, the fourth consecutive monthly increase. They see risks ahead, as the property sector cools and exchange falls slow.
Job ads are now rising 1.1% in trend terms. Over the year, job ads are up 12.3%. The number of internet job ads rose 1.4% m/m and 13.0% y/y in November. The number of newspaper job ads (just 2% of total job ads) fell 4.3% in November, following a rise of 2.7% in October. The trend in newspaper job ads remains structurally downwards.
ANZ Co-head of Australian Economics said:
“Australia’s labour market continues to send positive signals about the current state of the economy.
Overall activity is clearly being supported by labour intensive services industries. This was borne out in last week’s national accounts which showed ongoing subdued activity in a range of goods industries but strong growth across a range of services industries. This has been reflected in hiring and jobs growth. There is also evidence that fiscal restraint by governments has eased overall and public sector hiring has picked up. Overall employment growth has also been supported by relatively weak wages growth.
We expect the unemployment rate to broadly track sideways around 6% until later next year which would be an unsatisfactory outcome in our view. We see jobs growth slowing in 2016 as the boost from strong property market activity and the lower currency begins to wane. There is a risk, however, that job ads are signalling that employment growth could remain relatively strong for some time yet and the unemployment rate could decline a little.”
John*, a widower, is a retired engineer aged in his 90s. He lives alone in the family home and has struggled with loneliness and depression since his wife passed away. He feels frustrated that as he gets older he can no longer do many of the things he used to enjoy, which exacerbates his sense of feeling alone in the world.
Social isolation in old age
In Australia, one-quarter of people aged 65 and above live alone. Some older people, like John, will be vulnerable to social isolation, which occurs when people have limited opportunities for human contact and become disconnected from society.
Not all older people who live alone are socially isolated. And social isolation is certainly not limited to old age. But social isolation in old age is a significant concern. It is linked to a range of health problems and, in extreme cases, can lead to people growing old and dying alone.
There have been public calls to address social isolation. Earlier this year, UK Health Secretary Jeremy Hunt controversially urged people to invite lonely elderly strangers into their homes in an effort to avoid “lonely deaths”. In Australia, many aged care organisations and local councils offer social programs designed to help older people stay connected to others.
But for older people with limited mobility it can be difficult to take part in organised social activities. And not everyone wants to invite strangers into their homes. For these people, social technologies could provide valuable opportunities to stay connected to the world.
Older people and social technologies
Older people are going online at growing rates and social networking is no longer considered the domain of the young. Pew Research Centre found that that more than half of American internet users aged over 65 now use Facebook.
But not all older people feel comfortable using social networking sites. Existing sites, such as Facebook, can be confusing, with too many functions, distractions and extraneous information. Some older people, meanwhile, fear a loss of privacy and malicious intent when communicating online.
Researchers at the University of Melbourne developed a prototype iPad application, Enmesh, to explore how social technologies can be used to help alleviate older people’s experience of social isolation. The app was a simple social networking tool designed to be easy, fun and safe to use. Its simplicity meant it avoided many of the problems that make existing social networking tools difficult or unattractive for older adults.
Enmesh was used to share captioned photographs and messages within a closed group. The photographs then appeared on an interactive display on each person’s iPad screen. This provided a safe and fun space for people to learn how to use the iPad’s touchscreen and camera while also developing new friendships.
John was one of several older adults, mostly aged in their 80s and 90s, who took part in a series of studies to trial Enmesh. During the study, John shared over 100 photographs and messages with other older adults, all strangers to him at the start of the project.
Sharing photographs might seem like a simple and familiar form of communication to those of us who use social media every day. But for John, and others like him, it was a revelation.
Many of John’s captioned photographs provided personal, poignant – and sometimes humorous – descriptions that illustrated how he felt about ageing. Others could relate to his experiences and felt they got to know John through his photographs.
One of the older adults John connected with was Sarah*. She said the project gave her a sense of belonging to a group. She enjoyed sharing and seeing other people’s photographs. They provided “little snippets” that gave her insight into people’s lives. Sarah said:
It’s lovely to have conversations and I don’t have nearly enough, as I rarely go out or have visitors. I love it when one of those things is possible, but in the meantime this is a wonderful way of keeping in touch with folk.
Older adults who are socially isolated may have few opportunities to share information about their day-to-day lives. Photo-sharing with peers provides an important outlet for this communication.
Empowering older people
Technological innovations for older people – such as emergency alarms and devices that monitor activity – are typically designed to compensate for frailty and provide peace of mind for family members.
While these innovations are important, the Enmesh study has shown that technologies can offer powerful social opportunities for older people too.
As consumer technologies continue to advance, there will be more opportunities to enhance older people’s social worlds through technology. Alongside growing innovation, we need to build capacity in the aged care workforce to ensure the aged care industry is mobilised to take advantage of new technologies.
*Names have been changed.
Author: Jenny Waycott, Lecturer in the Department of Computing and Information Systems, University of Melbourne
Within the DFA Small and Medium Business Surveys, we capture significant information about how these businesses use digital, and their attitudes towards the fast-emerging and potentially disruptive “fintech” sector. Since our last full survey released in mid 2014, and still available on request, much has changed. Today we discuss some of the interesting findings on fintech, in the context of SME’s.
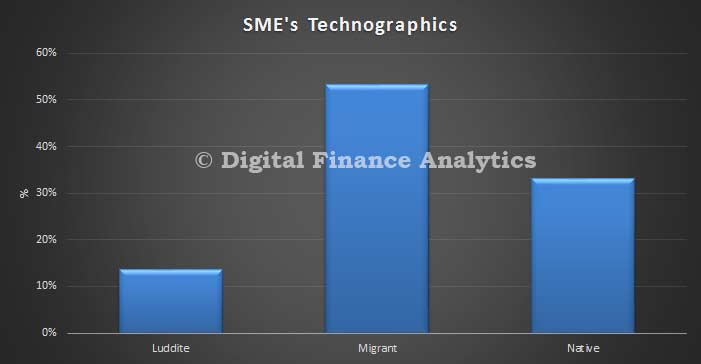
First, looking at how business owners are using digital, (which includes use of smart devices, social media and cloud services) and their preferred channels; the revolution is well underway. We separate business owners into digital luddites (really have not engaged with digital at all), digital migrants (moving to embrace digital, and up the learning curve) and natives (always been digitally at home).
More than half of SME business owners are now migrants, and over 30% natives. This leaves a runt of 12% who are not digitally aware. So, most organisations are well on the way towards digital transformation.
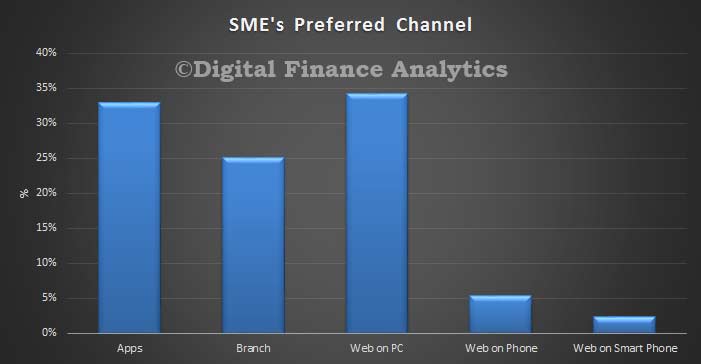
In terms of channel preferences (that’s how they would LIKE to interact, not necessarily how they currently do) the shift to apps and online is stunning. This is not surprising though given the penetration of smart devices, and the fact that many business owners are time-poor. We foreshadowed this in the 2014 report.
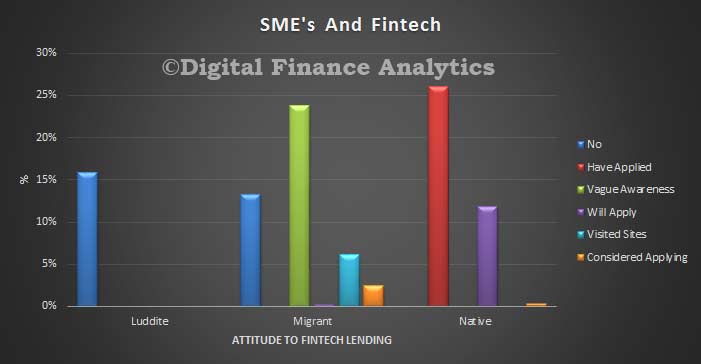
We next ask about their awareness of fintech. Of those who were aware, (a small but growing band), we then ask about their attitude towards fintech, and especially whether they might consider accessing funding or other services from new, non-traditional players. The results are again quite sensational, with many digital natives now past awareness, and considering applying or already have applied. Migrants have more mixed attitudes, but many are now beyond awareness. Luddites are not engaged at all.
So the results highlight the digital transformation underway, and underscores the potential for fintechs to disrupt the market – there are ready customers out there, and as awareness grows, many will seek to embrace. It also begs the question as to how incumbents will respond.
Our next full and updated SME report will be published later so stay tuned.
As is well known, the shortage of affordable separate housing in Sydney and Melbourne means that most first home buyers and renters cannot currently find housing suited to their needs in locations of their choice.
The dominant response from the housing industry and commentators is that governments must unlock the potential for more intensive development of the existing suburbs. From this standpoint, the recent surge in high-rise apartment construction in Sydney and Melbourne is part of the solution.
For those looking at the issue from a financial perspective, escalating housing prices is seen as a reflection of low interest rates, as well as incentives for investors to take advantage of negative gearing and capital gains tax concessions. For the Australian Prudential Regulation Authority, this means the answer is to restrict access to borrowing.
While these factors are important in contributing to the affordability crisis in housing, the issue has deeper roots that lie in the changing demographic make-up of Sydney and Melbourne’s populations.
Our new study on new household and dwelling projections for Sydney and Melbourne from 2012 to 2022, highlights the need for rigorous academic research to inform public urban policy.
To date, policy has been driven by advice from commentators using a flawed evidence base. None have grasped the scale of need for family-friendly housing, or understood the full effects of ageing in place on the availability of detached houses in Sydney and Melbourne.
The projections build on the widely-assumed expectation that Net Overseas Migration (NOM) will continue at 240,000 to 2022 and that Sydney and Melbourne will receive almost of this number.
The household projections assume that the propensity to form households by age group and family type will remain the same as in 2011 in both cities. Projections for dwelling needs were then computed for both cities on the assumption that households will occupy the same type of dwelling (separate house, flat) by family type, age group and migration status in 2022 as was the case in 2011.
On these assumptions, Sydney will need to provide dwellings for an additional 309,000 households and Melbourne an additional 355,000 households over the decade 2012 to 2022.
The key finding is that contrary to most housing industry opinion, the greatest need will be for family friendly dwellings. This is because of the large number of young resident and migrant households who will be entering each city’s housing market. Most of these households are likely to start a family and when they do so, will look for a separate house.
Author providedAuthor provided
It is true that there will be a large increase in the number of single person and couple families over the decade. However, most of this increase will be amongst older, already established households. The evidence indicates that the great majority are ageing in place. (See Table 11 in the report.)
The surge in the number of older households is a consequence of population ageing as successive ten-year cohorts replace smaller cohorts born in earlier years. This ageing effect is having an enormous but largely unrecognised effect on Sydney and Melbourne’s housing markets. It will generate the need for an additional 109,570 extra dwellings in Sydney over the decade to 2022 and 161,990 in Melbourne. In addition, net overseas migration will add a dwelling need of 198,810 in Sydney and 193,140 in Melbourne by 2022.
This combination of high dwelling needs of young residents as well as from NOM, along with the blocking effect of the ageing population, is contributing to a severe and continuing squeeze on the detached housing markets in Sydney and Melbourne. This is particularly marked in the inner and middle suburbs.
The reason is that, by 2011, 50 to 60% of this housing stock was occupied by householders aged 50 (See Table 10 in the report). This situation will get worse as the number of these older households increases.
The study compared the recent pattern of dwelling approvals by housing type in Sydney and Melbourne with the needs implied by the dwelling projections. The conclusion was that there are too few separate houses being approved in both cities and too many apartments, especially in Melbourne.
Current policies of urban renewal or urban consolidation in established suburbs will add little to the supply of affordable family friendly dwellings. This is primarily because of the increase in the price of potential building sites. There is a vicious circle in play as the scarcity outlined above contributes to further increases in the price of separate houses and thus to the cost of possible sites for higher density dwellings.
Implications
Because few families can afford detached housing in the inner and middle suburbs, more are being pushed into the outer suburbs and the fringes of Sydney and Melbourne. It is still possible to find such affordable housing in the outer and fringe suburbs of Melbourne, but not in Sydney. A detached house costs a minimum of $600,000 even in the remotest corners of Sydney. The only affordable option for most of these home seekers is a unit in these outer suburban locations.
There is no short term fix. In the long term more resident and migrant families are likely to seek affordable housing elsewhere, or in the case of migrants, may by-pass Australia altogether. Those who choose to stay will have to make adjustments to their life-style as by delaying starting a family.
On the other hand, a glut of high-rise apartments is inevitable, although it is being masked by the long lead time in the completion of newly approved apartment projects.
Author: Bob Birrell, Researcher , Monash University
Woolworths is set to launch its new loyalty program, Woolworths Rewards, claiming that the new scheme will enable shoppers to redeem cash discounts off their shopping basket, much faster than ever before.
It is estimated shoppers will acquire the necessary points to save $10 automatically of their grocery bill within seven weeks.
Resembling the model used by UK retailer Morrisons, the new Woolworths Rewards program is a smart move for the retailer hoping to claw back some market share and curtail operational costs. However, there is no such thing as a free lunch.
While it will remove the costs of maintaining the Qantas-Woolworths relationship, estimated to be around AUS$80 million a year and allow them to re-invest at least AUS$65 million into stores, it may force shoppers into “brand switching” behaviour.
Interestingly, shoppers will only accrue points toward their $10 savings on selected ticketed items. Hence, the cost of maintaining the program will be met by suppliers who elect to have their brands featured with the big orange ticket. This is simply a way of moving supplier funded promotional allowances into a loyalty program, rather than a direct price discount.
Commentators have often voiced concern about the power of our supermarkets in encouraging us to purchase one brand, over another brand. When faced with the prospect of purchasing Brand A which attracts “Woolworths Dollars” versus Brand B, that doesn’t, it’s most likely shoppers will purchase Brand A. It is expected that shoppers may be critical of being forced into a brand switching situation to attain “Woolworths Dollars”.
Customers tiring of points loyalty programs
The larger issue facing Woolworths and others is there is no exclusivity when every supermarket, department store, dress shop and coffee cart offers you a membership card. As a result, shoppers grown tired of endlessly collecting points to eventually redeem on gifts, discounts or possibly a flight. Studies show that a third of members never redeem points.
Retailers imbedded loyalty programs to encourage repeat shopping, protect themselves from price wars and most importantly collect valuable shopping data. The first retailer in Australia to offer a loyalty program was Fly Buys, a joint venture between Coles Myer (now Wesfarmers) and Loyalty Pacific, 20 years ago.
Then, shoppers were quick to sign up, with the promise of “free” flights in return for their loyalty and of course their valuable personal shopping data, which included brands purchased, location, frequency and demographics.
Back then, the only way retailers could accurately track and target shoppers was through loyalty card usage, and while this still happens today, retailers have other more efficient channels, such as linked credit cards, like Coles Credit Card (Mastercard) and Woolworths Money (Visa).
As shoppers are more frequently “tapping and going”, retailers can now access a wider range of data, outside of simply their loyalty program members. Such programs also allowed retailers to distract shoppers from focusing on price by simply getting shoppers to focus on the ‘prize’ than the price.
Need for speed
Points fatigue occurs when shoppers are faced with months, if not years, of collecting points to ultimately redeem on a desired item or reach that elusive gold or platinum level. Today, shoppers are seeking immediacy and customisation.
Recently, Morrisons moved away from its complex “price match” loyalty scheme to a more simplified program where shoppers now earn five loyalty points for every £1 they spend.
Once a shopper earns 5,000 points they immediately to receive a £5 voucher. Other retailers are also moving away from long-term points accruing programs to deliver instant and non-monetary rewards to shoppers, such as free newspapers or coffee.
The UK’s Waitrose recently re-launched their loyalty program of “pick your own offers”, where shoppers can choose from a list of 1000 relevant products and immediately save 20%. Over time, the list changes, and shoppers get to select new products. The scheme has seen more than 850,000 shoppers sign up.
Non-monetary loyalty
The other problem with existing loyalty programs is that retailers have confused “loyalty” with “rewards”. Loyal shoppers will always consider their favourite brands and stores first and frequent them consistently. True loyalty programs should also strengthen the relationship between the retailer and customer.
UK retailer Marks and Spencer recently moved away from their strictly points-based shopping frequency scheme to reward shoppers for other positive behaviours, such as completing online surveys, writing online reviews or referring friends.
The program of “non-monetary” rewards – such as invitations to exclusive food and drink master-classes or fashion parades – demonstrates shoppers are seeking more than just generic deals and discounts. The program also allows M&S to demonstrate its corporate social responsibility credentials, with shoppers earning “sparks” points for donating unused clothing when purchasing new outfits, termed “shwopping”.
The future: Big brother is watching
What is the future of loyalty? While we see retailers around the world actively move away from long-term, points based schemes to programs that offer immediate gratification and non-monetary rewards, the next frontier will be instant customised offers.
Already, French retailer Carrefour and US retailer Macys have begun using Near Frequency Communications (CFC), which “pushes” targeted offers to their shoppers while they are in-store, or nearby.
It is expected that the opt-in technology would be the natural evolution of loyalty programs, where members receive immediate and customised offers based on where they are standing and what they are looking at within a store.
Author: Gary Mortimer, Senior Lecturer, QUT Business School, Queensland University of Technology
The prosperity that we are enjoying today could largely be attributed to the industrial revolution of the 18th and early 19th centuries. Yet this enhancement of our standard of living has come at a steep price: the creation of the so-called linear economy.
In other words, we have a “take, make and dispose” economy. We take natural resources, make things and dispose of them in landfills and elsewhere.
This business arrangement in which companies operate with blinders on has created vast environmental and social consequences. Mass and conspicuous consumption, the burning of fossil fuels, the creation of dense urban environments and increased ownership of cars not only significantly endanger the natural world but will also erode our quality of life.
This path is simply not sustainable, both for the environment and the way we live.
Fortunately, more of us are reimagining the global economy and how it could function differently. That kind of thinking has resulted in many advanced ideas, such as Leader in Energy and Environmental Design (LEED) certification for “green” buildings, life-cycle sustainability assessment (LCSA) and cradle-to-cradle principles. These ideas aim to extract more value out of existing resources and illustrate how business philosophies are slowly changing.
The thinkers behind these ideas have pioneered a new standard for how the world could be run: the “circular economy.”
But the question we must ask is, can a more sustainable economy also deliver the gains in prosperity we’ve grown used to?
For smartphones and most other gadgets, planned obscelesence is how our economy works.Phone pile via www.shutterstock.com
Problems with our existing model
The central aim of moving toward a circular economy is to improve resource productivity by keeping products and resources in use for as long as possible, through recovery, reuse, repair, remanufacturing and recycling. It is therefore, by and large, recuperative in nature. It is not so much about “doing more with less” but rather doing more with what we already have by solving the problem of low resource utilization.
At the moment, the world’s growth model wastes most of everything. Research in the US and Europe on consumption habits have shown how often the resources we reap from the Earth end up in landfills, little used. Planned obsolescence is how we live.
For instance, in any given year, only 40% of the garbage in Europe is recycled. In Germany, almost one-third of the household appliances consumers disposed of in 2012 were still functioning. Americans tossed out 141 million mobile devices in 2010 (89% went straight to a landfill). In the UK, it is estimated that as many as 125 million phones languish unused (four times the number currently in use). Cars in Europe remain parked 92% of the time, while business offices are used for less than half of working hours.
With this knowledge in hand, the opportunity for new usage efficiency across all industries and consumer lifestyles is right in front of our eyes.
Economy needs to change to survive
Though a circular economy may sound idealistic – if not like a fantasy – the truth is that the existing way of doing things is reaching the end of its utility.
Already, our economic productivity on a global level is being curbed by the rapid depletion of existing and readily available natural capital such as clean sources of potable water and forests. Since the 1970s, productivity gains in grain crops have fallen 66%, despite advances in fertilization and irrigation techniques over the decades. In a recent study by the MacArthur Foundation, it was found that perhaps 85% of Europe’s soil has been degraded.
The study also notes that mining for natural resources such as zinc has become more expensive and the quality has diminished, making it even more energy wasteful.
At the same time, resource consumption is expected to surge. According to the Organization for Economic Co-operation and Development, the global middle class will double by the year 2030. And that means even greater consumption, because we consume more as we earn more, if China’s rise is any guide.
This illustrates that we cannot continue to grow as a species and enjoy a high quality of life without changing the way we do things.
In a circular economy, the aim is to recycle materials as long as possible, if not indefinitely.Recycling bins via www.shutterstock.com
Creating a closed loop
As noted above, our primary goal in moving to a circular economy would be to preserve our way of life by making it sustainable, or technically viable indefinitely.
In a traditional linear economy, a landfill is the final stage of a resource’s life, when we can no longer make use of it. What the circular economy promotes is closed-loop recycling, which aims to reuse waste indefinitely and make new products without changing the inherent properties of the original material.
Rather than the economy or a company’s bottom line only growing from incremental cuts through efficiency gains, this economy seeks more value from existing materials in the current system. For sure, all physical materials eventually degrade. But if we can prolong their use as long as possible, we will gain more in value by extracting much less.
In a nutshell, the circular economy’s goal would be to decouple economic growth from resource consumption, allowing prosperity to continue rising while using less oil, minerals and other spoils of the Earth.
A piecemeal approach isn’t enough
On a small scale, many companies are already working on the problems of resource usage efficiency by developing new technologies, such as those underlying the so-called sharing economy.
Car sharing, for example, may reduce the number of vehicles on the road, or at least limit their growth, while apartment sharing provides a smart means to use our residences more efficiently, by making use of the assets in a more resourceful way. Not only does it reduce the environmental impact of our actions, but it also generates new revenue streams.
Or in a traditional industry such as carpet manufacturing, some companies are looking beyond efficiency gains in operations and supply chains to improve profitability. Dutch carpet specialist Desso, for one, focuses on ensuring all materials used are recycled, reused or remanufactured – and are not toxic.
But solutions within a single industry or company aren’t going to cut it, because this effectively ignores the needs of the overall system. It would be much better if all the players across the value chain from extraction to consumption teamed up to systemically alter the functioning mechanism of how products are produced.
Moreover, if we fix the problem in such a piecemeal way, we risk causing a so-called “rebound effect.” That is, efficiencies gained in one area – by driving less, for example – end up being offset by all those savings being spent consuming more of something else. We spend less on cabs and fuel but use that money to buy more gadgets.
For these reasons, we need the holistic and collaborative approach embodied in the circular economy to maximize the benefits of these new technologies.
A blueprint for fundamental change
The business case for such an economy is obvious: buying less and reusing more – in other words, increasing resource productivity – will reduce costs and efforts while improving efficiency, thus benefiting the bottom line. But the implications of greater resource productivity aren’t merely incremental.
Resource productivity has the potential to fundamentally change the way we produce products and services as well as create more value on both a micro and macro level. As such, the circular economy is a blueprint for claiming long-term sustainability and economic prosperity for companies and countries alike.
Authors: Mark Esposit,Professor of Business & Economics at Grenoble Ecole de Management and Harvard Extension School at Harvard University and Terence Ts, Associate Professor of Finance / Head of Competitiveness Studies at i7 Institute for Innovation and Competitiveness at ESCP Europe
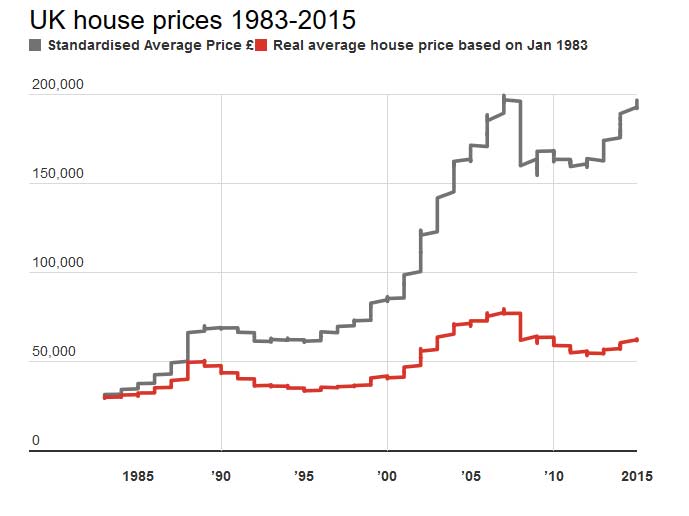
Baby boomers have a greater share of the UK’s wealth than any previous generation in the modern era. And unlike their parents and grandparents, the boomer generation also holds a much higher share of this wealth in housing. Meanwhile, with house prices high relative to their incomes, many younger people and families are are unwilling or unable to accrue wealth through home ownership. Increasingly, 25 to 34-year-olds rent.
This housing wealth inequality between the generations seems unfair. But can we blame the housing wealth of the boomers for preventing younger generations from getting on the property ladder? While baby boomers have generally profited from rising property values, the real reason for the UK’s housing problem is a lack of supply.
Boomer beneficiaries
The boomer generation mostly owned their homes already before the housing boom started around 2001, as shown in the chart below. So they got to enjoy the wild ride in house values with relatively little debt to pay off. Meanwhile, wealth inequality across generations increased during this period.
Younger households either managed to buy when prices were high with the help of large mortgages only to see their house value drop, perhaps, during the subsequent bust that began in 2008. Or, if they hadn’t got on the ladder yet, the falling earnings and rising credit standards of the post-financial crisis years meant they were then unable to climb onto the ladder at all.
Not the boomers’ fault
Now, with house values again rising faster than earnings around London, it is perhaps irritating to some that so many older households sit in underused homes, while younger generations struggle to find affordable housing. The Intergenerational Foundation is particularly upset. But for the most part, this isn’t the boomers’ fault.
The relatively large climb in home values is mostly the result of a restricted supply of housing combined with demand factors that are largely unrelated to the ageing of Britain’s population. While older households have benefited from this confluence, they share only perhaps some indirect blame for it.
House prices rose sharply across England from 1996 to 2005, hugely benefiting the many boomers that had bought their homes during the previous decade. This turn of the millennium boom was the result of rising demand for a limited supply of housing stock. This was in turn fuelled by a number of smaller national trends including relaxed lending standards, increased immigration and, at least initially, widespread growth in household incomes and wealth. Perhaps underneath all this were “exuberant expectations” of continued out-sized capital gains. Changing demographics, a much lower-frequency phenomenon, probably contributed little to the demand-side push on house prices.
Geographic evidence
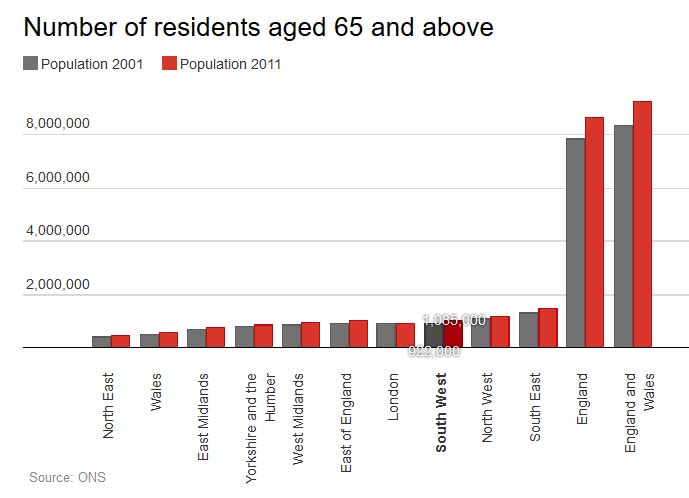
Since the subsequent housing bust, London has claimed the lion’s share of the increase in English house prices. Much of England north of London has seen relatively little – if any – increase in prices since then. This does not match up with where the majority of baby boomers are – they have been ageing in the wrong place to be the cause of this southerly tilt in the housing recovery.
Outside of London, England and Wales are getting older:The young are moving in droves to London. If anything, those grandparents with all their superfluous bedrooms in the villages in the north are the only ones keeping the lights on (and keeping house values from collapsing). Instead, the London-based recovery in house values relies on youth and foreigners. The young want to live in London and foreigners want to invest in it.
All the above factors have been shifting housing demand. If Britain would simply build more houses, prices needn’t have responded so drastically to this rising demand. Of course, the British housing supply problem has long been known.
Moreover, if Britain built more houses, it could build them in the places most needed and with the specifications most demanded. Supply should expand more rapidly in London and the south-east, where demand is highest. Plus, Britain’s ageing population and shifting social norms has created an ever larger demand for housing better suited to the needs of older households. Older households would be far more likely to downsize if this kind of retirement housing were built.
Supply blockers
Of course, older households, who are more likely to vote as well as to own, probably do bear some responsibility politically for blocking supply. Voting homeowners, and disproportionately so older homeowners, tend to disapprove of politicians that approve new building in their neighbourhoods. This has led to brazen political cycles in construction, which perverts the planning process, misallocates housing and raising prices.
Picture a retired couple in their mid-60’s, with children who’ve long since moved out and grandchildren who may just be old enough to visit the odd week during the summer, an empty bedroom or two still furnished with their parents’ childhoods dustily waiting for them. Barring a large change in circumstance, this couple will likely stay in their family home for many years. They know their neighbourhood. The furniture they’ve collected over the years fits just so in their present space. And if they own the average house in England, its value has grown a bit under 4% (in real, inflation adjusted, terms) on average for the last 20 years.
Over the next decade, as the boomer generation slowly ages into its golden years, the UK will have more and more of these households. Given the many risks they face and the relatively few housing choices available to them, clinging on to a house that is too large for their everyday needs is mostly rational.
Besides their pension, a house is far and away the largest store of wealth for those in their 60’s and beyond. Releasing equity by downsizing to a smaller home in a new location may be attractive in theory but there are high transaction and psychological costs in these moves. And, besides, with house prices generally growing again, the returns to be had from staying are too tempting.
Rather than using economic incentives (such as capital gains and stamp taxes) to lever boomers into smaller houses, Britain should look to correct the misaligned political and economic incentives that local councils have to block new housing from being built.
A healthy housing market with the right policies would channel the huge foreign desire to invest in English housing towards building homes for younger (and older) households. House prices would be less buoyant. Retirees with “too much house” would downsize of their own volition, in turn releasing equity for their own consumption and putting a family home back into the market for a new generation to enjoy.
A baby boom is generally considered to be a sustained increase and then decrease in the birth rate. The United States, the UK and other industrialized economies have experienced only one such baby boom since 1900 – the one that occurred after World War II.
In addition, many currently developing economies such as India, Pakistan and Thailand have experienced a baby boom since 1950 as a result of a sustained decline in infant and child mortality rates as a result of improved medicine and sanitation.
So what’s the economic impact of these baby booms? Do demographics play a role in determining when an economy expands and contracts? Do they boost incomes or cause them to fall as more young people enter the workforce? I’ve been studying the impact of baby booms on wages, unemployment, patterns of retirement and gross domestic product (GDP) growth for 20 years and, while there are some questions that haven’t been answered, here’s what we’ve learned so far.
Negative impact on employment
The initial impact of a baby boom is decidedly negative for personal incomes.
Baby booms inevitably lead to changes in the relative size of various age cohorts – that is, a rise in the ratio of younger to older adults – a phenomenon first described by economist Richard Easterlin. (In statistics, a cohort is a group of subjects who have shared a particular event together during a particular time span.)
These effects cause a decline in young males’ income relative to workers in their prime, a higher unemployment rate, a lower labor force participation rate and a lower college wage premium among these younger workers.
This occurs because younger workers are generally poor substitutes for older ones, so the increased supply of youths leads to these negative employment results.
Back in the 1950s, entry-level young males in the US were able to achieve incomes equal to their fathers’ current income. This was because of that age group’s reduced relative size as a result of the low birth rates in the 1930s. But by 1985 – about the time the peak of the baby boom had entered the labor force – that relative income had fallen to 0.3; in other words, entry-level men were earning less than one-third of what their fathers made.
In developing countries, these relative cohort size effects – the reduction in young males’ relative income and increase in their unemployment rate – are multiplied by the impact of increasing modern development, especially the rising level of women’s education.
In addition, the large influx of baby boomers into the labor market in the US forced many older workers, who would otherwise be working in “bridge jobs” prior to retirement, into earlier retirement. This explains how the average age of retirement for men and women went down in the 1980s.
This decline in income relative to their parents and their own material aspirations has a host of repercussions on family life. It leads to reduced or delayed marriage, lower fertility rates and increased female labor force participation rates as young people struggle to respond to their worsened prospects.
From boom to bust … to boom?
The reduction in relative income – which the US experienced in the ‘60s and ’70s – thus results in a subsequent “baby bust” as people delay starting a family.
It was hypothesized that these baby booms might be self-replicating as reduced birth rates on the trailing edge of the boom caused the subsequent cohort to be smaller in size, thus leading to better labor force conditions, increased birth rates and an “echo boom” in the next generation.
This theory was based on what led to the baby boom in the first place, when the favorable labor market conditions experienced in the 1950s emerged as a result of fewer children being born during the 1930s, reducing the young-to-old-adult ratio.
Though the echo boom of the 2000s represented an increase in the absolute number of young adults, it didn’t lift their cohort size relative to their parents because birth rates have remained fairly stable at low rates since the end of the post-WWII baby boom.
That has not, however, translated into significantly better labor conditions, at least not the kind experienced by young adults in the 1950s that led to the baby boom. The reasons for this phenomenon have not yet been explained.
So can changing demographics cause recessions?
Another way of exploring the effects of changes in the proportion of young adults in the population is to look at fluctuations in the relative size of the young adult population over time. These seem to have a significant effect on the economy.
As young adults move out of high school and college and set up their own households, they generate new demands for housing, consumer appliances, cars and all the other goods attendant on starting a new adult life. These new households don’t account for a large share of total expenditures, but they represent a major share of the growth in total consumer expenditures each year.
So what happens if, after a period of growth in this age group, the trend reverses? It is likely that industries counting on further strong growth will be forced to cut back on production, and in turn to cut back on deliveries from suppliers – which will in turn cut back on deliveries from their suppliers, creating a snowball effect throughout the economy.
This picture is supported by the patterns over the past 110 years depicted in the graph shown below.
The graph tracks the three-year moving average of the annual rate of change in the proportion of young adults in the US. The red vertical lines indicate the beginnings of recessions. Data past 2020 are projections.US Census Bureau
The curve on the graph represents a three-year moving average of the annual rate of change in the proportion of young adults in the US population, as given by the United States Census Bureau. “Young adults” are defined as those aged 15-19 prior to 1950, and 20-24 in the years after, given changing levels of education over time. This curve is overlaid with vertical lines that mark the start of recessions, as defined by the National Bureau of Economic Research.
There is a very close correspondence between the vertical lines, and peaks in the curve, as well as points where the curve turns negative. In addition, the deep trough between 1937 and 1958 contained another four recessions, and there were two in the trough between 1910 and 1920 (not marked on the graph). The only recessions over the last 110 years that don’t appear to correspond to features of the curve, are those in 1920, 1926 and 1960.
The pattern of causation – if it is one – cannot run from the economy to demographics, since these are young people born over 15 years before each economic downturn. In addition, there’s a one-year lag in the age groups that has been used to control for possible migration effects of a recession – that is, how many people left the US as a result of worse labor market conditions.
The fact that no “double dip” recession occurred in 2012, even as the share of young people fell that year, might be the result of the economic stimulus applied after the most recent recession.
Food for future thought
Obviously there are many other factors associated with economic downturns, but aspects of the empirical regularity demonstrated here can be seen in many countries over the past 50 years – especially regarding the international financial crises of 1980-82, 1992-94, and 1996-98 and 2007-2008.
This is not to say that demographics were the sole cause of the recessions, but rather that they influenced the timing of such events, given a host of other possible factors. For example, did they play a role in determining when the recent housing bubble burst? That question has yet to be answered, but further study may shine some light.
Author: Diane J Macunovich, Professor of Economics at University of Redlands
The UK’s July budget, regarded by some as an outright attack on the young, prompted some timely discussion on the question of intergenerational justice. Among other things, George Osborne, the chancellor of the exchequer, has abolished housing benefit for under-21s, scrapped maintenance grants for the poorest students, and locked under-25s out of a new living wage.
This final measure was greeted memorably in the House of Commons by the fist-pumping of Iain Duncan Smith, the work and pensions secretary.
At the same time, the latest findings of the Intergenerational Foundation highlighted a starkly widening gap in its fairness index between those under 30 and those over 60. In just the last five years, they report a 10% deterioration in the prospects of younger generations relative to older generations across a range of measures including education, income, housing and health.
Responding to the report, former World Bank economist Lawrence Kotlikoff called intergenerational inequity the moral issue of the day, and accused the UK of engaging in “fiscal, educational, health and environmental child abuse”.
In June, the Centre for Policy Studies issued a report detailing a bleak outlook for Generation Y (those born between around 1980 and 2000), who will have to pick up the tab for apocalyptic levels of national debt incurred by baby-boomer overspending. The report’s author, Michael Johnson, said:
Baby-boomers have become masters at perpetrating intergenerational injustice, by making vast unfunded promises to themselves, notably in respect of pensions. Indeed, such is their scale that if the UK were accounted for as a public company, it would be bust.
The injustice and the urgency of the issue seems obvious, but the want of political will to address this suggests that we still don’t know how to think well about the generation game.
The problem of generations
In 1923, the Hungarian-born sociologist Karl Mannheim wrote an essay called The problem of generations, which points us helpfully to some of the structural and sociological features of the relationships between young and old.
Mannheim carefully observed the tension involved in the continuous process of transitioning from generation to generation, a phenomenon based ultimately on the biological rhythm of birth and death. While former participants in what Mannheim calls the “cultural process” are constantly disappearing in death, new ones are constantly emerging through birth into their own time of life.
This phenomenon creates the responsibility to continually transmit the accumulated cultural heritage to new generations. However, tensions arise as young people appropriate that heritage, but want to interpret the world afresh and shape it differently. Mannheim observes that younger generations tend to be “more dramatically aware of a process of destabilisation and take sides in it” while “the older generation cling to the reorientation that had been the drama of their youth.”
It seems older generations have become much better at clinging on. Only recently, for instance, has 87-year-old Bruce Forsyth retired from his regular prime-time slot on Saturday night television. If there is a generation game, didn’t he do well?
Nice to see you, to see you nice.
Fixing the future against the young
There are powerful establishment narratives that discourage the destabilising political agency of the young, not least a creeping broad-brush rhetoric around “extremist” views and so-called British values. But an especially effective modern mechanism of holding new generations in thrall to the old is to make the young pay a fare for their futures.
The chancellor’s recent policy announcements only advance on the norms of a society that has quickly built the accumulation of enormous personal debt into securing the advantages attained so cheaply by previous generations, such as housing and education. You can have your cultural heritage, only now you’re going to have to pay for it. When older generations can impoverish or indebt young people swiftly and heavily enough for the advantages they are schooled to covet, their behaviours can be better disciplined to preserve the stability of a prevailing culture and pacify the threat of the new.
But Mannheim also shows us that the great virtue of the young is that they make fresh starts possible. Being open to the destabilising effect of new generations “facilitates re-evaluation of our inventory and teaches us both to forget that which is no longer useful and to covet that which has yet to be won.”
The stability that is so prized and clung to by older generations cannot last forever, and our social future requires the kind of radical re-evaluation that only the young can effect. But while figures like the young Scottish National Party MP Mhairi Black may offer a glimmer of hope, too many young people are being offered little more to covet than a living wage and the payment of their debts.
Author: Simon Reader, Research associate at Lancaster University