From The Conversation. The widening cracks in Australia’s housing system can no longer be concealed. The extraordinary recent debate has laid bare both the depth of public concern and the vacuum of coherent policy to promote housing affordability. The community is clamouring for leadership and change.
Especially as it affects our major cities, housing unaffordability is not just a problem for those priced out of a decent place to live. It also damages the efficiency of the entire urban economy as lower paid workers are forced further from jobs, adding to costly traffic congestion and pushing up unemployment.
There have recently been some positive developments at the state level, such as Western Australia’s ten year commitment to supply 20,000 affordable homes for low and moderate income earners. Meanwhile, following South Australia’s lead, Victoria plans to mandate affordable housing targets for developments on public land. And in March the NSW State Premier announced a fund to generate $1bn in affordable housing investment.

But although welcome, these initiatives will not turn the affordability problem around while tax settings continue to support existing homeowners and investors at the expense of first time buyers and renters. Moreover, apart from a brief interruption 2008-2012, the Commonwealth has been steadily winding back its explicit housing role for more than 20 years.
The post of housing minister was deleted in 2013, and just last month Government senators dismissed calls for renewed Commonwealth housing policy leadership recommended by the Senate’s extensive (2013-2015) Affordable Housing Inquiry. This complacency cannot go unchallenged.
Challenging the “best left to the market” mantra
The mantra adopted by Australian governments since the 1980s that housing provision is “best left to the market” will not wash. Government intervention already influences the housing market on a huge scale, especially through tax concessions to existing property owners, such as negative gearing. Unfortunately, these interventions largely contribute to the housing unaffordability problem rather than its solution.
But first we need to define what exactly constitutes the housing affordability challenge. In reality, it’s not a single problem, but several interrelated issues and any strategic housing plan must specifically address each of these.
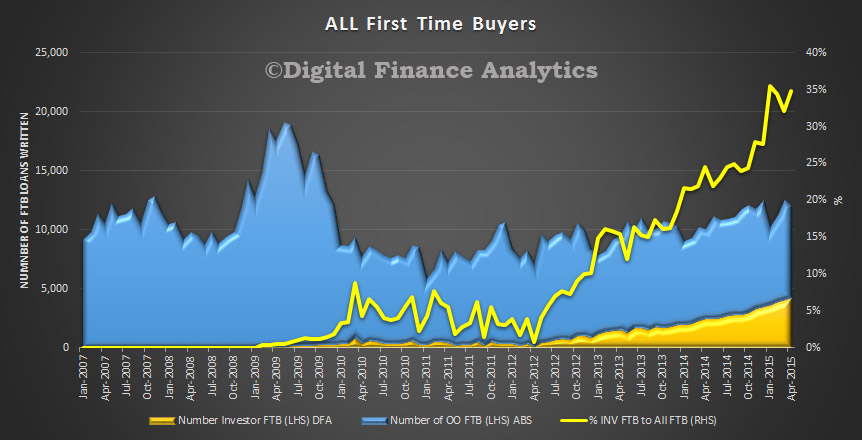
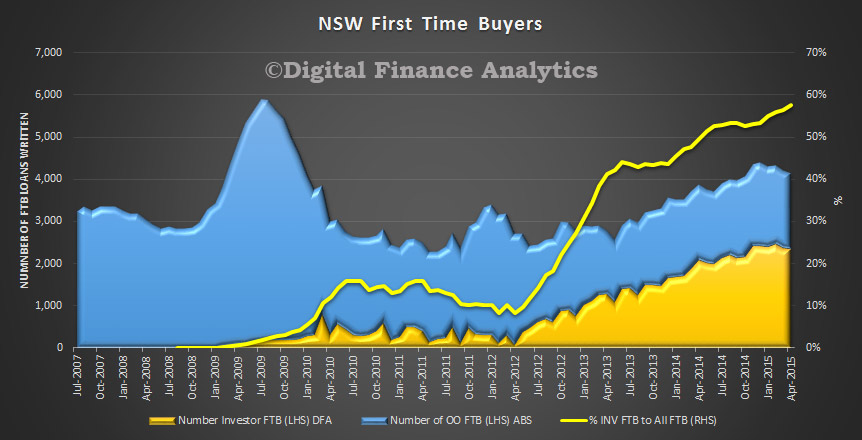
Firstly, there is the problem faced by aspiring first home buyers contending with house prices escalating ahead of income growth in hot urban housing markets. The intensification of this issue is clear from the reduced home ownership rate among young adults from 53% in 1990 to just 34% in 2011 – a decline only minimally offset by the entry of well-off young households into the housing market as first-time investors.
Secondly, there is the problem of unaffordability in the private rental market affecting tenants able to keep arrears at bay only by going without basic essentials, or by tolerating unacceptable conditions such as overcrowding or disrepair. Newly published research shows that, by 2011, more than half of Australia’s low income tenants – nearly 400,000 households – were in this way being pushed into poverty by unaffordable rents.
Thirdly, there is the long-term decline in public housing and the public finance affordability challenge posed by the need to tackle this. In NSW, for example, 30-40% of all public housing is officially sub-standard.
“Why the “build more houses” approach won’t work
A factor underlying all these issues is the long-running tendency of housing construction numbers to lag behind household growth. But while action to maximise supply is unquestionably part of the required strategy, it is a lazy fallacy to claim that the solution is simply to ‘build more homes’.
Even if you could somehow double new construction in (say) 2016, this would expand overall supply of properties being put up for sale in that year only very slightly. More importantly, the growing inequality in the way housing is occupied (more and more second homes and underutilised homes) blunts any potential impact of extra supply in moderating house prices. Re-balancing demand and supply must surely therefore involve countering inefficient housing occupancy by re-tuning tax and social security settings.
Where maximising housing supply can directly ease housing unaffordability is through expanding the stock of affordable rental housing for lower income earners. Not-for-profit community housing providers – the entities best placed to help here – have expanded fast in recent years. But their potential remains constrained by the cost and terms of loan finance and by their ability to secure development sites.
Housing is different to other investment assets
Fundamentally, one of the reasons we’ve ended up in our current predicament is that the prime function of housing has transitioned from “usable facility” to “tradeable commodity and investment asset”. Policies designed to promote home ownership and rental housing provision have morphed into subsidies expanding property asset values.
Along with pro-speculative tax settings, this changed perception about the primary purpose of housing has inflated the entire urban property market. The OECD rates Australia as the fourth or fifth most “over-valued” housing market in the developed world. Property values have become detached from economic fundamentals; a longer term problem exaggerated by the boom of the past three years. As well as pushing prices beyond the reach of first home buyers, this also undermines possible market-based solutions by swelling land values which damage rental yields, undermining the scope for affordable housing. Moreover, this places Australia among those economies which, in OECD-speak, are “most vulnerable to a price correction”.
While moderated property prices could benefit national welfare, no one wants to trigger a price crash. Rather, governments need to face up to the challenge of managing a “soft landing” by phasing out the tax system’s economically and socially unjustifiable market distortions and re-directing housing subsidies to progressive effect.
A 10-point plan for improved housing affordability
Underpinned by a decade’s research on fixing Australia’s housing problems, we therefore propose the following priority actions for Commonwealth, State and Territory governments acting in concert:
- Moderate speculative investment in housing by a phased reduction of existing tax incentives favouring rental investors (concessional treatment of negative gearing and capital gains tax liability)
- Redirect the additional tax receipts accruing from reduced concessions to support provision of affordable rental housing at a range of price points and to offer appropriate incentives for prospective home buyers with limited means.
- By developing structured financing arrangements (such as housing supply bonds backed by a government guarantee), actively engage with the super funds and other institutional players who have shown interest in investing in rental housing
- Replace stamp duty (an inefficient tax on mobility) with a broad-based property value tax (a healthy incentive to fully utilise property assets)
- Expand availability of more affordable hybrid ‘partial ownership’ tenures such as shared equity – to provide ‘another rung on the ladder’
- Implement the Henry Tax Review recommendations on enhancing Rent Assistance to improve affordability for low income tenants especially in the capital city housing markets where rising rents have far outstripped the value of RA payments.
- Reduce urban land price gradients (compounding housing inequity and economic segregation) by improving mass transit infrastructure and encouraging targeted regional development to redirect growth
- Continue to simplify landuse planning processes to facilitate housing supply while retaining scope for community involvement and proper controls on inappropriate development
- Require local authorities to develop local housing needs assessments and equip them with the means to secure mandated affordable housing targets within private housing development projects over a certain size
- Develop a costed and funded plan for existing public housing to see it upgraded to a decent standard and placed on a firm financial footing within 10 years.
While not every interest group would endorse all of our proposals, most are widely supported by policymakers, academics and advocacy communities, as well as throughout the affordable housing industry. As the Senate Inquiry demonstrated beyond doubt, an increasingly dysfunctional housing system is exacting a growing toll on national welfare. This a policy area crying out for responsible bipartisan reform.