The ABS released their data for the managed funds industry to June 2014 today. At 30 June 2014, the managed funds industry had $2,405.3b funds under management, an increase of $46.1b (2%) on the March quarter 2014 figure of $2,359.2b. The main valuation effects that occurred during the June quarter 2014 were as follows: the S&P/ASX 200 was flat; the price of foreign shares, as represented by the MSCI World Index excluding Australia, increased 4.2%; and the A$ appreciated 2.2% against the US$.
 At 30 June 2014, the consolidated assets of managed funds institutions were $1,895.3b, an increase of $31.3b (2%) on the March quarter 2014 figure of $1,864.0b. The asset types that increased were units in trusts, $12.5b (6%); shares, $9.2b (2%); overseas assets, $9.0b (3%); loans and placements, $4.8b (11%); bonds, etc., $3.3b (3%); short term securities, $2.1b (3%); and derivatives, $0.2b (16%). These were partially offset by decreases in other financial assets, $5.0b (12%); deposits, $4.5b (2%); other non-financial assets, $0.3b (2%); and land, buildings and equipment, $0.1b (0%).
Category: Superannuation
Super Balances Now Up To $1.85 trillion – APRA
APRA just published their Quarterly Superannuation Performance data to June 2014. Superannuation assets totalled $1.85 trillion at the end of the June 2014 quarter. Over the 12 months to June 2014 there was a 15.3 per cent increase in total superannuation assets. Over the June 2014 quarter, total superannuation assets increased by 2.6 per cent.
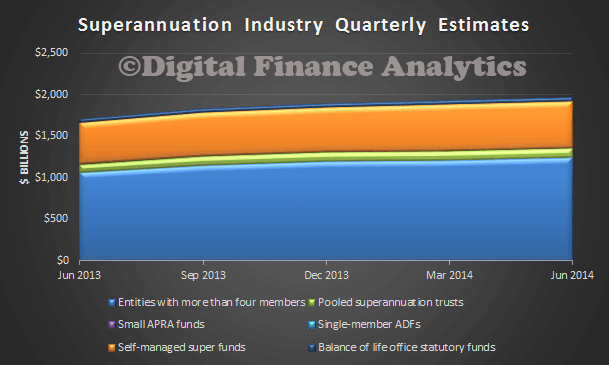 There were $27.6 billion of contributions in the June 2014 quarter, up 5.9 per cent from the June 2013 quarter ($26.1 billion). Total contributions for the year ending June 2014 were $95.0 billion. Outward rollovers exceeded inward rollovers by $531 million in the June quarter. There were $14.7 billion in total benefit payments in the June 2014 quarter, an increase of 8.3 per cent from the June 2013 quarter ($13.6 billion). Total benefit payments for the year ending June 2014 were $55.3 billion. Net contribution flows (contributions plus net rollovers less benefit payments) totalled $12.4 billion in the June 2014 quarter, an increase of 15.1 per cent from the June 2013 quarter ($10.8 billion). Net contribution flows for the year ending June 2014 were $37.3 billion.
The number of entities with assets of more than $50m fell by 3 in the last 12 months, from 213, to 210.
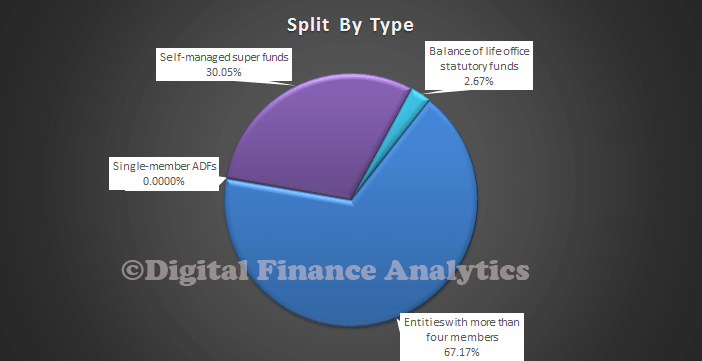
The self managed super fund sector, according to the ATO, accounted for 30.05% of all assets.
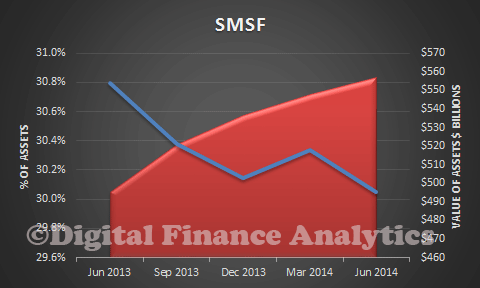
 The value of assets in SMSF continues to grow, standing at $557 billion (the red area), although the absolute percentage has fallen in the past year, from 30.8% to 30.05% (the blue line).
Government To Review Retirement Income Rules
The Treasury today announced a review seeking feedback on the types of products which would be appropriate for people approaching or in retirement with a focus on ensuring they do not out live their savings.
The Government’s superannuation election commitments include reviewing:
- the regulatory barriers restricting the availability of relevant and appropriate income stream products in the Australian market; and
- the minimum payment amounts for account-based pensions, to assess their appropriateness in light of current financial market conditions.
Given their interactions, this discussion paper Review of retirement income stream regulation forms the basis for consultation on both reviews.
In addition, on 14 December 2013, the Government announced it would not proceed with the previous government’s unlegislated measure to facilitate the provision of deferred lifetime annuities and that it would instead consider the proposal as part of the review of the regulatory arrangements for retirement income streams. This paper also provides a basis for consultation on extending concessional tax treatment to deferred lifetime annuities.
The Government welcomes views on this discussion paper, and written submissions will be accepted until 5 September 2014.
We believe there is opportunity to create new products and services, provided they are fairly priced and transparent. In our review of the demand for annuity products in Australia, we found that many were concerned about these issues, and of course the UK just moved from a mandatory annuity structure to allowing retirees complete freedom to save and spend as they please. They had a major mess previously. DFA believes that households should not be forced to take a particular solution, but products correctly structured and priced would be of significant help. We know from our household surveys that many are not saving sufficient to support their expected life in retirement. Indeed many had no clear expectation of how long they might live, and what they might need to have invested.
The incredible morphing FOFA beast
I wrote a piece, published today for the ABC News – The Drum, arguing that far from reducing the cost of financial advice and improving access, the PUP-approved FOFA changes will favour the big banks and allow planners to provide poor advice. It was based on my earlier and more details post published here, but updated to take account of latest developments.
ASIC Warns On Super And Managed Investment Fees
ASIC today released a report into fee disclosure practices for super and managed investments. The intention of the fee and cost disclosure requirements is to promote comparability of products. However, ASIC’s review of industry practices indicates that there is significant variation in the disclosure of fees and costs. A key driver of this variation is the frequent complexity of the operational and investment structures of funds. In addition, data quality and differences in the interpretation of the fee and cost disclosure requirements can also lead to variations in disclosed fees. As a result, DFA’s take on the report is that investors need to be very careful when comparing products. ASIC makes a number of significant observations. Remember this is a $2,338.8bn industry, and fees have a profound impact on the overall returns from an investment.
- The reporting of fees and costs in underlying investment vehicles has been an area of significant concern. The fees and costs that are generally disclosed in a fund-of-funds arrangement are the fees and costs of the fund-of-funds manager, and not the fees and costs associated with the underlying funds. As a result, fees and costs may be understated by as much as 0.20%–0.40% annually.
- The disclosure of indirect costs provides investors with a more accurate representation of the overall fee burden associated with each product and allows for increased comparability across funds.
- Whilst difficult, APRA expects trustees to make all reasonable efforts to obtain information about their investments beyond the first non-connected entity.
- The disclosure of management costs is an area of significant concern for ASIC. Anecdotally, it has been alleged that there are instances of costs being manipulated to present investors with a product that appears to be more financially attractive than it really is.
- These disclosure practices can be fundamentally misleading because they reduce the amount disclosed as management costs and do not accurately portray the cost of individual products. They also prevent investors from being able to accurately compare superannuation or managed investment products against each other.
- There is also a lack of clarity in the industry regarding how future performance fees should be determined and disclosed. Currently, a number of alternative methods are used to determine future performance fees, and this can result in significantly different projections across superannuation funds. One common practice is for superannuation funds to disclose the previous year’s performance fees as a reflection of what will occur in the current year. ASIC considers the adoption of this practice may lead to misleading results because it implies that past performance fees are indicative of future performance fees.
- Inconsistency in the disclosure of fees in relation to the treatment of tax undermines the purpose of the Stronger Super reforms because it prevents investors from accurately and confidently comparing fee structures between superannuation funds.
- The disclosure of fees net of income tax assumes that all investors receiving the PDS will be entitled to a share of the reduction in income tax resulting from the costs that the fees pay for. However, only investors who have received taxable income during the year into their superannuation account—such as positive investment returns or taxable contributions (e.g. employer contributions)—are entitled to a reduction in income tax. ASIC considers the disclosure of fees net of income tax to be misleading to investors who are not entitled to a reduction in income tax.
- ASIC encourages industry to develop industry standards for good practice in fee and cost disclosure for superannuation funds and managed investment products.
We discussed the questions of fees in the light of FOFA recently. The ASIC report provides further evidence that improvements need to be made.
Why FOFA Matters So Much
Last week, the Future of Financial Advice regulations were tabled in Parliament, following the recently published Senate review. As currently incarnated they have the potential to drive a coach and horses through the original intentions of the FOFA reforms. Today we explore why this is so, and highlight some of the consequences for both the managed funds industry and investors.
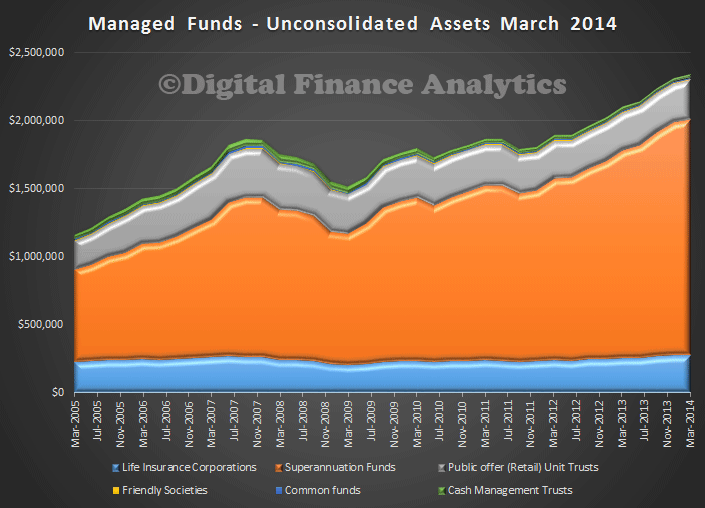
First, we need to remember that according to the ABS, as at 31 March 2014, the managed funds industry had $2,338.8bn funds under management, an increase of $31.3bn (1%) on the December quarter 2013 figure of $2,307.5bn. This is the marked to market value of the overall portfolio, helped by the facts that S&P/ASX 200 increased 0.8%; the price of foreign shares, as represented by the MSCI World Index excluding Australia, increased 0.6% and the A$ appreciated 3.1% against the US$. Here is the trend chart from the ABS series.
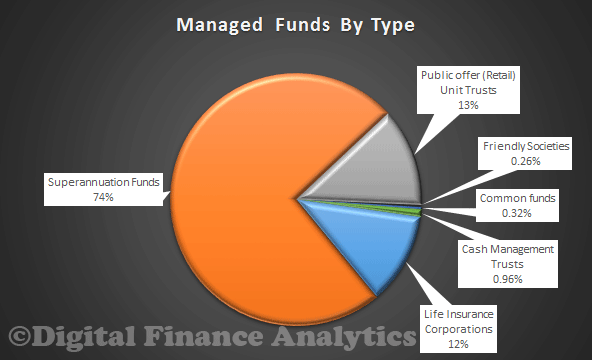
 Looking at the splits by type, superannuation is the largest contributing element, with 74% of the total, or $1.706.1bn. This is not surprising seeing as we have a forced savings scheme for households.
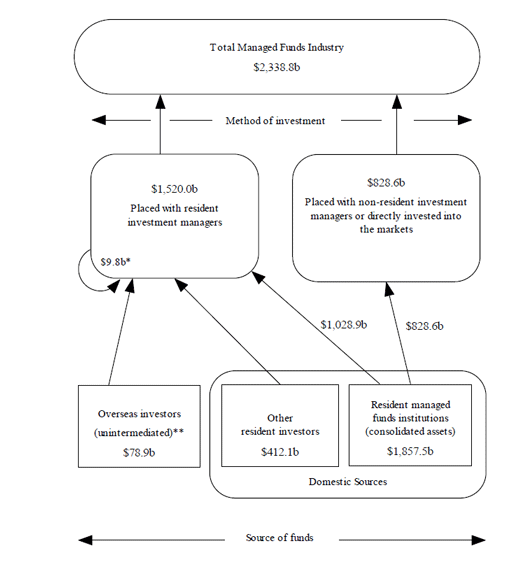
 The ABS also show the industry flows in their report. Local Investment Managers have $1,520 bn invested, whilst $828.6 bn are invested with managers overseas, or directly into the market.
 There has been considerable consolidation in the managed funds industry, looking at the managers themselves, the financial planners, and the wealth management platforms. The big banks are estimated to have about 80% of the financial planners, and are behind the bulk of the wealth management platforms and fund managers. This significant industry concentration is bad for competition, households and savers. We discussed this at length in our earlier series on superannuation. This is part of a wider consolidation within financial services, and should not have been allowed to happen, because such value chain consolidation allows a small number of players to control the industry, reduce competition and keep fees high. We recently covered the question of wealth management fees, those in Australia are significantly higher than elsewhere, despite the higher savings per capita. There have also been reports of poor or fraudulent advice to investors, where advisors recommended their own solutions, even if they were not the best for the investor concerned. Of course the original FOFA proposals was a response to this. We covered the history of FOFA up to the recent Senate Inquiry here.
So, now lets look at the latest regulated changes. On 30 June 2014, the Government registered the Corporations Amendment (Streamlining Future of Financial Advice) Regulation 2014. These changes to the FoFA laws were effective from 1 July 2014, and note they are yet to be tested in the Senate, maybe the regulatory amendment approach was seen as a way to avoid scrutiny. The changes are
- to remove the Opt-In requirement;
- to require Fee Disclosure Statements (FDS) to apply prospectively – for new clients from 1 July 2013 only;
- to remove the requirement to satisfy section 961B(2)(g) (the ‘catch-all’ provision) from the best interests duty;
- to allow for scaled advice;
- to amend the grandfathering regulations in order to remove the current restrictions on trade for financial planners who may change employers/licensees, and enable fair market competition for financial planners selling their business;
- to ban commissions on investment and superannuation products, and eliminate the possibility of a re-introduction of these commissions through the previously proposed general advice exemption.
The Governments position is that financial planners will continue to provide advice in the best interests of their clients, without the catch-all provision, and that as commissions have been banned for providing general advice, (despite the fact that advisors may receive other remuneration options and bonuses), they will not be conflicted. Therefore, the changes will reduce the costs of advice, and provide greater access to potential investors.
We are not convinced. In fact, we think that the latest adjustments will lead to confusion in the industry, enable the large banks to continue their consolidation and control of the industry, and will lead to investors potentially being given poor advice.
First, it will be easy to get round the ban of commissions. The original FOFA would have outlawed financial planners working in the banks to receive any reward for suggesting their own products. In addition, any fees or commissions would have had to be disclosed. Now, planners can provide general product advice, and get rewarded. In addtion, bank tellers, and other bank employees are now able to receive bonuses for selling products under general advice, provided they have an appropriate “target” and it is not called a commission. This creates a conflict.
Second, the original FOFA did not really separate specific advice (where a planner takes the history and needs of a client, to work out what their best investment strategy might be) and general product advice, or splitting advice from product sales. Product sales were overlaid with considerable obligations and requirements, more befitting advisors. In addition, people selling products could not be rewarded for achieving sales (as happens in most sales environments). What should have happened was a clear distinction between sales and advice, with sales able to be remunerated, but advisors not. Advisors would never sell products, so could not be conflicted.
The proposed changes which the Senate Inquiry considered were to allow planners to receive a proportion of their income from product sales, with the caveat that it should be in the best interests of the client. However, now in the regulated clauses, this best interest element has gone missing. Because the best interest clause has been removed, financial planners are now able to point potential investors to their own bank products, provided they meet their savings requirements, even if they are not the best products. So, a planner has no obligation to point to the best product in the market, even if that is with a competitor.
So, the amendments as currently in the regulations, work in favour of the big banks, means that planners can remain conflicted, tellers can sell products, and the potential to release real competitive tension into the market as products would have be compared cross market (with an bias towards cheaper?) are all gone.
We can only hope the new Senate will have the chance to review and change the regulations. The really interesting question, is whether the latest round of changes reflect a poor understanding of how the wealth management industry works, or whether the big banks, protecting their own highly profitable enterprises have lobbied successfully. Remember wealth management fees in Australia are three times higher than they should be!
The Superannuation Story, part 1
In our first post for the new year, we begin a multi-part examination of superannuation, using the recently released data from APRA on industry and fund level performance to June 2013, together with DFA’s own research. Superannuation has become big business, with total assets now worth over $1.62 trillion (compare this with the $5 trillion in residential property in Australia). Last year it grew by 15,7%, or $219.8 billion. So it is important to understand the industry, how funds are performing, and to discover if there are important segmented differences. Note that this excludes the self-managed superannuation sector, which is controlled by the ATO, and runs on a different reporting cycle; and very small funds. These funds rose by 15.5% to be worth $506 billion, representing. SMSFs constitute 31% of the total. We will come back to these later, but today we look at the bigger funds.
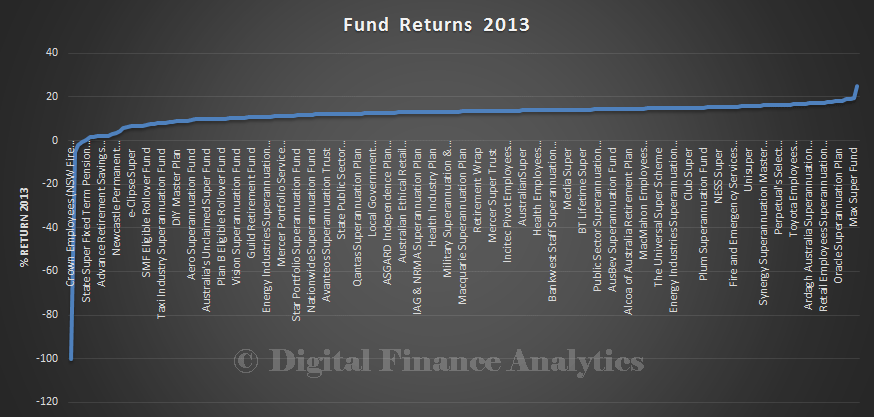
To start the analysis, lets look at overall returns across the funds. The average performance to June 2013 was 13.7% in the last 12 months. This is the best result since the GFC in 2007, and ahead of the long term average of around 6%. But this average masks important differences, as shown on the chart below, which is a simple plot of returns ranked from lowest, to highest. This is data from nearly 300 funds, so not all the individual funds are labelled, it is the range of performance, from negative performance, through to over 20% which is interesting. It does make a difference as to which funds your money is in!
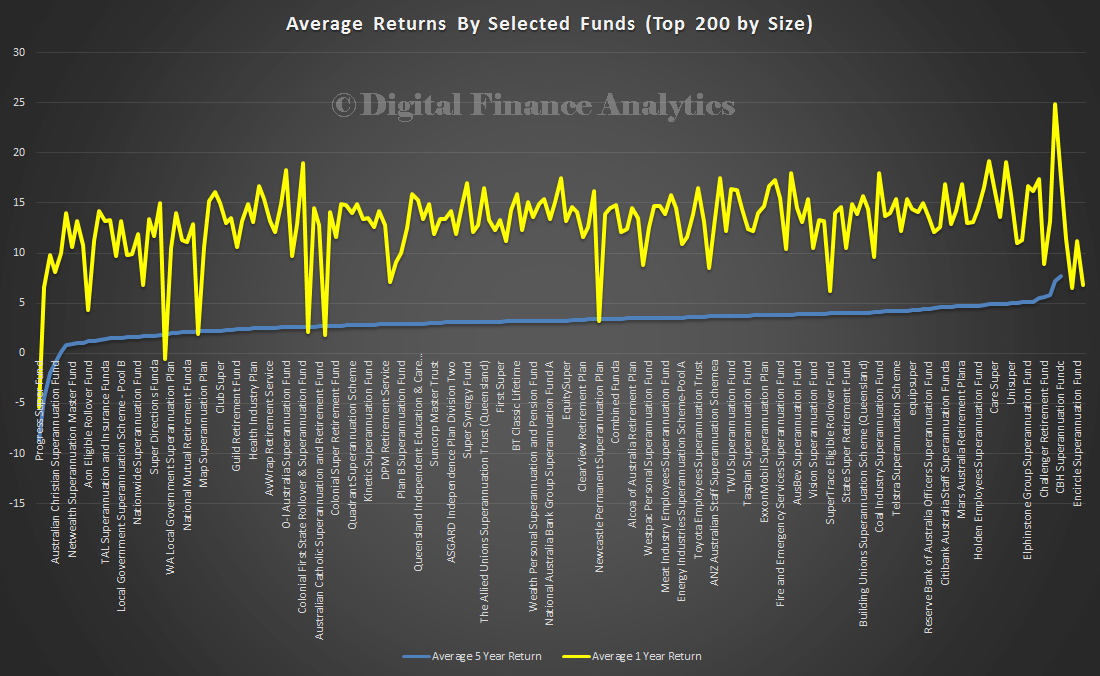
 We did more detailed analysis of the top 200 funds. Here we show the 1-year data, and the smoother 5-year data by fund, stack ranked from lowest to highest. Again, not all funds are labelled. We see some funds performing much better than others, and some loosing over the 5-year view.
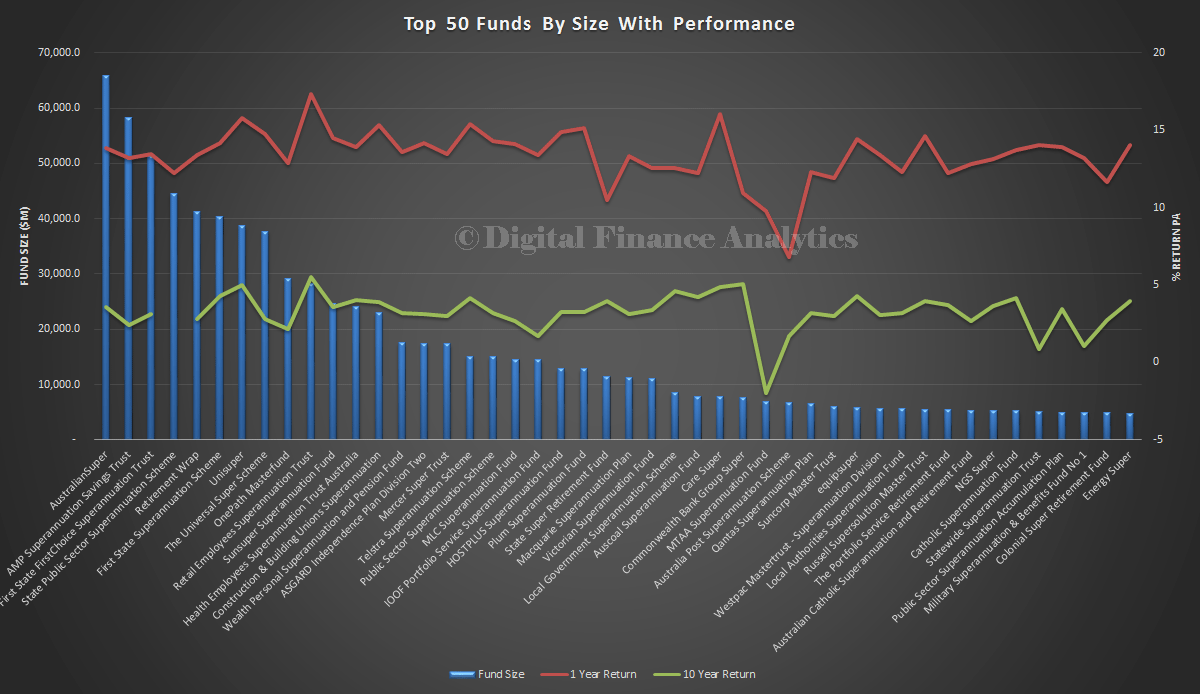
 If we take the top 50 funds by size, and plot the performance, we see that size does not seem to matter when it comes to performance. We have included 10-year performance data, though there are some gaps as not all funds are that old. Performance is quite often not sustained across the three time horizons as some funds appear to find it hard to maintain enduring good performance.
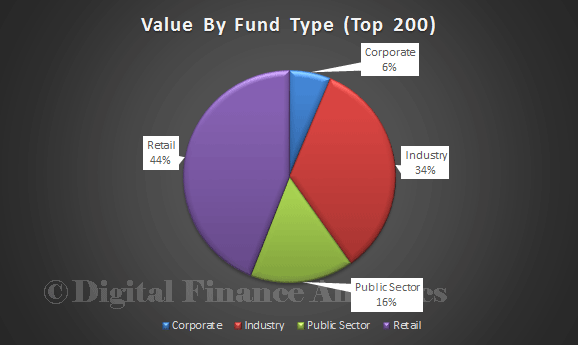
Funds are categorised by APRA into Industry Funds, Retail Funds, Public Sector Funds and Corporate Funds. The largest by value are Retail Funds (44%), then Industry Funds (34%).
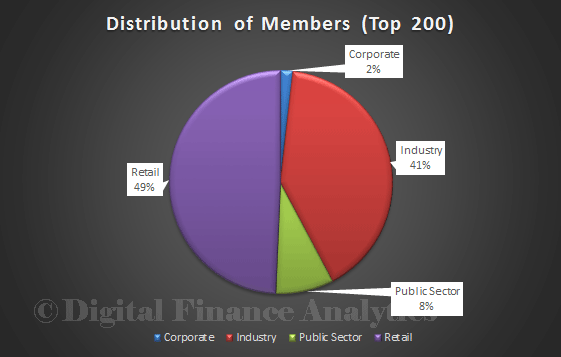
 Membership is also spread across the fund types, with 49% in Retail Funds, and 41% in Industry funds.
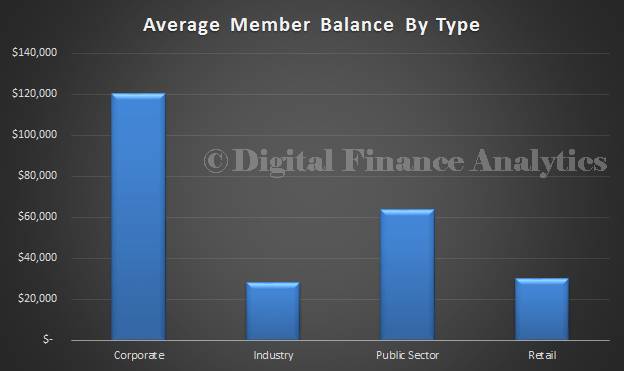
 The average member balance varies by fund type. The average member in an Industry fund has the lowest balance ($27,173) compared with Retail ($30,161), Corporate ($120,273) and the Public Sector ($63,889).
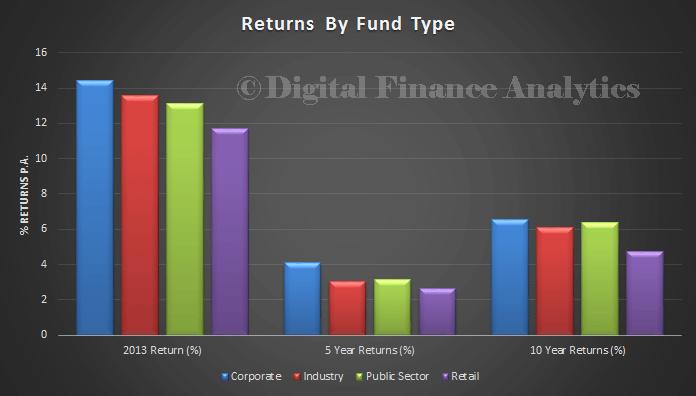
 The final picture today, is the relative performance by fund type. Retail funds, whether you look at 1 year, 5 years or 10 years, are under performing. Reasons will include the need for the entity to make returns to shareholders, commissions paid to advisors, different fee structures, and innate process inefficiency.
 One last piece of data, there are over 28 million fund members, which means that many people will hold more than one superannuation account. We will come back to the significance of this later.
So, to conclude, we see that Industry funds perform better, that the size of the fund is not correlated to performance in the short or long term, and that there are wider variations in performance across funds, and funds types. All this leads to considerable complexity when individuals are thinking about their superannuation, and later we will use data from our surveys to compare and contrast. But its clear that not all Superannuation Funds are the same, caveat emptor (let the Buyer beware)!

