CBA released their IH19 results today and reported a statutory net profit after tax (NPAT) including discontinued operations of $4,599 million, down 6.3% on 1H18, but 4% up on 2H18. We see signs of stress in higher consumer loan defaults and margin pressure despite higher capital ratios. Its going to interesting to see how the other banks perform – generally CBA does better than some of its peers. They reported a drop in mortgage borrowing power of more than 15% compared with 2015, thanks to tighter standards.
Cash NPAT from continuing operations was $4,676 million, up 1.7% on IH18.
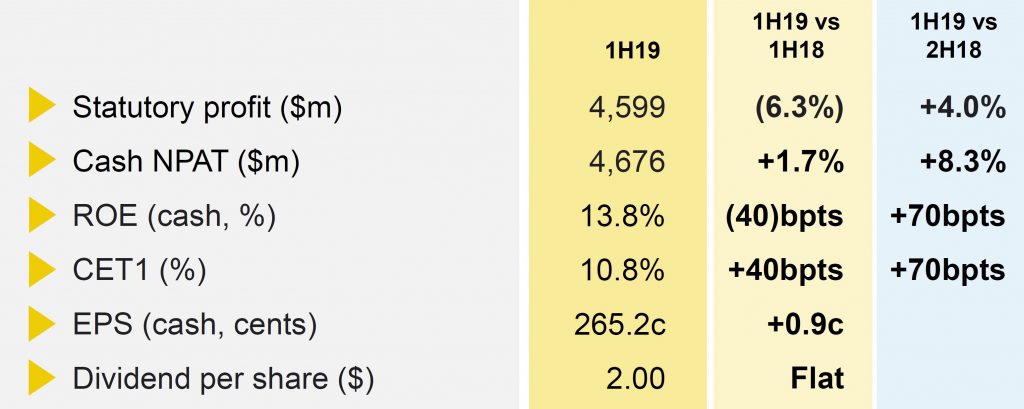
ROE was 13.8% (continuous operations), was down 40 basis points on prior comparative period (pcp).
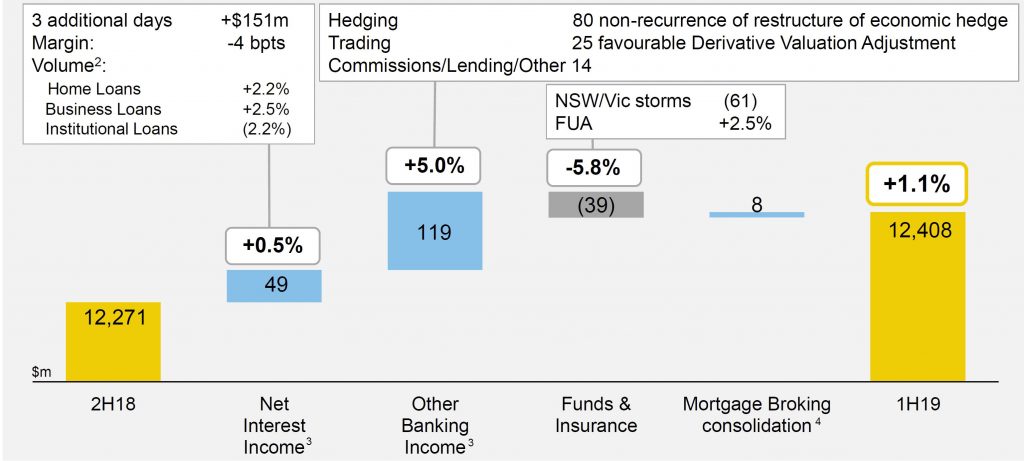
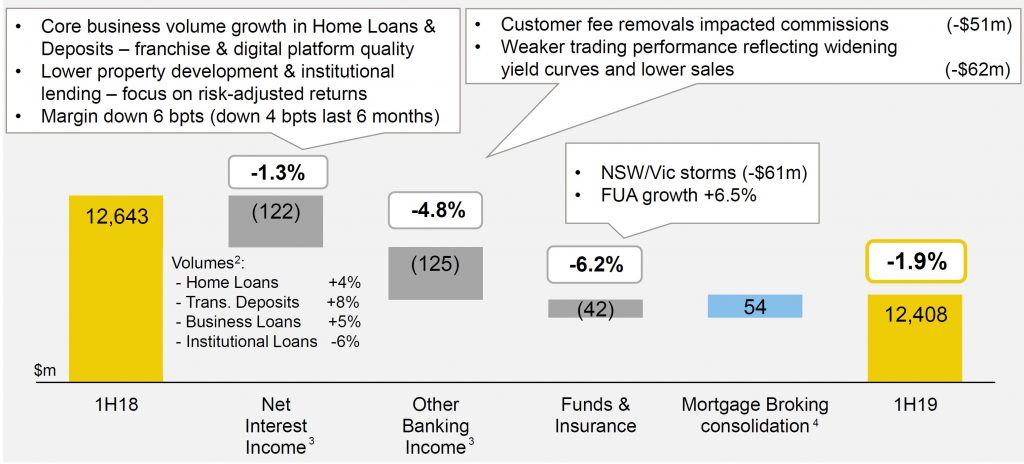
Operating income of $12,408 million, down 1.9%, with volume growth offset by lower net interest margin, lower Markets and fee income, and the impact of weather events.
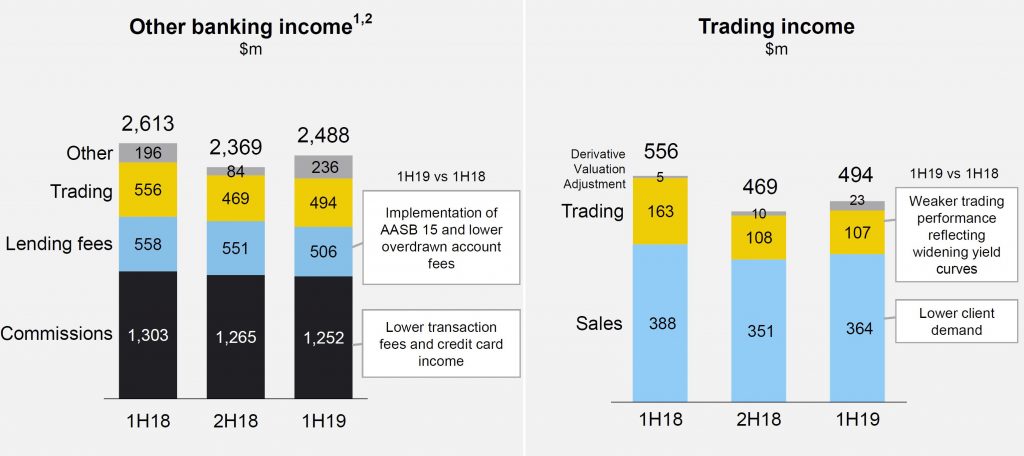
Trading income dropped from $556 million 1H18 to $494 million 1H19.
Expenses were down 4.5%, helped by one offs.
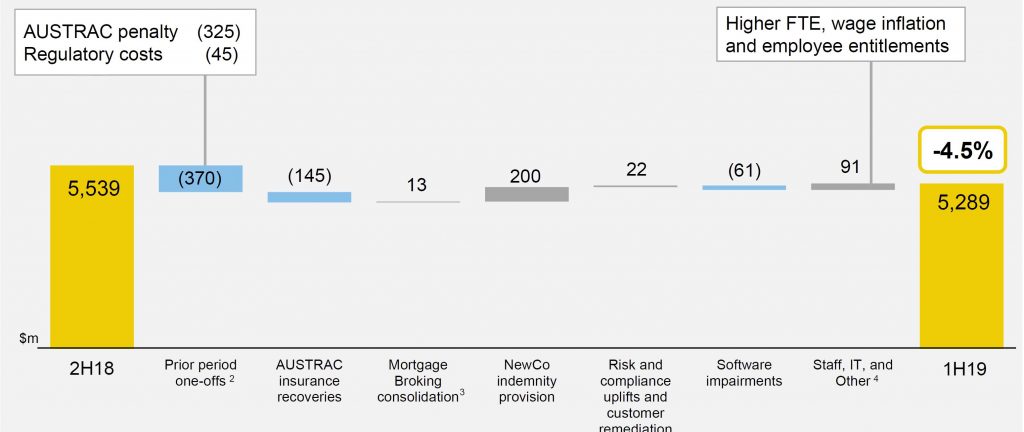
The cost to income ratio was 42.6%, down 60 basis points on pcp.
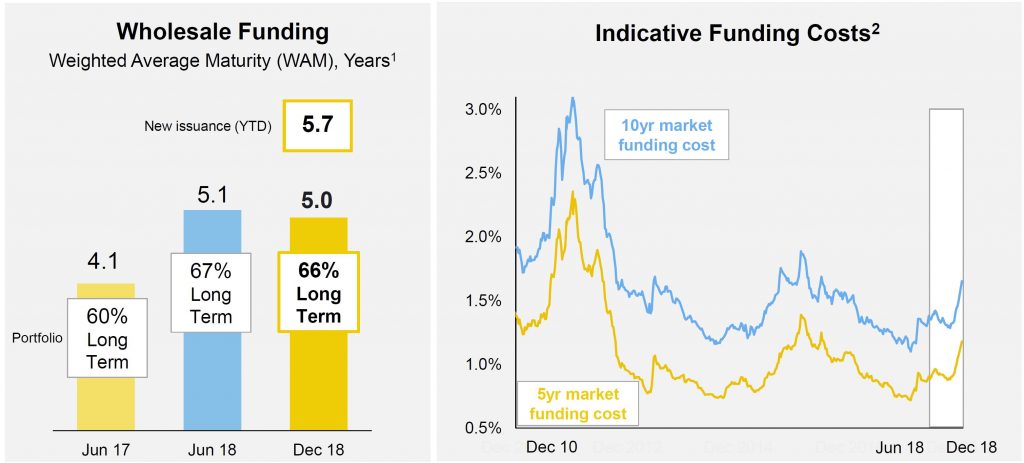
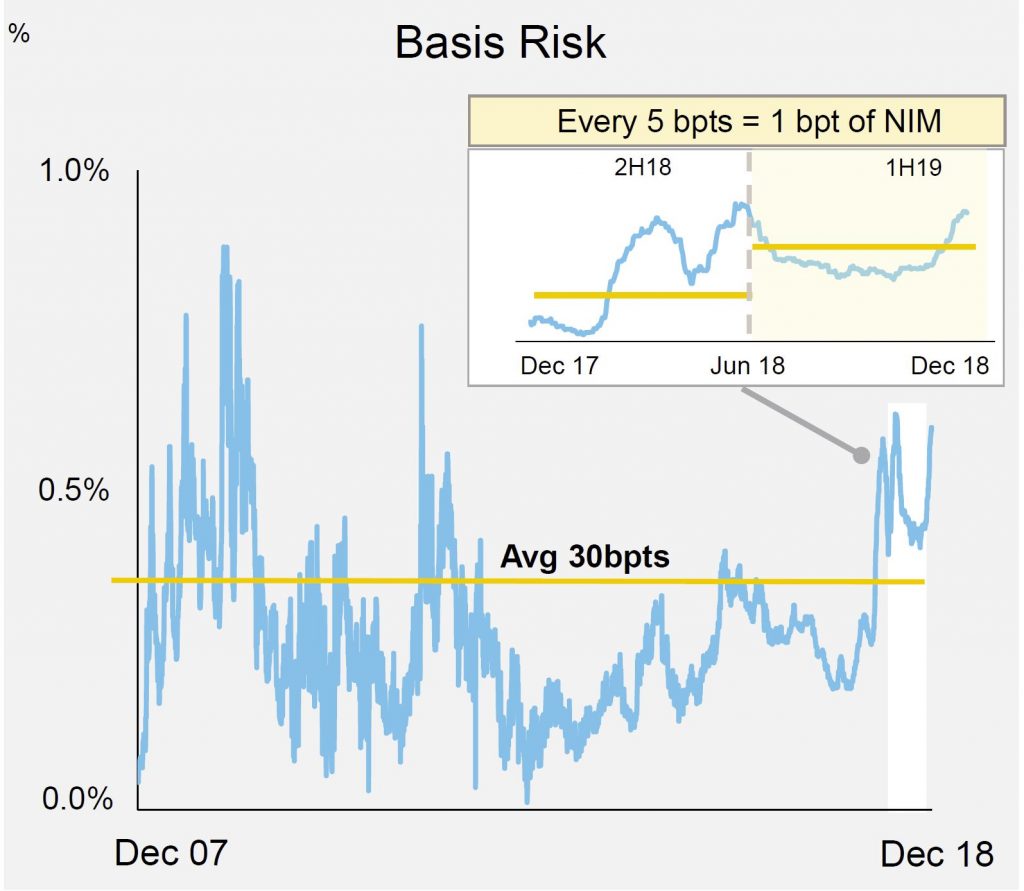
Net interest margin of 2.10%, 4 basis points lower than 2H18, due to higher funding costs and home loan switching and competition. The pressure was from higher funding, basis, discounting and offset by deposit repricing. Retail Banking margin fell from 277 1H18, to 260 basis points in 1H19, driven by higher funding costs and home loan margin pressures.
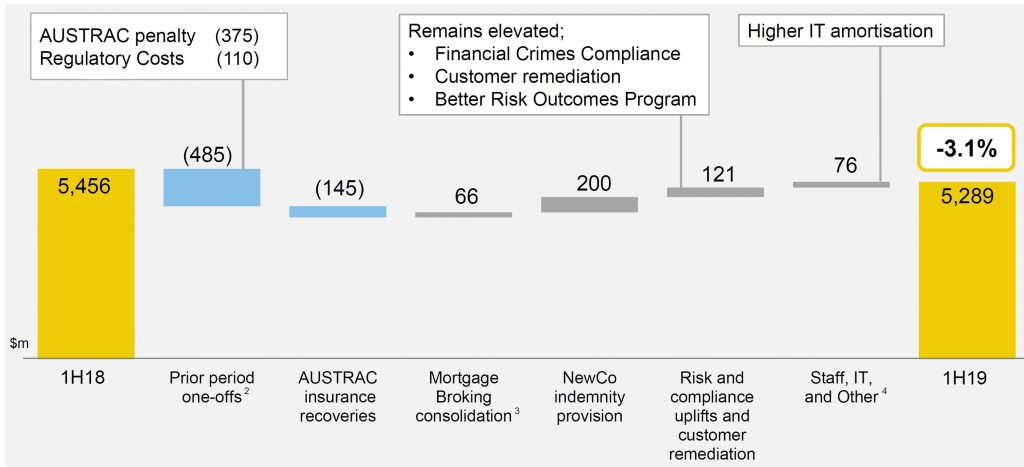
Operating expenses of $5,289 million, a reduction of 3.1%, with elevated risk, compliance and remediation costs offset by prior period one-offs.
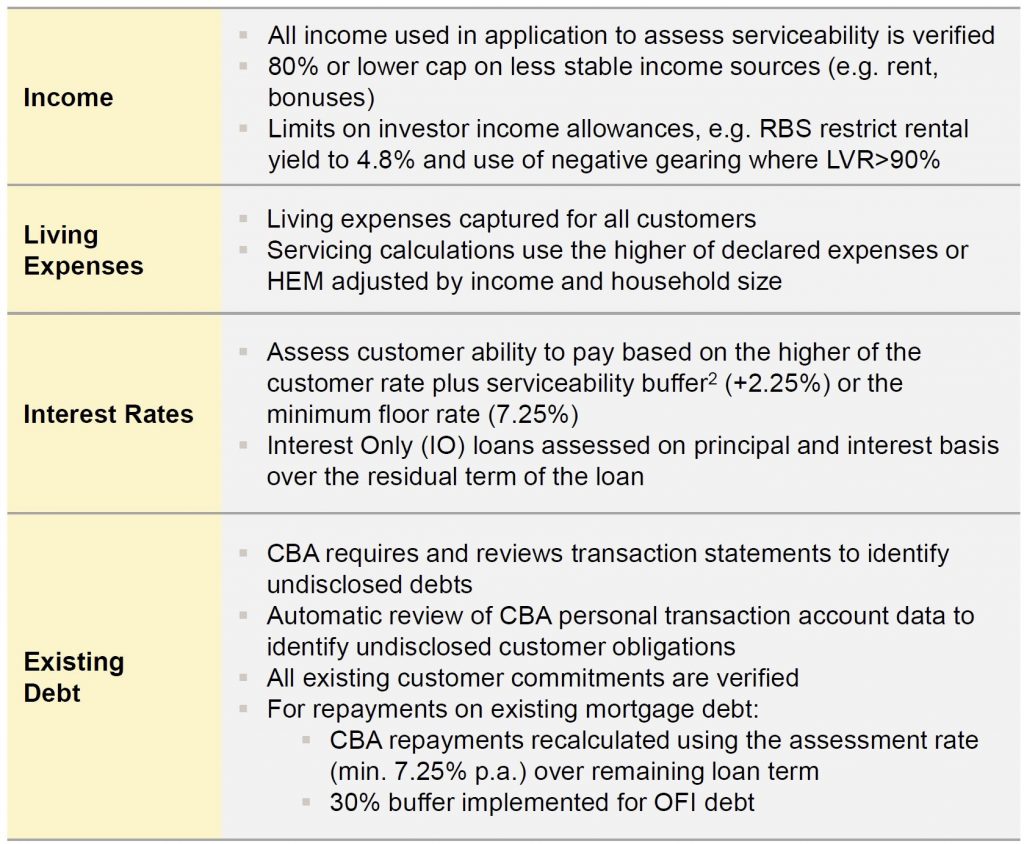
Home lending in Australia grew at 3.5% in total, with investment loans at 0.1%, and at 0.9 times system growth in 1H19. They had less reliance on mortgage brokers. They have increased loan underwriting standards significantly.

Borrowing capacity has dropped by around 15% on average, compared with 2015. Current serviceability tests include an interest rate buffer of 2.25% above the customer rate, with a minimum floor rate of 7.25%
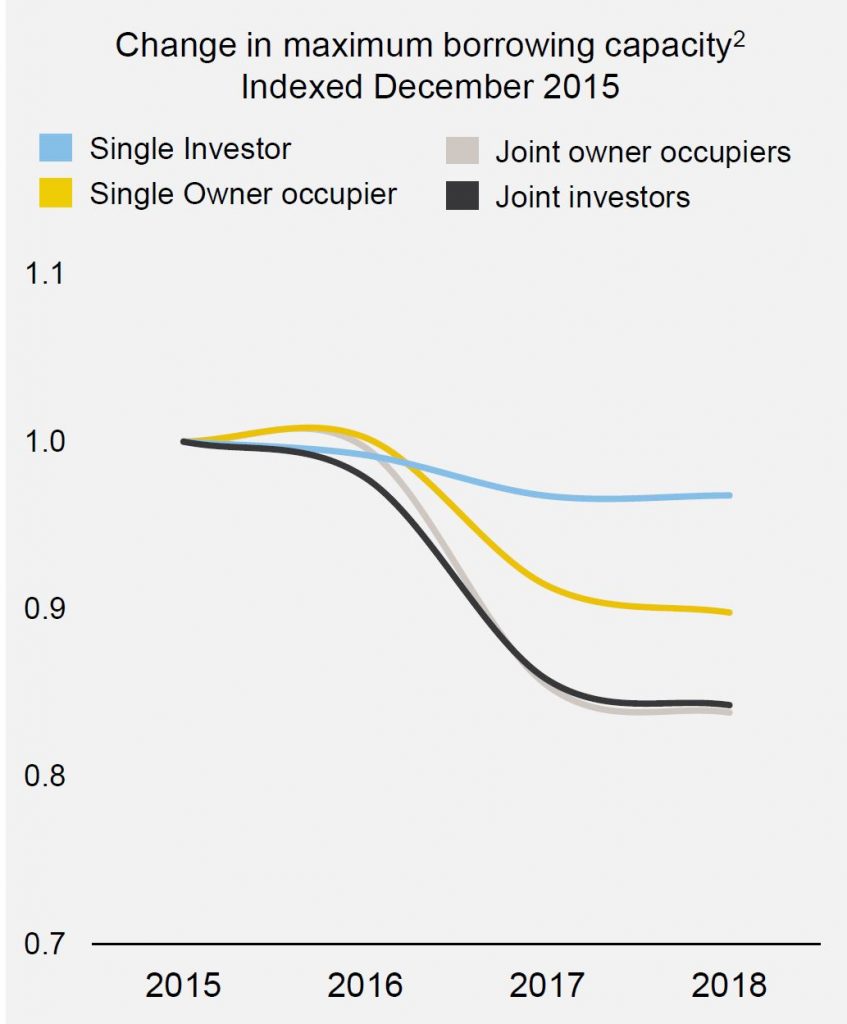
Standards are higher now.
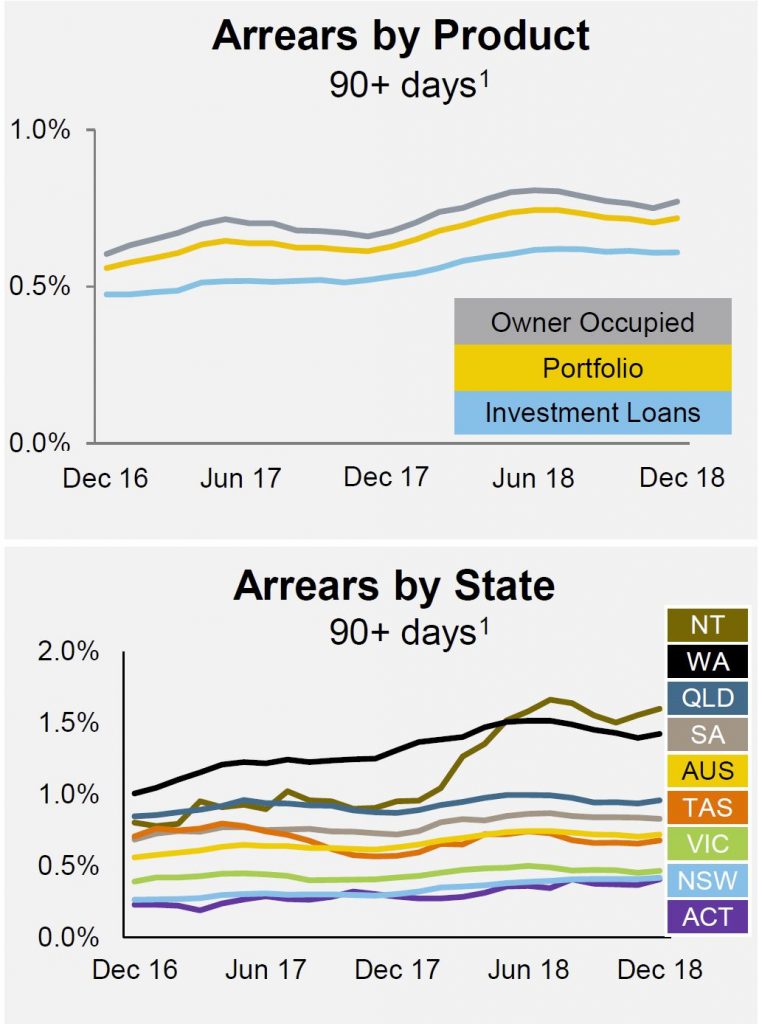
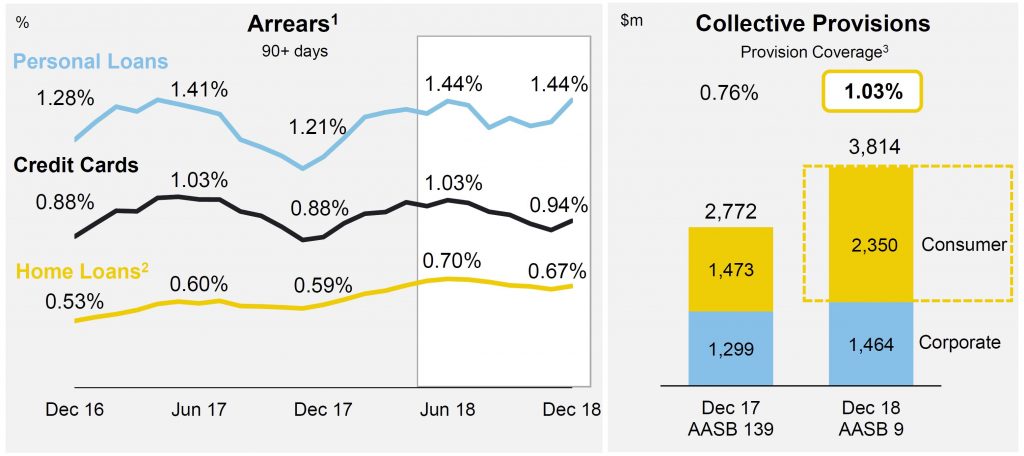
Mortgage arrears are rising, with WA and NT leading the way.
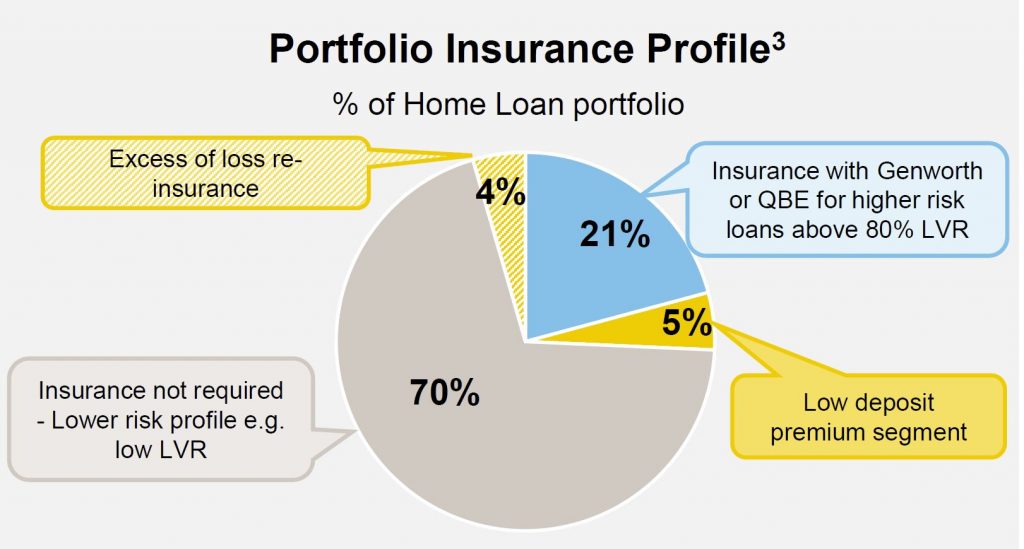
A severe stress test scenario is modelled on an ongoing basis. Scenario includes stresses to house prices (31% decline), unemployment (11%), cash rates (reduced to 0.5%). Losses are estimated over three years: Gross 3-year losses of $3.85b, or $3.06b net of insurance.
21% are insured with Genworth or QBE.
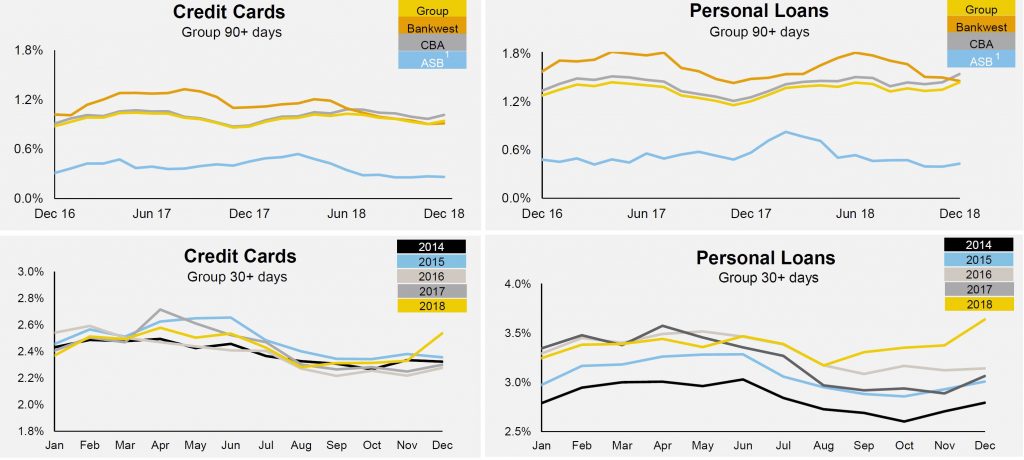
Consumer debt is also under pressure.
Loan impairment expense of $577 million, equivalent to 15 basis points of average gross loans and acceptances annualised, down from 16 basis points.
Funding costs continue to rise, as expected.
Every 5 basis points of basis risk equates to 1 basis point of net interest margin.
Effective tax rate of 28.5%, expected to rise to approximately 29% for FY19. Interim dividend per share flat at $2.00. The Dividend Reinvestment Plan is anticipated to be satisfied in full by an on-market purchase of shares.
Earnings per share (cash basic) of 265.2 cents, an increase of 0.9 cents per share. Return on equity (cash) of 13.8%, down 40 basis points.
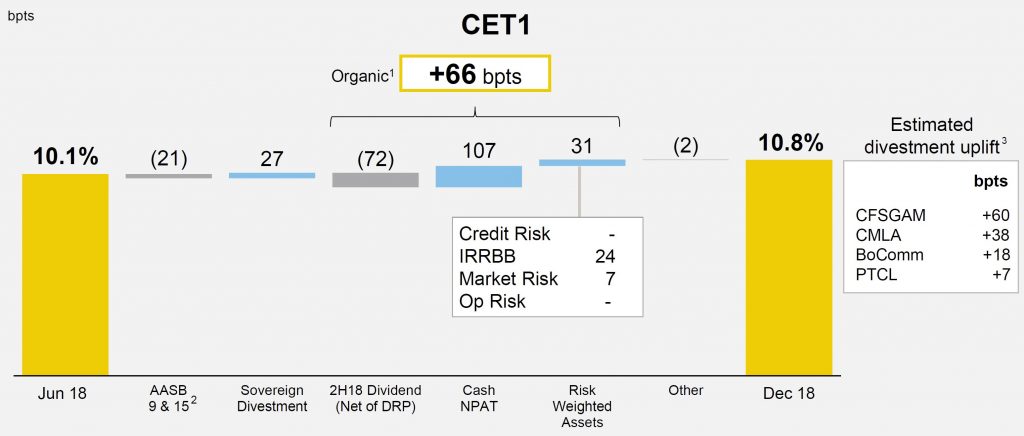
Common Equity Tier 1 (CET1) capital ratio on an APRA basis of 10.8%, up from 10.1% as at June 2018.
