My post yesterday “The Truth about Mortgage Brokers” created quite a a number of requests for more information, especially around my comment that broker originated loans tend to have higher loan-to-income and loan-to-value ratios compared with bank originated loans.
So today, I am posting further data on these two dimensions, drawing more data from our household surveys.
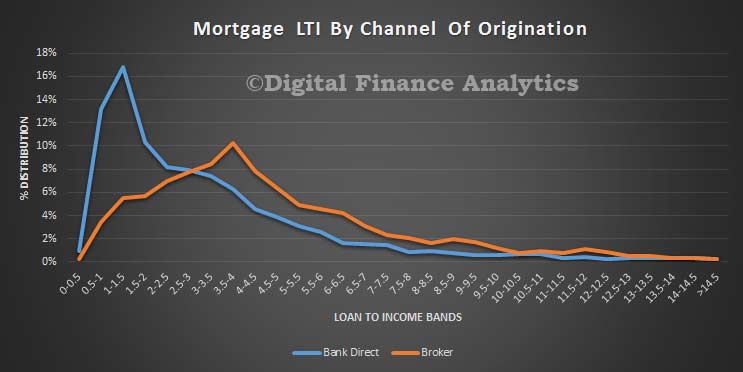
First, here is a plot of the average loan to income (LTI) bands separated by bank direct and broker channels of origination, which clearly shows that broker loans have a relative distribution of higher LTI loans.
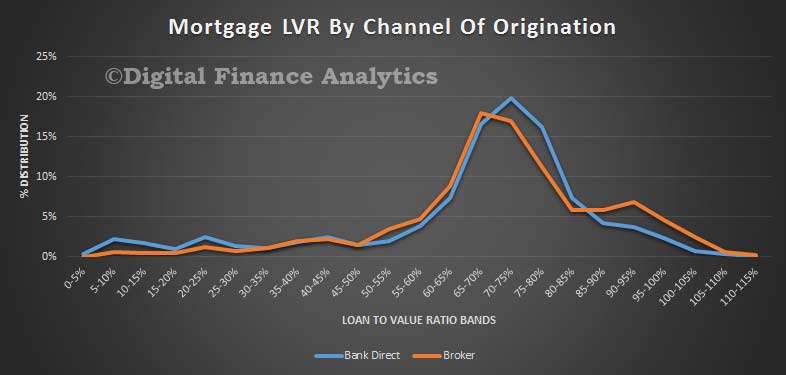
 Running the same analysis on loan to value (LVR) bands, we also see a higher distribution of broker loans above 85%.
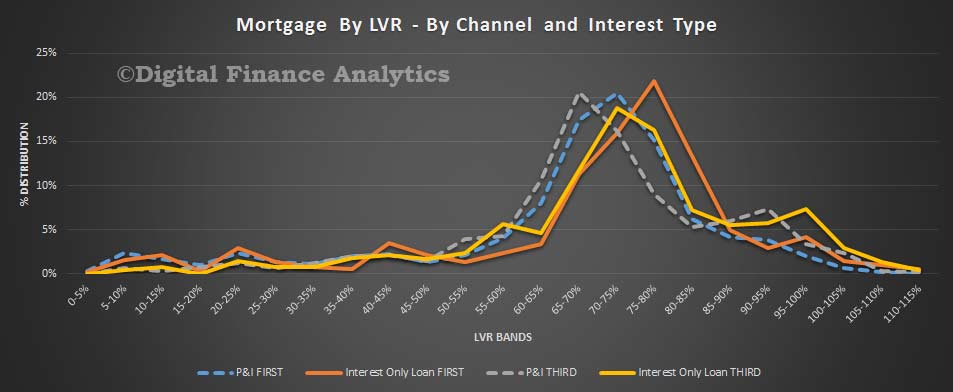
 We can take the analysis a little further by comparing interest only loans and principal and interest repayment loans. The LVR distribution analysis shows that interest only loans have a higher LVR, and those with a third party channel of origination are the highest.
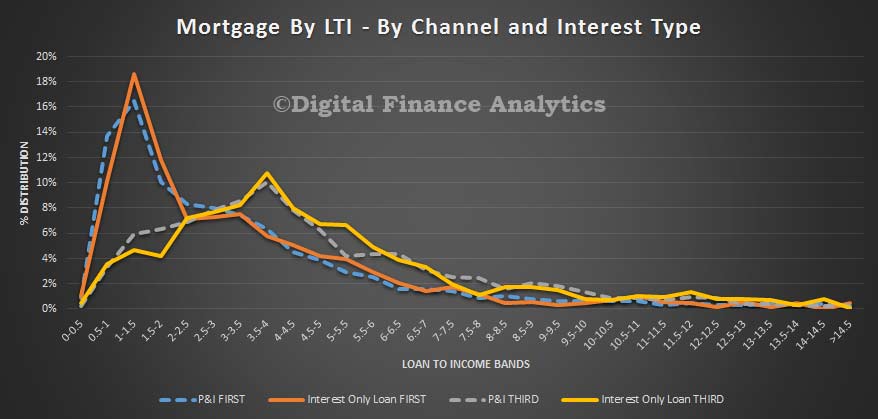
 The LTI picture is not so clear cut, though there is a slightly higher distribution of interest only loans via brokers across the LTI bands.
 It is worth thinking about what may be causing this. First, we know that different customer segments have different propensities to use brokers, and possibly those looking to borrow more, at higher LVR and LTI are more naturally inclined to go to a broker. Interest only loans have lower repayments, so for a given level of income, should allow access to a larger loan amount as the repayments only cover interest (though of course the principal will need to be repaid eventually). In addition, brokers will know from their panel lists where the higher LVR and LTI deals can be done. The data in the surveys includes bank and non-bank lenders.
However, irrespective of the channel of origination, lenders still need to complete their underwriting analysis. So it would seem different criteria are being applied depending on the origination channel.
Also, we should say that the data in the survey comes from loans written in the past 12 months, and there have been some changes to underwriting in that time.
Nevertheless, the additional analysis reinforces the view that broker originated loans are on average more risky, supporting APRA’s statement.

I’d like to know where you got your data from please?
All of the major banks call on us as we are actively involved in the collection process, a broker is totally dependent on financially secure customers, trail income only works on a long-term perspective.
Uniformly we are shown reports on our loan books and told overall the “broker book” is “cleaner” than branch originated loans.
Yes there are vastly different lending guidelines between broker and branch, its the common reason given by the bank BDM’s for the clean broker book, broker loans have harder criteria to pass to get approved. This is one of the reasons the oft-cited debacle at Moranbah is quoted, few brokers could process one even if they wanted to as it was well know the “boom” would draw to a close. I was working in Suncorp in lending and was astounded at the loans written by branches.
The data comes for the rolling household surveys which we run – so direct from households. As part of the conversation we ask about their financial footprint. We then calculate the LVR and LTI. We also mark to market the property. So a large and robust dataset, which takes a whole of market view. As I said in the blog, I suspect the differences are more driven by different customer needs; and I am not anti-broker. The best of the do a great service.