We think that the ratio of loan outstanding to income (LTI) is a good indicator to assess the health of a mortgage loan portfolio, especially when incomes are not rising fast. In Australia, there is no official data on LTIs, from either the statistical or supervisory bodies, or from individual lenders. We think this needs to change. Internationally, there is more focus on the importance of LTI analysis, and LTI is regarded by many as the best lens to assess potential risks in the portfolio. We highlighted the New Zealand analysis recently.
We recently analysed data from our household surveys and presented some of the data in an earlier post, comparing LTI with LVR. Today we look further at the relationship between LTI and income, again using the DFA household data. We find significant variations. The data takes the current loan balance, and current income data (not that which may have existed when the loan was written initially). Not all banks appear to update their customer income data regularly, so many will not know the true state of play. When incomes are rising fast, as happened in the early 2000’s, this was probably not a issue, but now with income growth slowing, and loans larger, this is much more important.
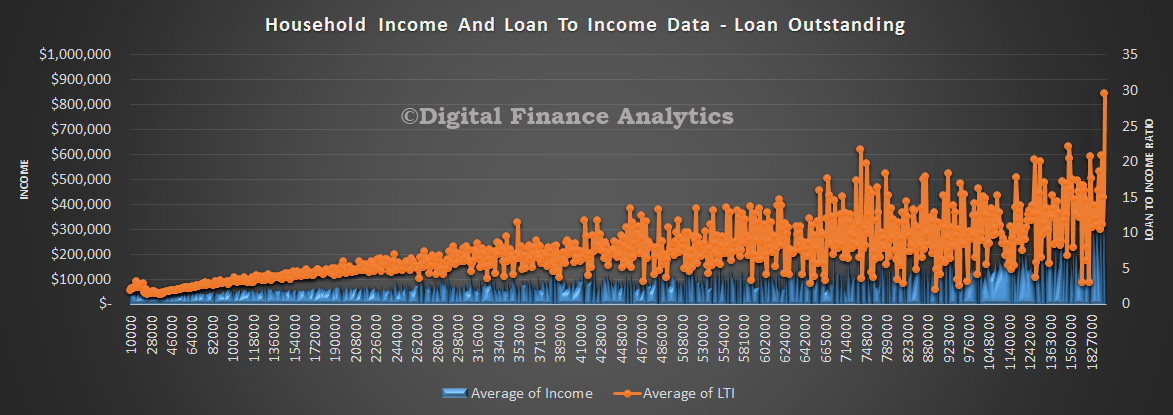
The first chart shows the income scale on the left, and the LTI on the right, and we look at the loan size across the page. We see that LTI’s tend to be lower and more consistent up to about $300k, but as the loan size rises above this, the loan to income ratio varies significantly. Some borrowers with large loans have an LTI on 15-20. These larger loans will be assessed by lenders on other factors, including assets and other investments held.
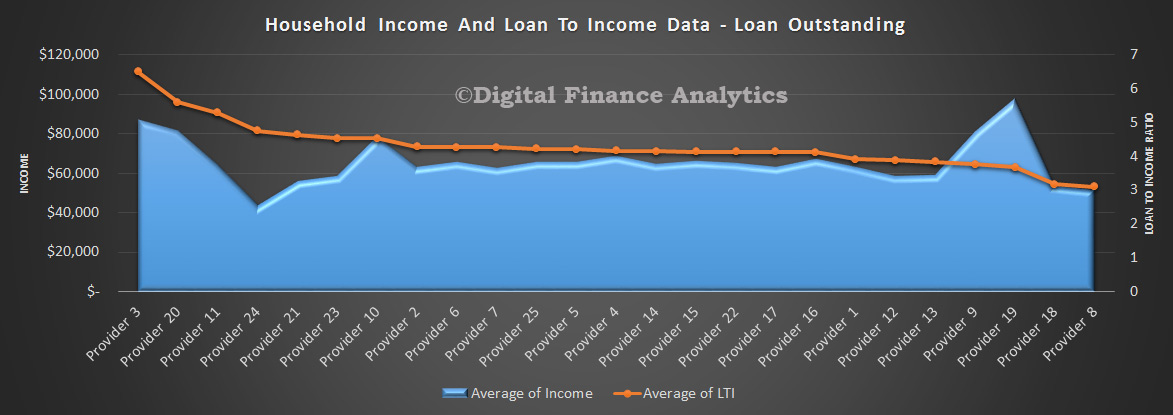
 Now, lets shift the lens to the various mortgage providers. I have disguised the individual lenders in this chart, but this shows the average LTI of all mortgages outstanding, and average household income by provider. The highest portfolio has an LTI of above 6, the lowest, half as high. It is fair to assume therefore that banks use different underwriting criteria to grant loans. All else being equal, higher LTI is higher risk.
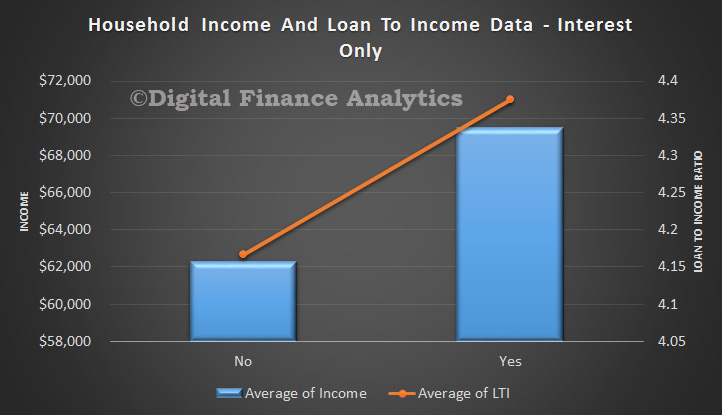
 So now lets look at interest only loans versus normal repayment loans. This is important because interest only loans make up more of the portfolio, We see that the LTI is somewhat higher on an interest only loan, though these loans on average tend to align with slightly higher income.
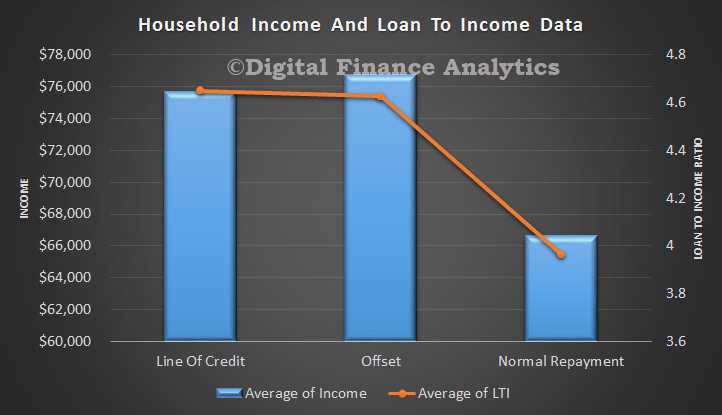
 We also find that normal repayment loans, compared with a line of credit or offset loan, have a lower LTI, and income.
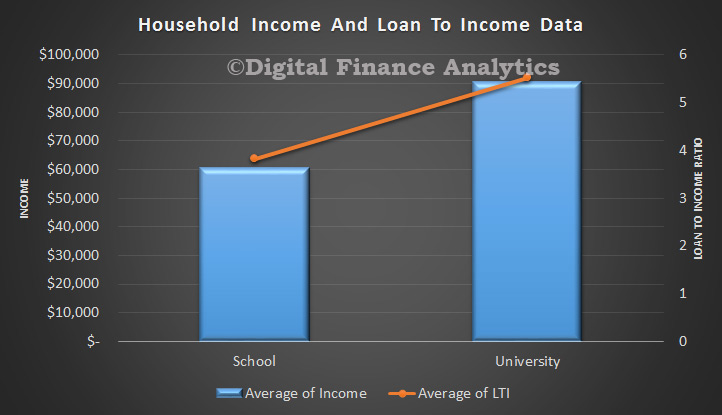
 We find that households whose education level reached university have higher incomes, and a higher LTI compared with households who left after education at school level.
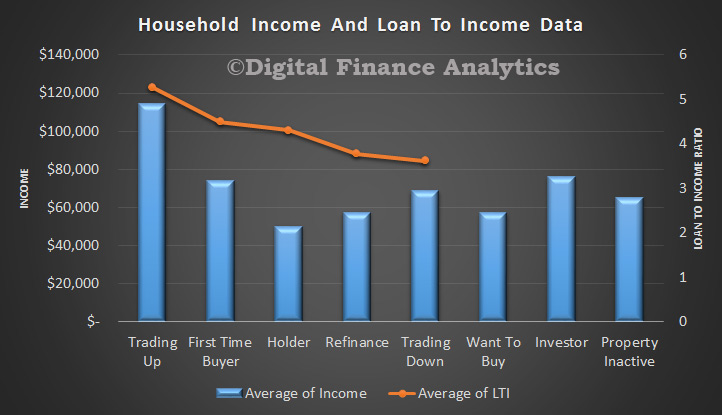
 Looking at the DFA segments, we find that those trading up, and first time buyers have the highest LTI, but there is a significant difference in average incomes between the two. We do not capture LTI data for Want To Buys, Property Inactive households or Investors. We also see that those who own property, with no plans to change, have a lower average income than those aspiring to enter the market.
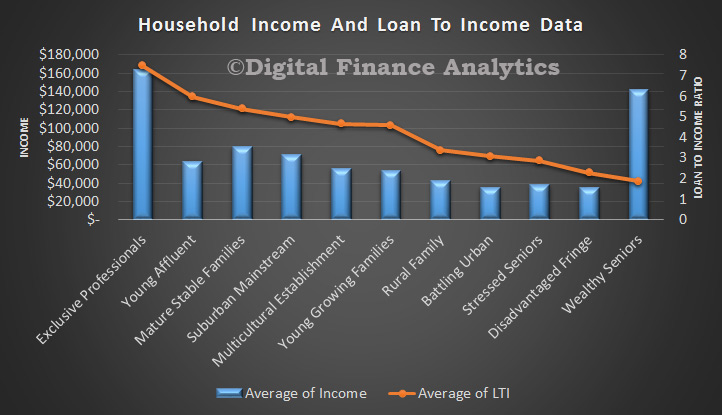
 We have sorted the data by our core segments, and see that the Exclusive Professional segment has the highest income and the highest LTI. But note how the Young Affluent have an average LTI of around 6, yet their income is significantly lower. Those stressed households generally have significantly lower LTI’s so we can see that underwriting criteria does vary by segment, and the lowest LTI resides amongst Wealth Seniors.
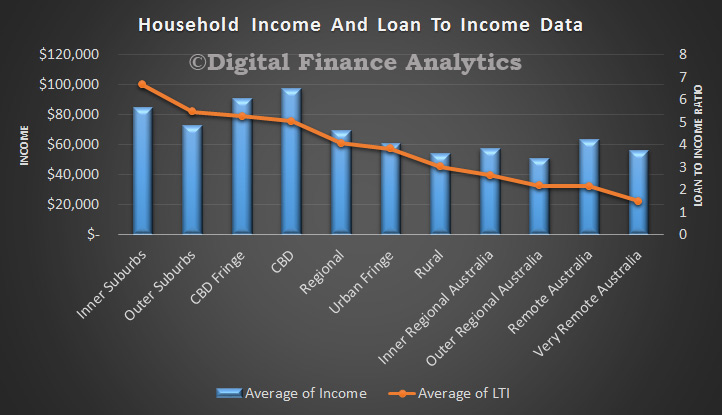
 Another lens is the DFA geographic bands. Here we find that households in the inner suburbs have the highest LTI, around 6, whilst both income and LTI drift lower as we migrate into the more remote regional areas.
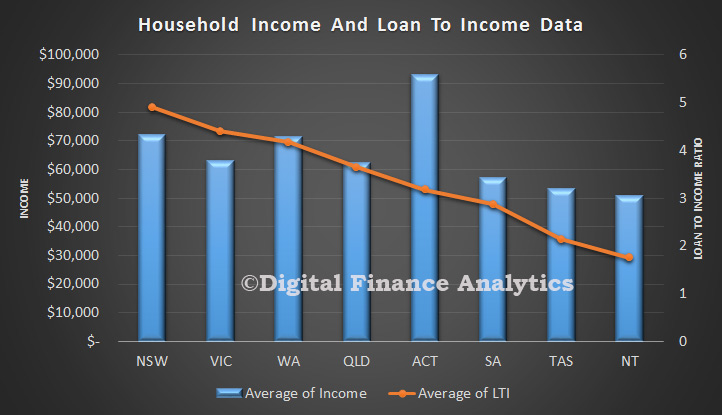
 Finally, up to now we have used national averages, but it is worth highlighting that average incomes and LTI do vary across the states. NSW has the highest LTI, around 5, whilst NT sits around 2. Average household income is highest in the ACT, but NSW and WA also have higher levels of average income, compared with some of the other states.
 We think there is important work to be done to apply risk lenses across LTI bands, and we believe we need reporting on this important aspect. Without it, we are flying blind.
