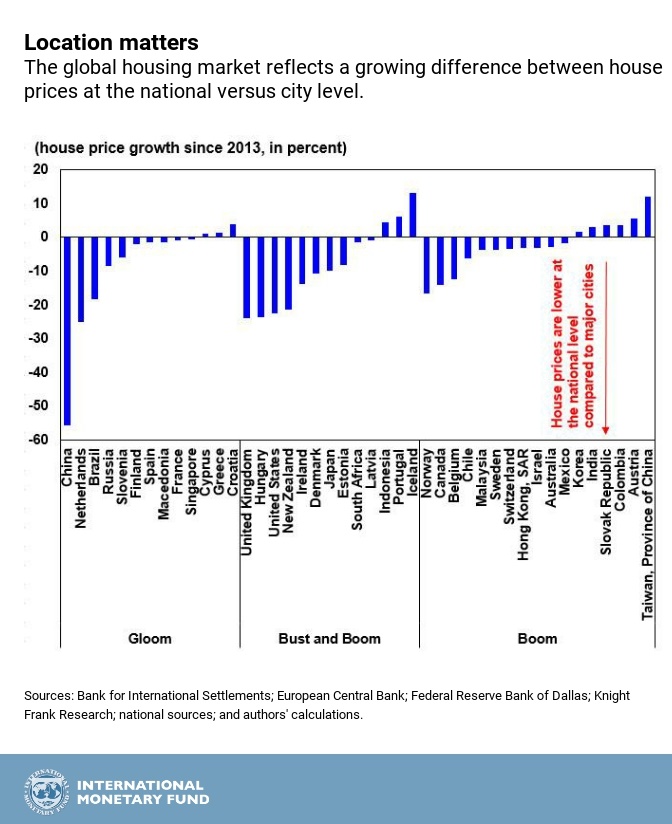
While house prices around the world have rebounded over the last four years, a closer look reveals that this uptick is dependent on three things: location, location, location.
The IMF’s Global House Price Index—an average of real house prices across countries—has been rising for the past four years. However, house prices are not rising in every country. As noted in our November 2016 Quarterly Update, house price developments in the countries that make up the index fall into three clusters: gloom, bust and boom, and boom.
The first cluster—gloom—consists of countries in which house prices fell substantially at the onset of the Great Recession, and have remained on a downward path.
The second cluster—bust and boom—consists of countries in which housing markets have rebounded since 2013 after falling sharply during 2007–12.
The third cluster—boom—consists of countries in which the drop in house prices in 2007–12 was quite modest, and was followed by a quick rebound.
This chart shows that house prices varies within a cluster and within a country. Recent IMF assessments provide a more nuanced view of the within-country house price developments.
For example, in Australia, the strongest house price increases continue to be recorded in Sydney and Melbourne, where underlying demand for housing remains strong.
In Austria, the cumulative increase in the house price index over 2007–2015 was nearly 40 percent. To a large extent, this increase was driven by price dynamics in Vienna.
Looking at Turkey, the housing market exhibits significant variations across cities. Regional variations have been further accentuated by the presence of almost 3 million Syrian refugees since March 2011. Cities near the Syrian border, which have absorbed larger masses of Syrian refugees, have seen significant rises in local housing prices since 2011, though they have moderated in recent years.
Country/region and city clusters
Gloom = Brazil (Rio de Janeiro); China (Shanghai); Croatia (Zagreb); Cyprus (Nicosia); Finland (Helsinki); France (Paris); Greece (Athens); Macedonia (Skopje); Netherlands (Amsterdam); Russia (Moscow); Singapore (Singapore); Slovenia (Ljubljana); and Spain (Madrid).
Bust and Boom = Denmark (Copenhagen); Estonia (Tallinn); Hungary (Budapest); Iceland (Reykjavik); Indonesia (Jakarta); Ireland (Dublin); Japan (Tokyo); Latvia (Riga); New Zealand (Auckland); Portugal (Lisbon); South Africa (Johannesburg); United Kingdom (London); and United States (San Francisco).
Boom = Australia (Melbourne); Austria (Vienna); Belgium (Brussels); Canada (Toronto); Chile (Santiago); Colombia (Bogota); Hong Kong, SAR (Hong Kong); India (New Delhi); Israel (Tel Aviv); Korea (Seoul); Malaysia (Kuala Lumpur); Mexico (Mexico City); Norway (Oslo); Slovakia (Bratislava); Sweden (Stockholm); Switzerland (Zurich); and Taiwan, Province of China (Taipei City).
Read more on IMF global house price studies and check out the Global Housing Watch site.

