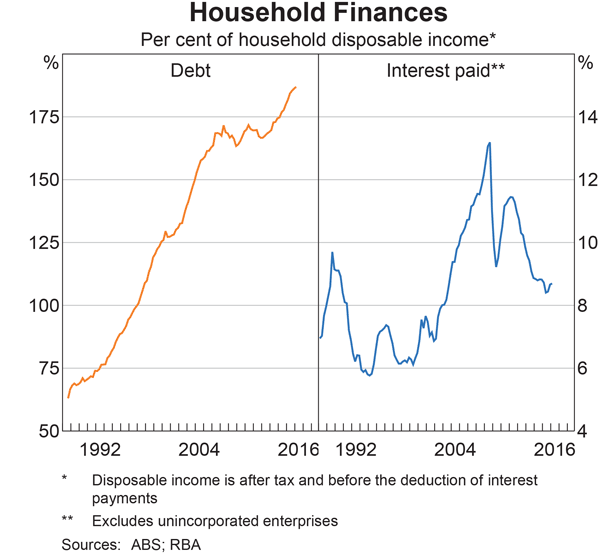
The latest RBA chart pack includes this chart, which shows that household debt (mainly housing) continues to rise, when compared with disposable income.
 This ratio continues north, thanks to still rising home prices, and mortgages, and low income growth.
