The ABS published some revisions to their Household Income and Wealth statistics.
Two data series stood out for me. First, more households are in debt today, compared with 2005-6, and second more households have debts at more than three times their income.
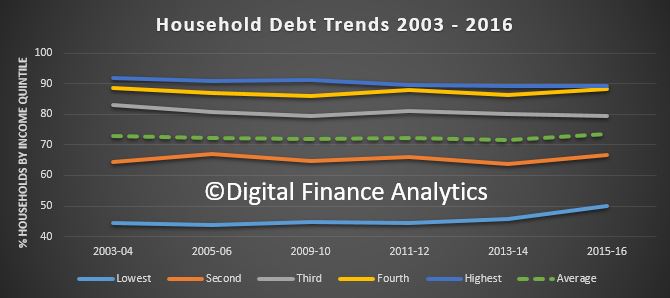
Here is the plot of the proportion of households with debt, by income quintile. In 2003-4, 72.9% of all households had debt, and this rose to 73.6% in 2015-16, up 0.7% across the series.
But, those on lower incomes have borrowed harder, with 50% in the bottom income range borrowing, compared with 44.6% in 2003-4, a rise of 5.4%. The second lowest saw a rise of 2.2%, up from 64.5 to 66.7. On the other hand, the highest quintile saw a fall from 91.8% in 2003-4 to 89.2% in 2015-16, down 2.6%.
 The ABS also said that in 2005-6 the proportion of households with debt more than three times income was 23.9%, while in 2015-16 it was 27.2%, up 3.3%.
 This underscores the issue we face, debt is higher, and more lower income families are more stretched. Sure, net worth may be higher now, but the debt (mostly mortgage debt) is the problem. As we saw last week, most of the growth in wealth is associated with home prices. Should they reverse, then this looks very wobbly.
