The latest Digital Finance Analytics Household Finance Confidence Index for March 2018 shows a further slide in confidence compared with the previous month.
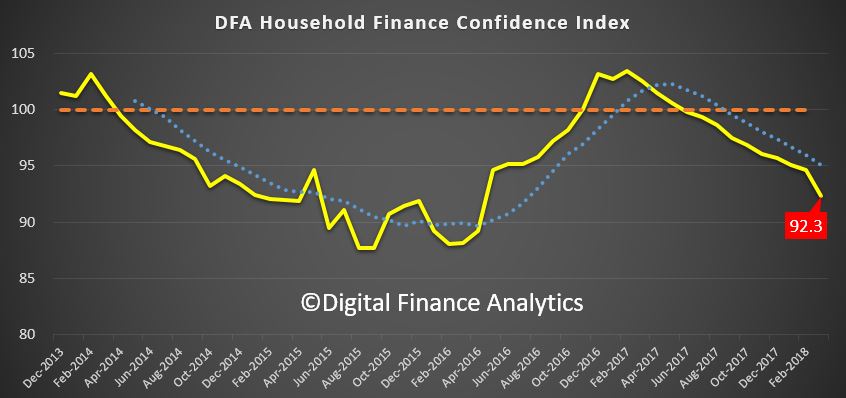 The current score is 92.3, down from 94. 6 in February, and it has continued to drop since October 2016. The trend is firmly lower.
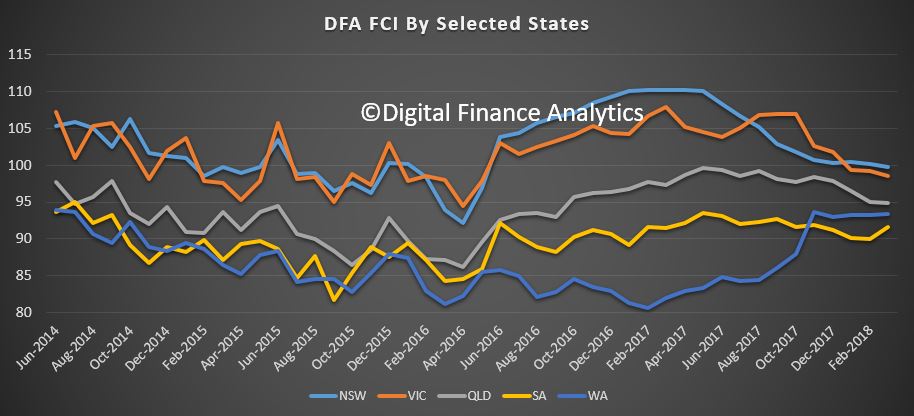
Across the states, confidence is continuing to fall in NSW and VIC, was little changes in SA and QLD, but rose in WA.
 Across the age bands, there were falls in all age groups.
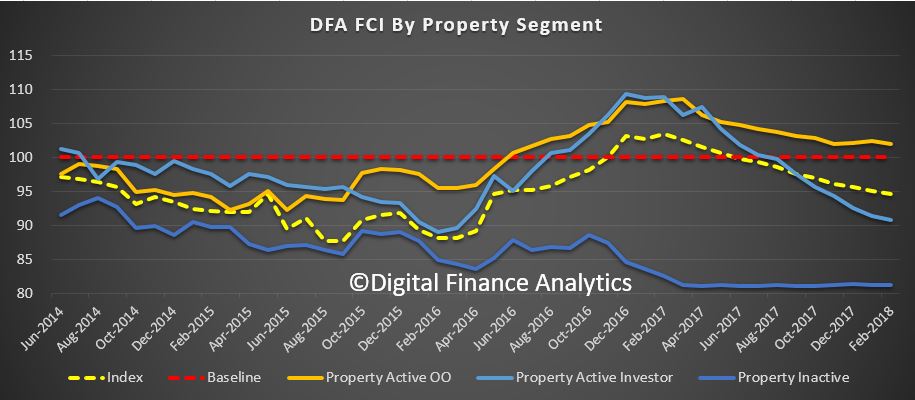
 Turning to the property-based segmentation, owner occupied householders remain the most confident, while property investors continue to become more concerned about the market. Those who are property inactive – renting, or living with parents or friends remain the least confident. Nevertheless those who are property owners remain more confident relative to property inactive households.
 We can look at the various drivers which underpin the finance confidence index.
We start with job security. This month, there was a rise 6% in households who are less confident about their job security compared with last month, up to 25.8%. Those who felt more secure fell by 1.5% to 12.1% while 61% saw no change. Availability of work was a primary concern, but the security concerns were more around job terms and conditions, and the requirement to work unsocial hours and weekends.
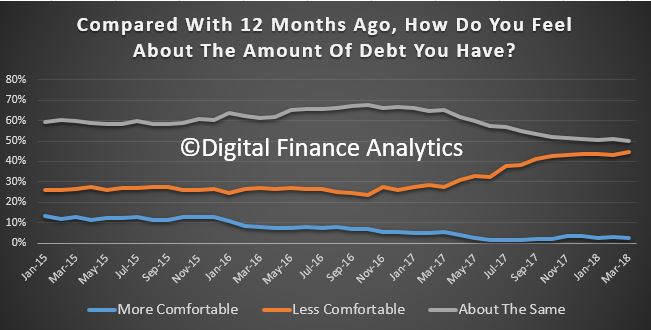
 Turning to concerns about levels of debt, 44.5% of households were more concerned about their outstanding loans, up 1.5% from last month. Under 3% of households were more comfortable with the debt they hold. 49% reported no change this month. Those who were more concerned about debt highlighted concerns about higher interest rates, and the ability to service their current loans in a flat income environment.
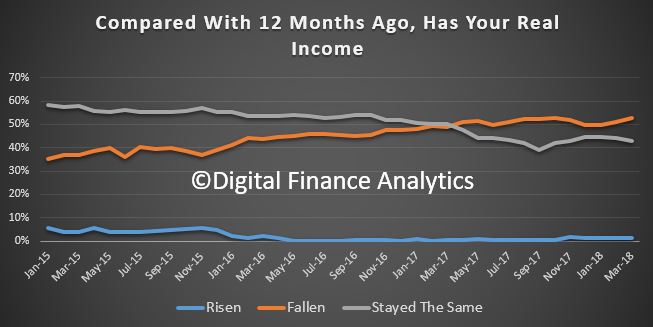
 52% of households reported their incomes had fallen in the past month, in real terms. This is up 1.5% this month. Just over 1% of households reported a pay rise, and 43% reported no change in real incomes. More households comprise of members who are working multiple jobs to maintain income.
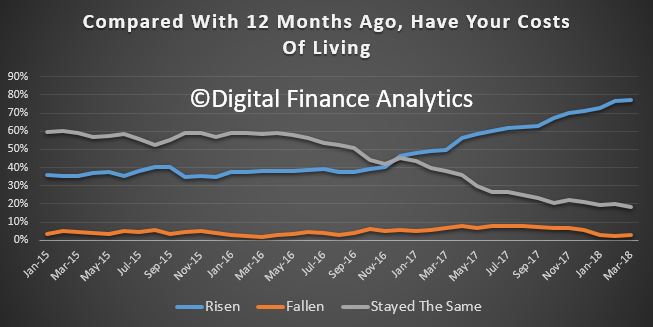
 In contrast, cost of living continues to rise faster than incomes for many households. 77% of households said their costs had indeed risen, up slightly from last month. 18% of households said costs had stayed the same and 3% said costs had fallen. Households said the costs of electricity, petrol, school fees and child care costs all hit home. Health care costs, and especially the costs of private health care cover also figured in their responses. More households are seriously considering terminating their health insurance cover due to the rising expense.
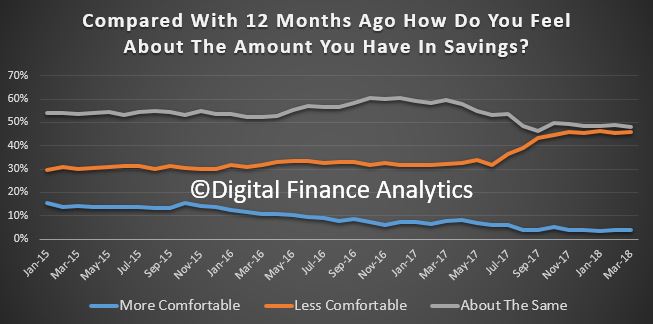
 Turning to savings, 46% of households were less comfortable with their savings a rise of 1.5% compared with last month. 4% were more comfortable. 50% were about the same. There were ongoing concerns about further falls in interest rates on deposit accounts, and the need to continue to raid savings to support ongoing household budgets.
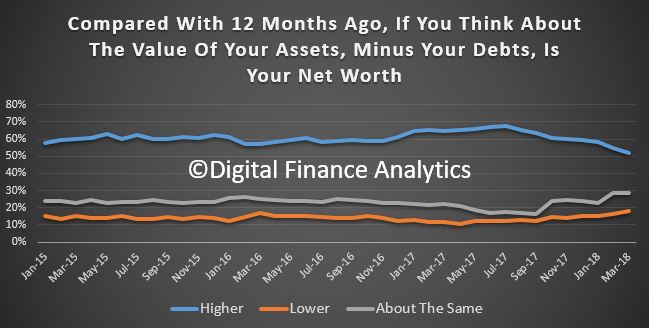
 Finally, we look at household overall net worth. Despite the volatility seen in the financial markets, the main concern captured in answers to this question related to potential falls in property values. 52% said their total net worth was higher, down 3% from last month. 18% said their net worth was lower, a rise of 2% compared with last month. 28% remained the same. Both those with higher levels of education, and males tended to report more of a rise in net worth. Women were considerable more concerned about the current trajectory of home prices, and the risks relating to future falls. Households in regional centres remained more concerned about their net worth, not least because in many areas home prices have risen less strongly in recent years.
 So in conclusion, based on the latest results, we see little on the horizon to suggest that household financial confidence will improve. We expect wages growth to remain contained, and home prices to slide, while costs of living pressures continue to grow. There will also be more pressure on mortgage interest rates as funding costs rise, and lower rates on deposits as banks trim these rates to protect their net margins.
By way of background, these results are derived from our household surveys, averaged across Australia. We have 52,000 households in our sample at any one time. We include detailed questions covering various aspects of a household’s financial footprint. The index measures how households are feeling about their financial health. To calculate the index we ask questions which cover a number of different dimensions. We start by asking households how confident they are feeling about their job security, whether their real income has risen or fallen in the past year, their view on their costs of living over the same period, whether they have increased their loans and other outstanding debts including credit cards and whether they are saving more than last year. Finally we ask about their overall change in net worth over the past 12 months – by net worth we mean net assets less outstanding debts.
We will update the index next month.

