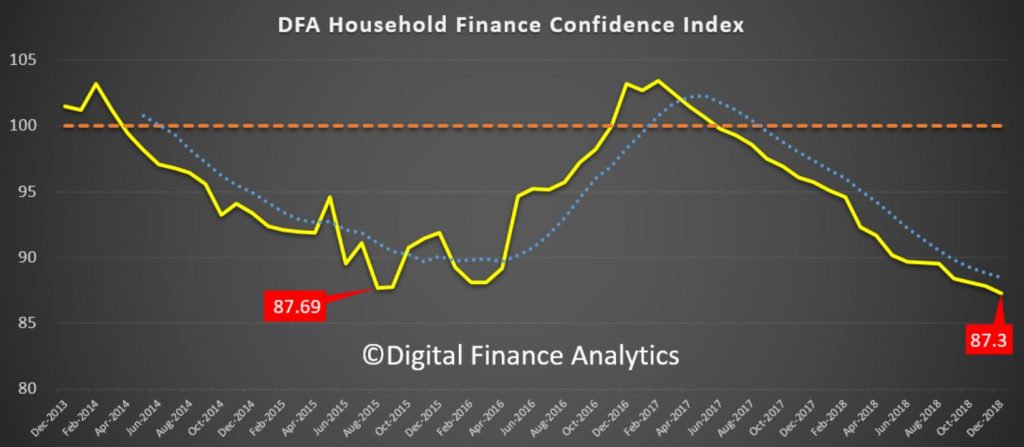
Following on from our mortgage stress report for December 2018, which we released yesterday, we complete our monthly data series with the release of the December Household Financial Confidence Index, our gauge of how households are feeling about their financial situation.
The overall index fell again in December to an all-time low of 87.3 (which is strange given the Government’s assertion the economy is in fine fettle!
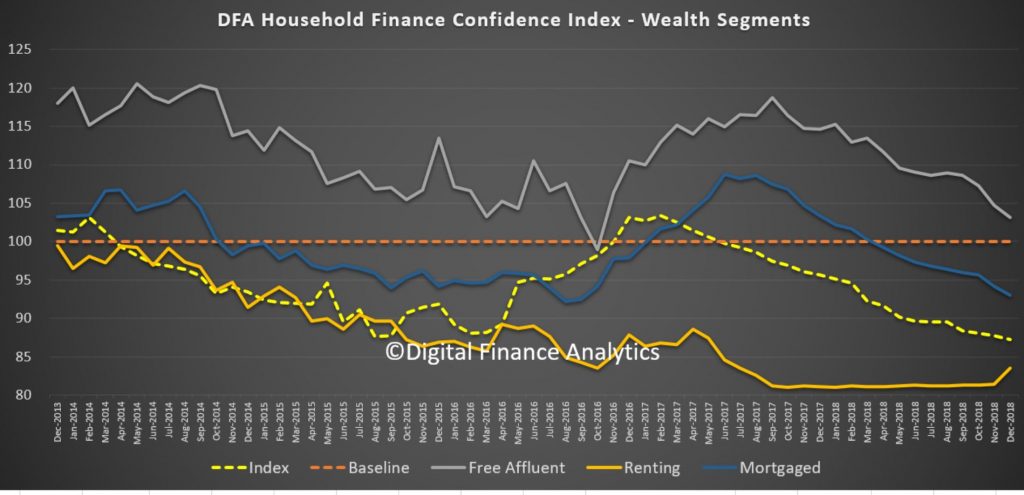
The DFA index can be segmented a number of different ways, to home in on which households are most concerned about the state of their finances. A significant factor is whether households are property owning, and whether they are mortgaged. Households who hold property, but no mortgage are the most confident and above the 100 neutral setting, although confidence in this group is falling. Those with a mortgage are well below the neutral measure, and confidence for this group continues to fall. Those in the rental sector, or living with friends or family are less confident, though recent wage rises and falling rents have had a slightly positive impact this month.
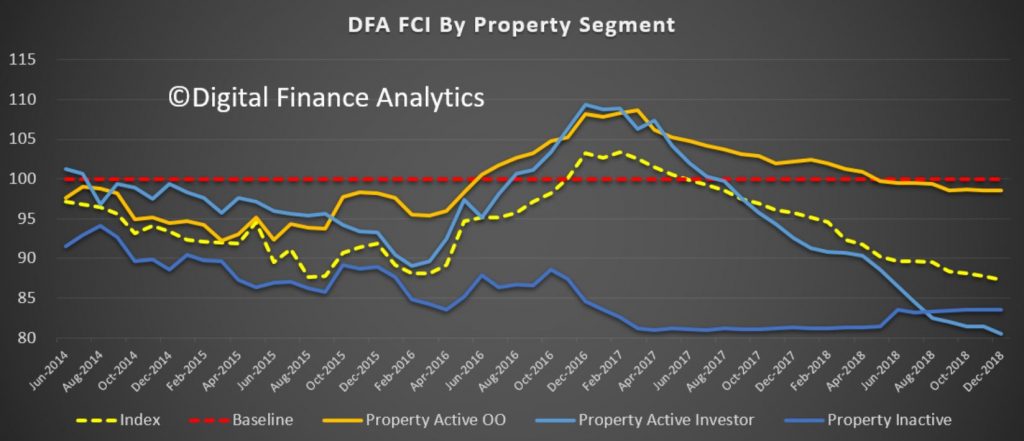
Within the property holding segment, we can also separate property investors from owner occupied households. Significantly property investors have gone very negative now, thanks to falling property prices, rising mortgage costs and issues with mortgage refinancing. The threats to negative gearing are also in play. Concerns about rising mortgage rates are building (Bank of Queensland moved yesterday!). Owner occupied property holders are more positive, those with mortgages and those mortgage free are both within this segment. Property inactive households – those with no exposure to property – are slightly more confident than property investors.
We can also examine the data across the main states. When we do that we find a “bunching” of scores, as NSW and VIC come off their highs (the main centres in which property prices are falling).
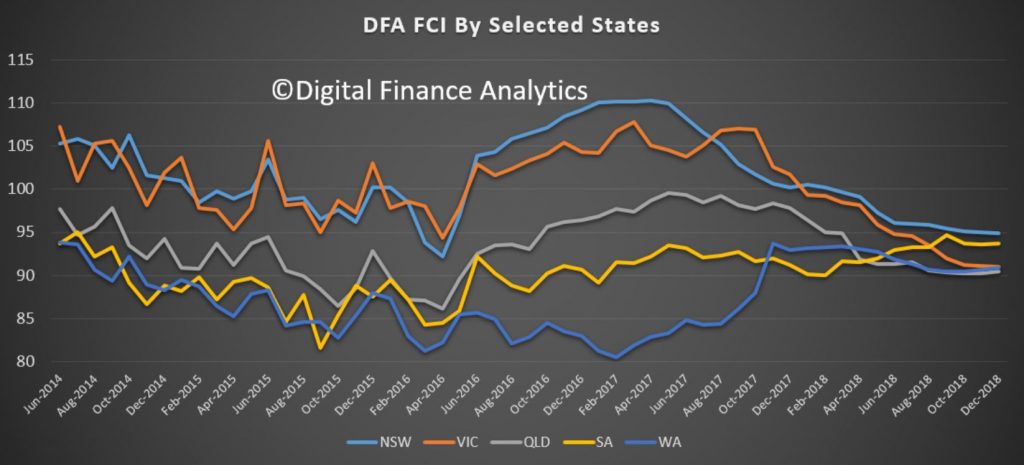
South Australian households have remained more positive, while Victorian households have taken something of a dive -as prices are moving south at a faster clip. And we can also look at the age band data.
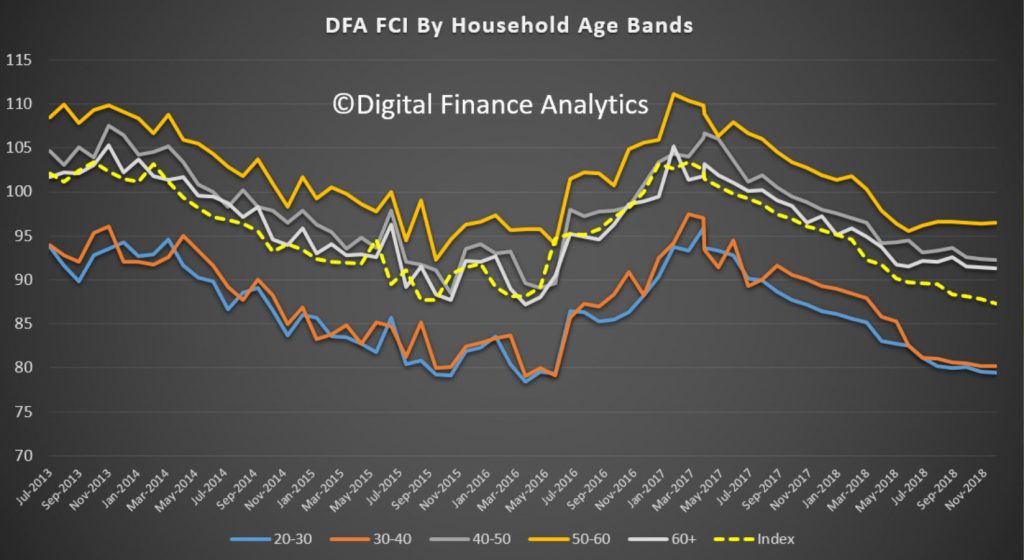
Here, younger households remain the least confident, and the general slide continues across the age bands, other than those aged 50-60 – who are less likely to hold mortgages, so more likely to reside in the “Free Affluent” segment.
We can then look at the data drivers for the index.
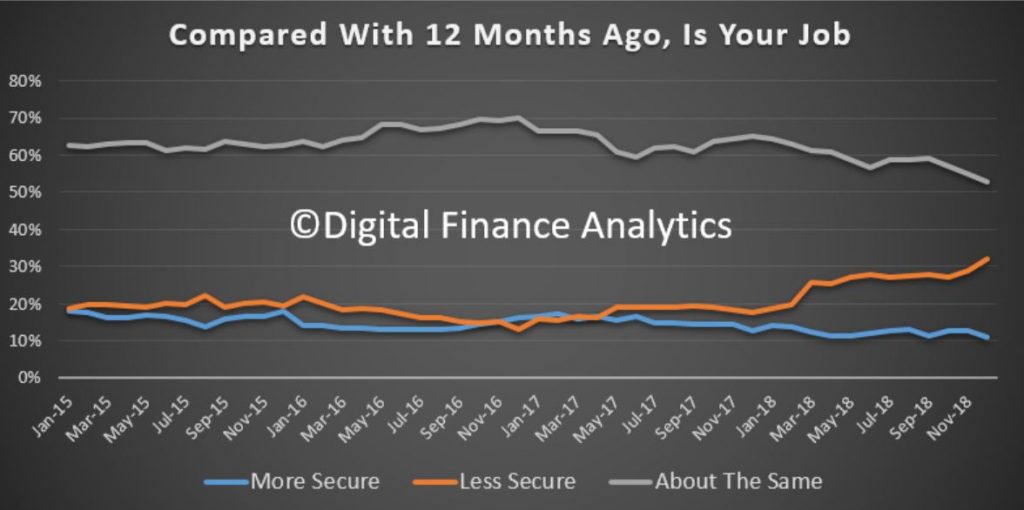
Job security shows a spike in those feeling less secure, up 3% – and workers in the construction and real estate sectors have become more concerned. There was a fall of 1.7% in those feeling more secure than a year ago, at 11%. 53% of households reported no change than a year ago, down 2%.
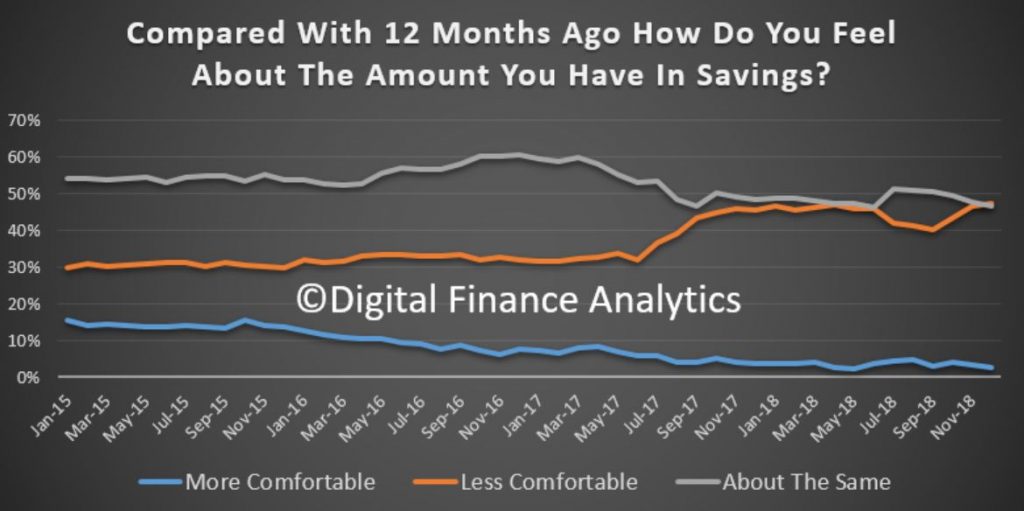
Savings are taking a beating, with more households tapping to savings to sustain their budgets, and also being hit by falls in interest rates on deposits and falls/volatility in the share markets. 2% only, are more comfortable than a year ago, 46% less comfortable, and 51% about the same.
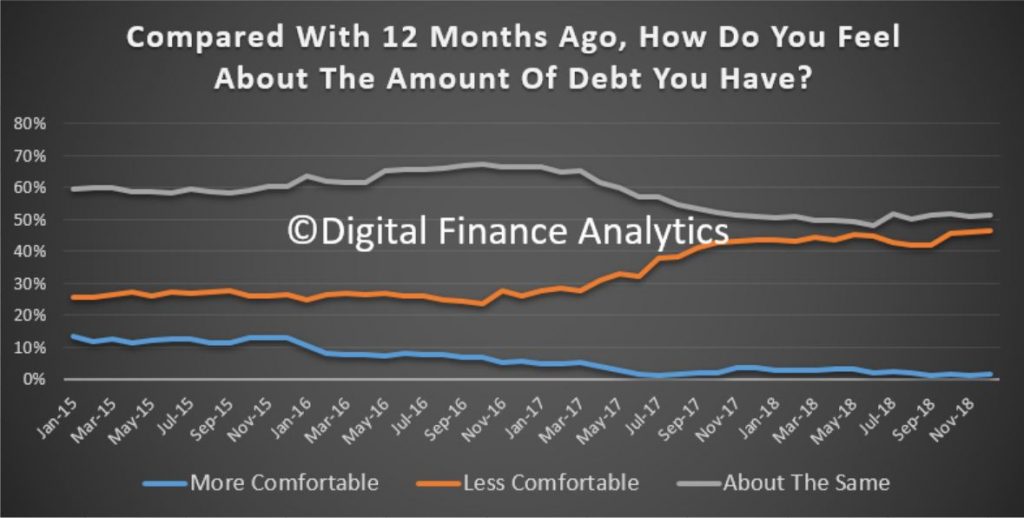
Debt remains a major source of concern for many households. Whilst overall personal credit (other than for mortgages) is falling there are credit hot spots where households under pressure are putting more on credit cards, using staged repayment products like Afterpay, or even Payday loans. Many households are finding their large mortgages more difficult to handle (as reflected in our stress reports). Around 1.5% of households are feeling more comfortable than a year ago, 46% less comfortable and 51% about the same.
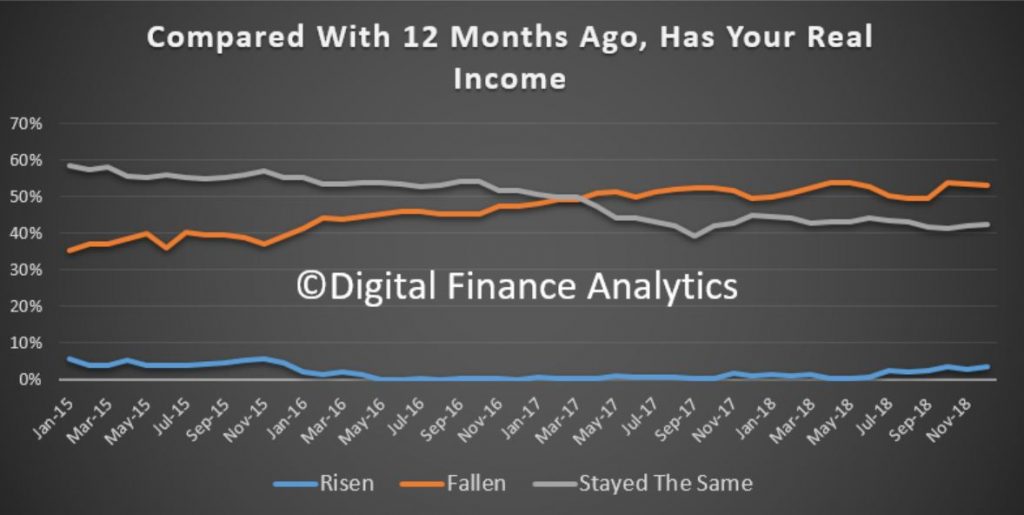
Household income remains under pressure, with many reporting no increase in real incomes in the past 5 years. Many households are working multiple jobs, and are still underemployed. In addition, the interest on deposits held with the banks have fallen significantly, as they trim their interest rates to protect their margins. 4% said their income in real terms had risen, 53% said it had fallen and 43% said there was no change.
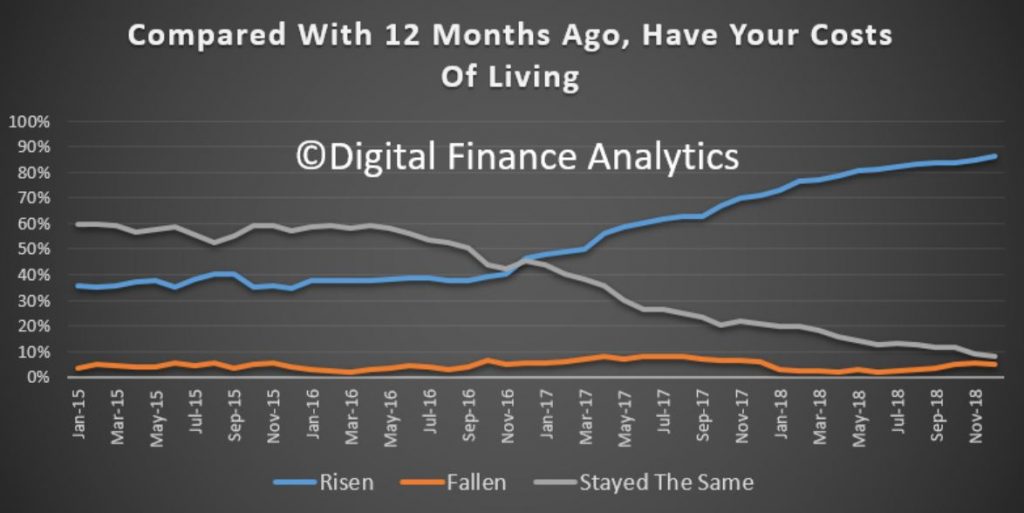
Households reported continued rising living costs in December with and additional 1.5%, or a total of 86% saying costs, in real terms had risen. 5% said they had fallen and 8% said there was no change. As well as the usual suspects – higher electricity costs, health care, child care and some food costs, a number of households reported rises in land tax as a concern. Once again the official CPI seems disconnected from the true experiences of many households, costs continue to rise and fast!
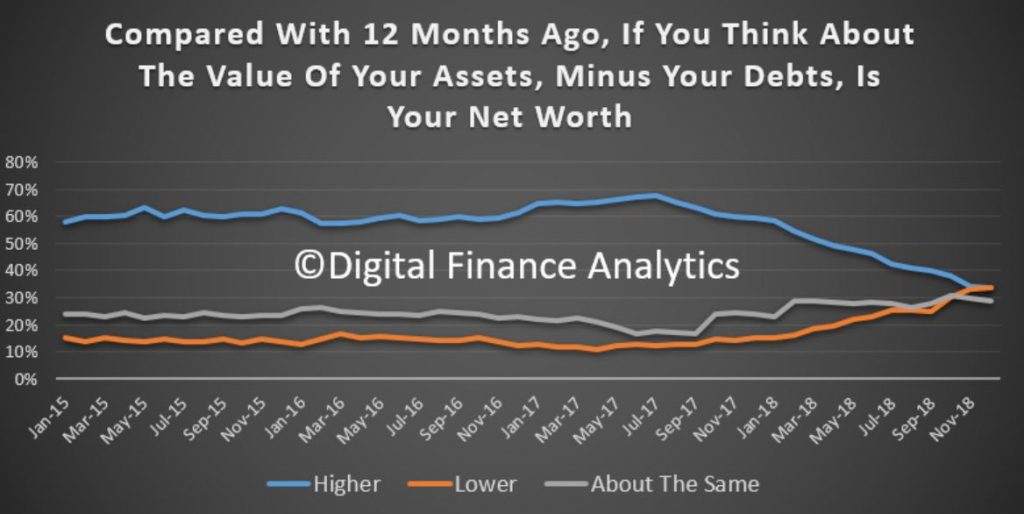
Finally, we look at Net Worth – Assets less loans owning. We see a rise in those reporting a fall, directly associated with the fall in home prices, 34% said their net worth had dropped in the past year, 33% said it had improved, and 29% said it was about the same. So whilst for some the “wealth effect” is intact, one third are feeling the effects of a reduction in wealth on paper, and as a result they are more cautious on their planned spending. This is sufficient to slow consumption ahead, and may well impact GDP as a result.
In summary then, we continue to see the same forces in play, in that as home prices slide and costs rise, household finances are under pressure. But the effects are not uniform, those with mortgages, and younger are most impacted. But the recent stock market ructions and lower returns on deposits are also biting.

By way of background, these results are derived from our household surveys, averaged across Australia. We have 52,000 households in our sample at any one time. We include detailed questions covering various aspects of a household’s financial footprint. The index measures how households are feeling about their financial health. To calculate the index we ask questions which cover a number of different dimensions. We start by asking households how confident they are feeling about their job security, whether their real income has risen or fallen in the past year, their view on their costs of living over the same period, whether they have increased their loans and other outstanding debts including credit cards and whether they are saving more than last year. Finally we ask about their overall change in net worth over the past 12 months – by net worth we mean net assets less outstanding debts.
We will update the index next month.
