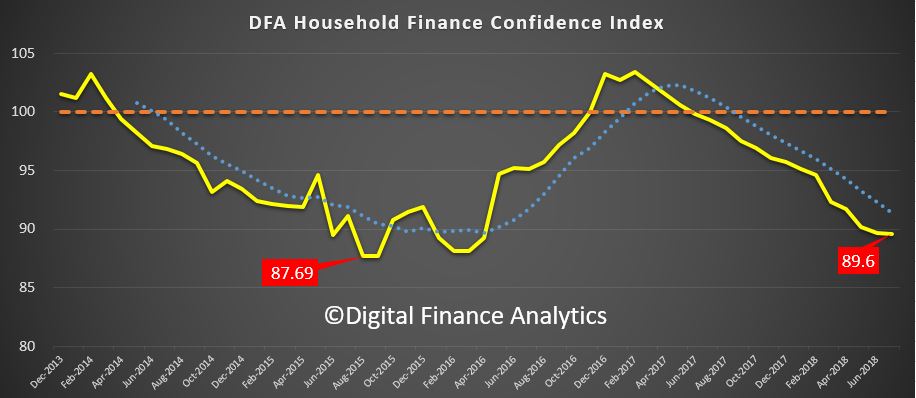
The latest edition of the DFA Household Financial Confidence Index to end July 2018 remains in below average territory, coming in at 89.6, compared with 89.7 last month. We had expected a bounce this month, in fact the rate of decline did slow, thanks to small pay rises for some in the new financial year, and refinancing of some mortgage loans to the “special” rates on offer currently. However, the index at this level is associated with households keeping their discretionary spending firmly under control. And the property grind is still impacting severely.
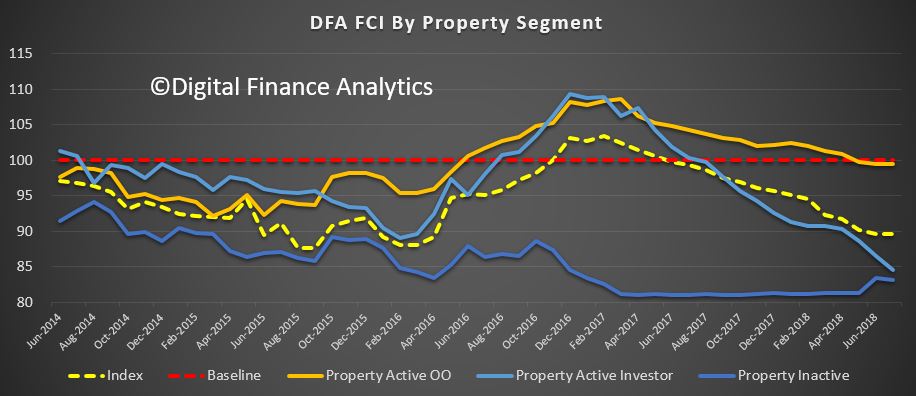
 Looking at the results by our property segmentation, owner occupied households overall remain around the neutral reading, while property investor confidence continues to fall, into territory normally associated with those who are renting or living with family. This signals significant risks in the property investment sector ahead.
Owner occupied property owners who have been able to refinance (lower LVR loans) have been able to shave their monthly repayments, while for some in rented accommodation they have found it easier to find a rental at a lower rent. Investment property holders reported continued concerns about servicing their loans, and of potentially higher interest rates ahead. Those on interest only loans were particularly concerned about their next reset review, given the tighter underwriting standards now in play. The peak of the resets however is well more than a year away.
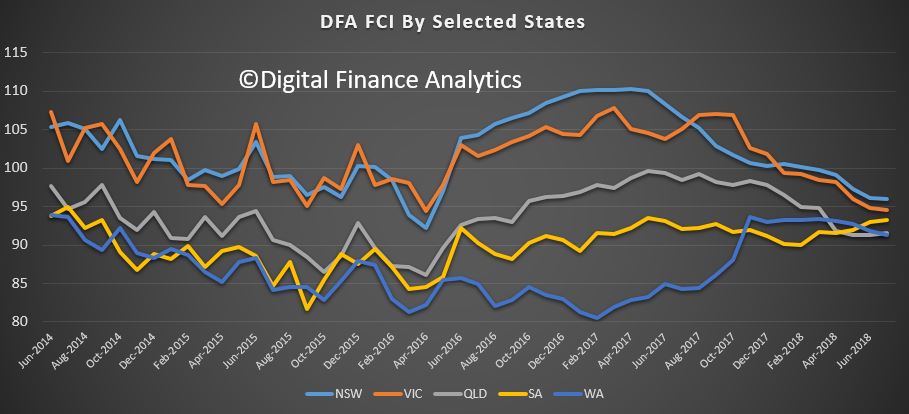
 The spread of scores across the states continues to bunch, as NSW and VIC households react to lower home prices. WA continues to show little real recovery in household finance (despite the hype) although there was a small rise in Queensland, thanks to recent pay lifts for some.
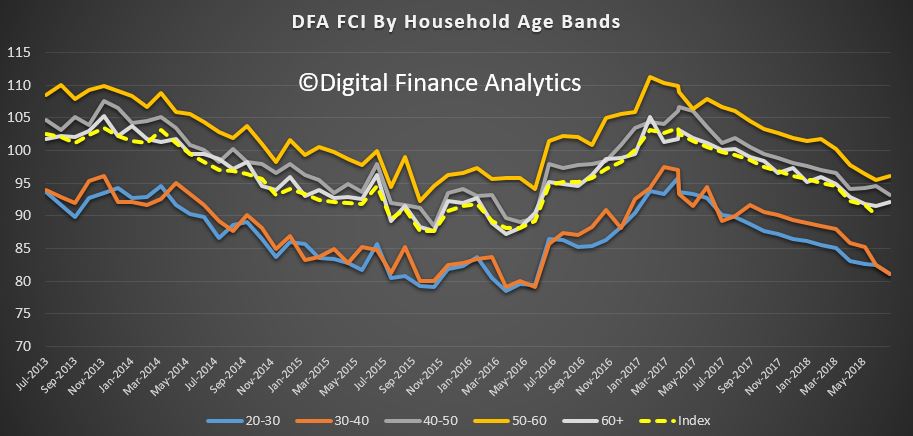
 Across the age bands, younger households remain the least confident, while those aged 50-60 were more bullish, thanks to recent stock market lifts, and access to lower rate refinance mortgages. The inter-generational dynamic is in full force, with younger households not in the property market seemingly unable to access the market (despite the recent incentives in NSW and VIC) and those with a property, and mortgage wrestling with the repayments.
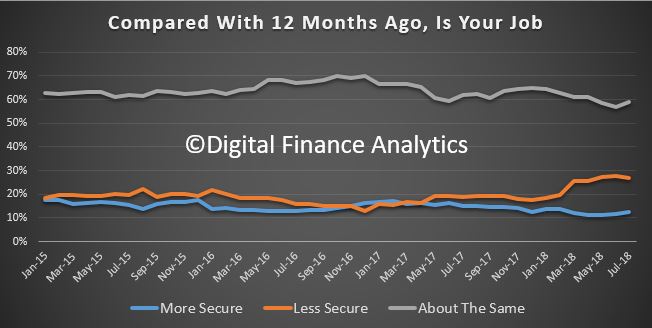
 Looking in more detail at the index components, job security improved a little this month, with 12.5% feeling more secure, up 0.67%, 27% less secure, down 0.92% and those about the same at 58.8%, up 2%. However, we see many households in multiple part-time jobs, and around 20% of households are actively seeking more work/hours.
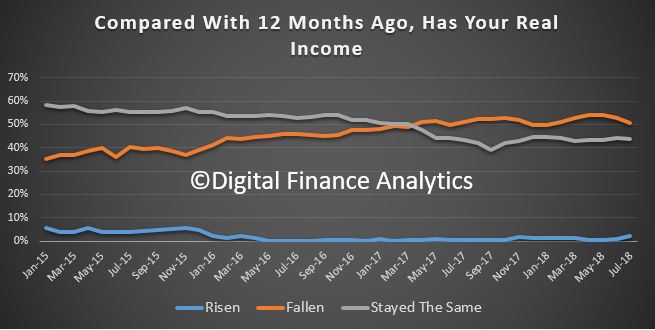
 There was a small rise in those reporting an income improvement, thanks to changes which kicked in from July. 2.3% said their income has improved, up 1.5% from last month, while 43.7% stayed the same, and there was a drop of 2.2% of those reporting a fall in income, to 50.5%.
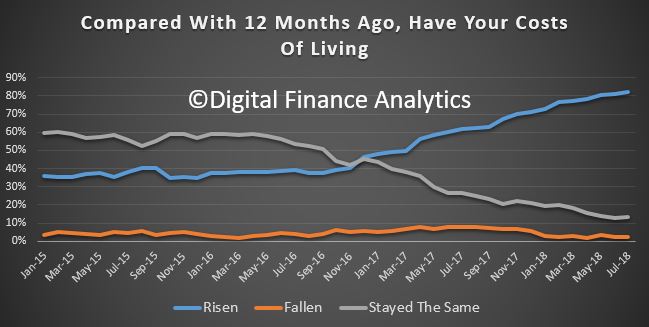
 Households continue to see the costs of living rising, with 82.3% reporting higher costs, up 1%, 13% reporting no change, and 2.5% falling. The usual suspects included power bills, child care costs, the price of fuel, plus health care costs and the latest rounds of council rate demands. The reported CPI appears to continue to under report the real experience of many households. Many continue to dip into savings to pay the bills.
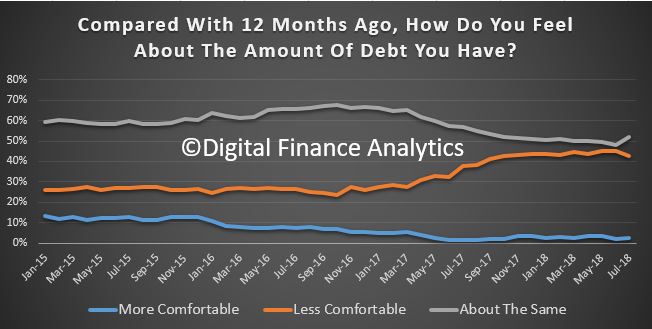
 In terms of debts outstanding, there was a small fall in those reporting they were less comfortable, with 42% reporting compared with 44% last month. This is attributable to changes in interest rates, and refinancing, especially for owner occupied households with a lower Loan to Income ratio. Many with large mortgages also have other debts, including credit cards and personal loans which also require servicing. Around 52% reported no change in their debt, up 3.5%. Property Investors were more concerned overall.
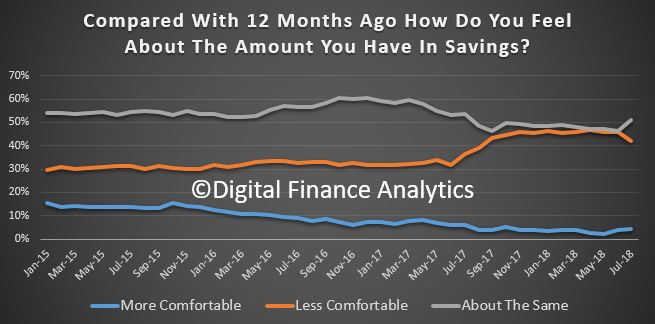
 Looking at savings, those with stocks and shares have enjoyed significant gains (at least on paper) and recent dividends, so tended to be more confident. Some were able to benefit from higher savings rates on selected term deposits, though rates attached to on-call accounts continue to languish as lenders manage their margins. Around a quarter of households have less than one months spending in savings, so many are facing a hand to month situation with regards to their finances. Many of these households are in the younger age bands and have no savings to protect them should their personal situations change.
We noted in the survey that a number of households were actively seeking alternative savings vehicles as property and bank deposits look less interesting. We will have to see whether these alternatives are as attractive (in terms of risk-return) as some are claiming. We have our doubts. But then risk is relative.
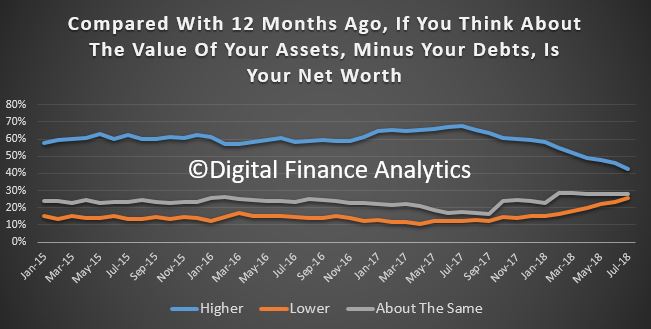
 So finally, putting this all together, the proportion of households who reported their new worth was higher than a year ago continues to slide as property price falls continue to hit home, and as savings are raided to maintain lifestyle. 42% said their net worth had improved, down 3.75% from last month. 25.6% said their net worth had fallen, up 2.5% and 28% reported no real change.
 We had expected to see a small bounce in the index this month as some incomes rise in the new tax year and other changes take effect. But the impact of the fading property sector, and cash flow constraints are likely to dwarf this impact. The only “get out of jail card” will be income growth above inflation, and as yet there is little evidence of this occurring. Thus we expect the long grind to continue.
Finally, the spate of attractor rates from the banks continues, in an attempt to keep mortgage volumes up. However, our research shows that many households cannot access them in the new tighter lending environment.
By way of background, these results are derived from our household surveys, averaged across Australia. We have 52,000 households in our sample at any one time. We include detailed questions covering various aspects of a household’s financial footprint. The index measures how households are feeling about their financial health. To calculate the index we ask questions which cover a number of different dimensions. We start by asking households how confident they are feeling about their job security, whether their real income has risen or fallen in the past year, their view on their costs of living over the same period, whether they have increased their loans and other outstanding debts including credit cards and whether they are saving more than last year. Finally we ask about their overall change in net worth over the past 12 months – by net worth we mean net assets less outstanding debts.
We will update the index next month.

