This is starting to look serious as the latest DFA household financial confidence index results for January 2019 reveals a further decline in levels of confidence.
The index fell to 87 in January, down from 87.3 in December, the lowest its been since the survey commenced, well below the neutral setting of 100.
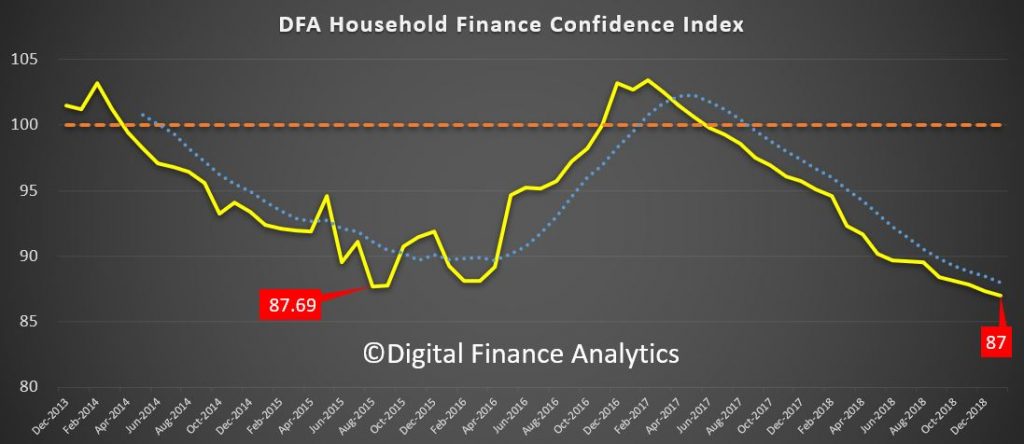
By way of background, these results are derived from our household surveys, averaged across Australia. We have 52,000 households in our sample at any one time. We include detailed questions covering various aspects of a household’s financial footprint. The index measures how households are feeling about their financial health. To calculate the index we ask questions which cover a number of different dimensions. We start by asking households how confident they are feeling about their job security, whether their real income has risen or fallen in the past year, their view on their costs of living over the same period, whether they have increased their loans and other outstanding debts including credit cards and whether they are saving more than last year. Finally we ask about their overall change in net worth over the past 12 months – by net worth we mean net assets less outstanding debts.

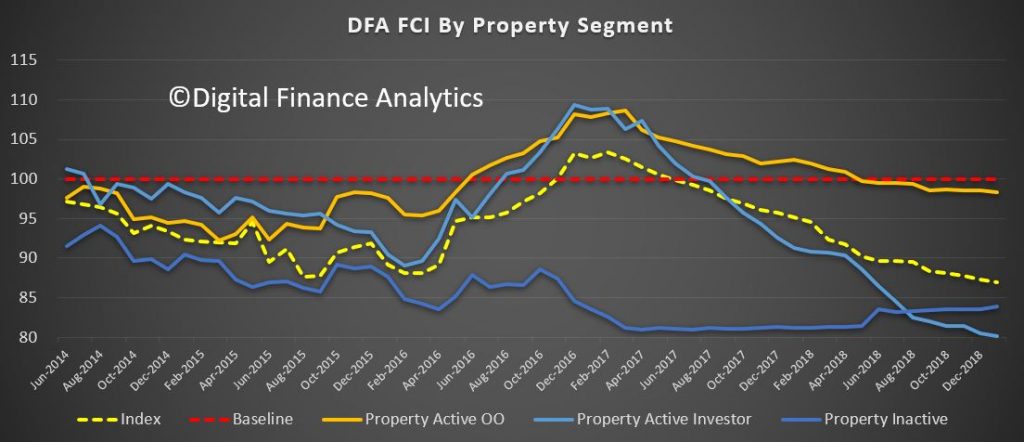
Looking at the results by property segments, we see a fall in confidence among property investors, as home prices and rental yields continue to fall, and reflecting concerns about potential changes to negative gearing and capital gains ahead. That said, purchase interest has risen a little. We will discuss this later.
Owner occupied borrowers are also feeling the heat, reflecting some mortgage price pain, as well as the basic affordability issues. Those renting however are a little more positive relatively speaking, thanks to rents being lower now and a greater choice of property for rent being available, especially in Sydney. Overall investors are the least confident now, a considerable switch from a year or so ago!
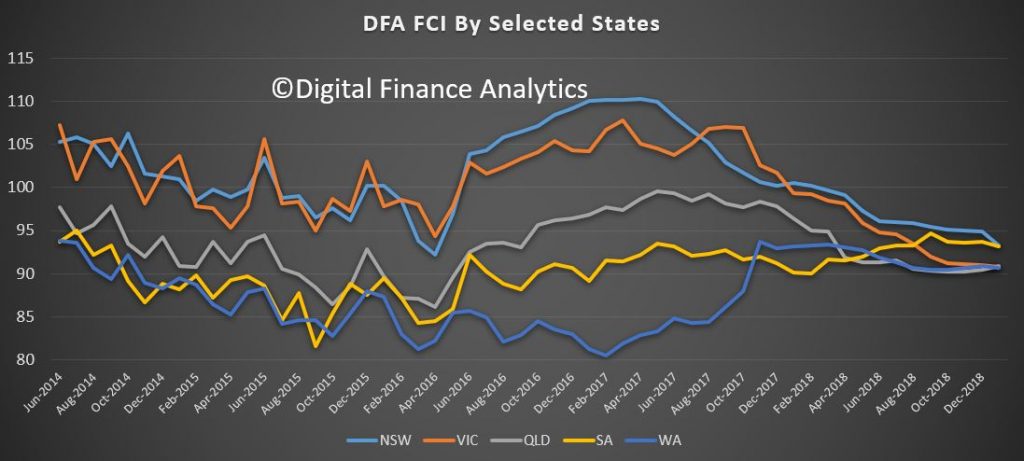
Cutting the data by states, we see that the bunching continues as property price falls in Sydney and Melbourne erode confidence there, relative to the other states. The most significant fall was in NSW, as home prices fall – and the fall out from Opal Tower had an impact more broadly on new purchases, and off the plan commitments.
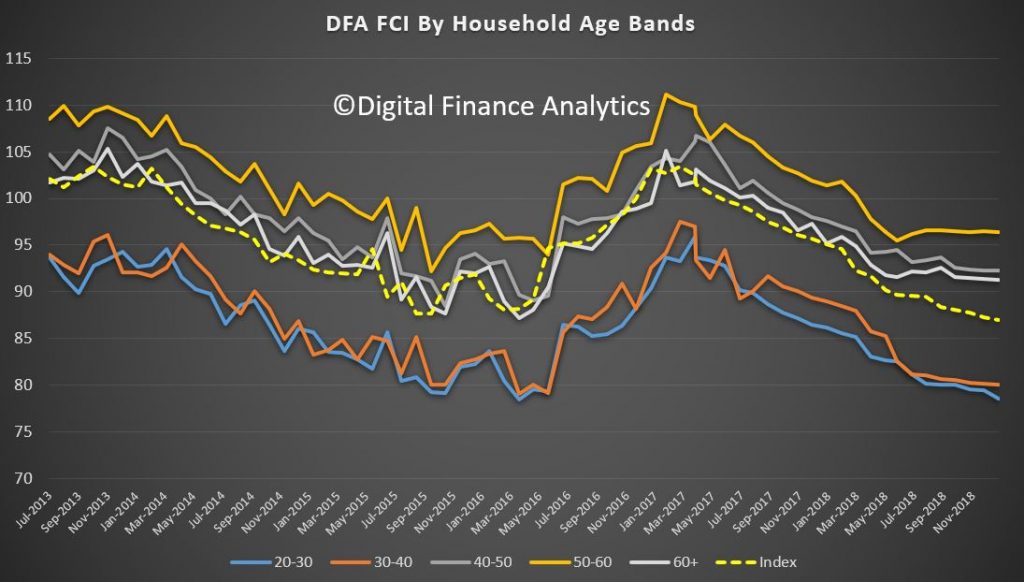
Across the age ranges we continue to see weakness, with younger households more exposed, although those older households with share market investments saw a rebound in January, which boosted their confidence a little.
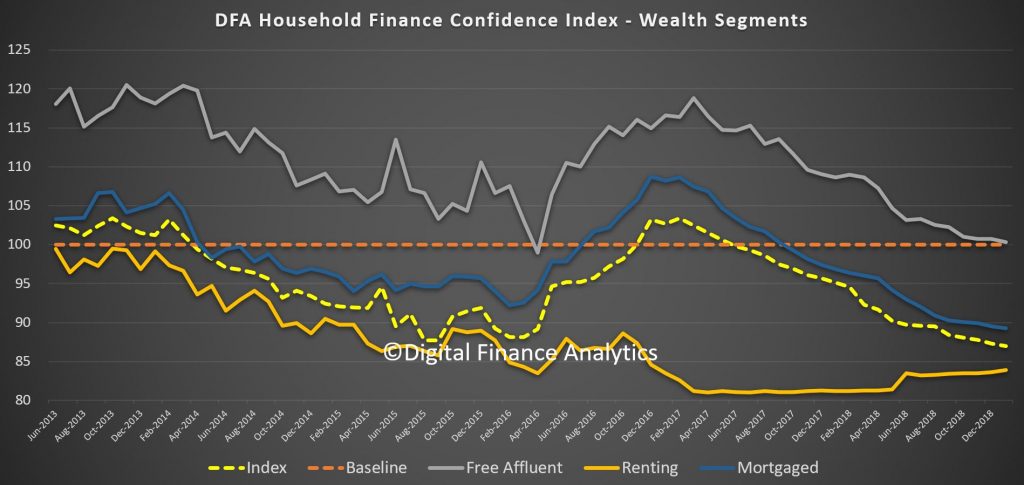
Turning to our wealth segments, we continue to see property owners without a mortgage the most confidence, though falling close to the long term neutral benchmark, while those with mortgages (either investor or owner occupied) continue to decline. Renters remain the least confident. This could become an important indicator in the run up to the next election, in that even those heartland voters supporting the incumbent Government are less positive than usual.
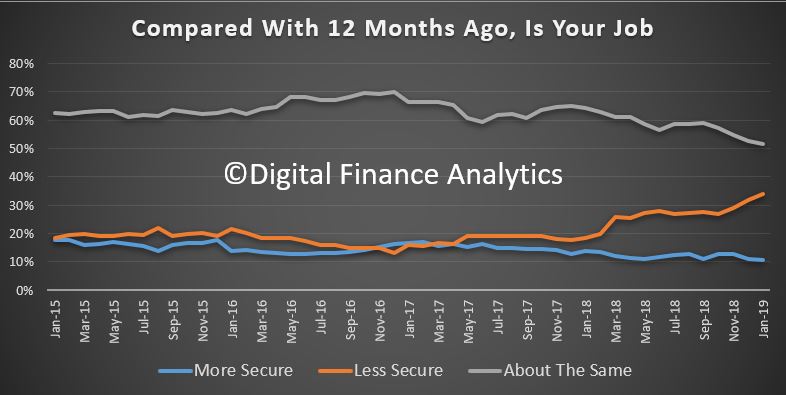
We can then examine the moving parts within the index. We start with job confidence. Those feeling more secure about their job prospects fell 2.19% to 10.57%, while those feeling less confident rose 4.84% to 33.85%. 51.68% saw no change, but that fell by 3.30%. There was a noticeable rise of concerns in the construction sector as building approval momentum falls.
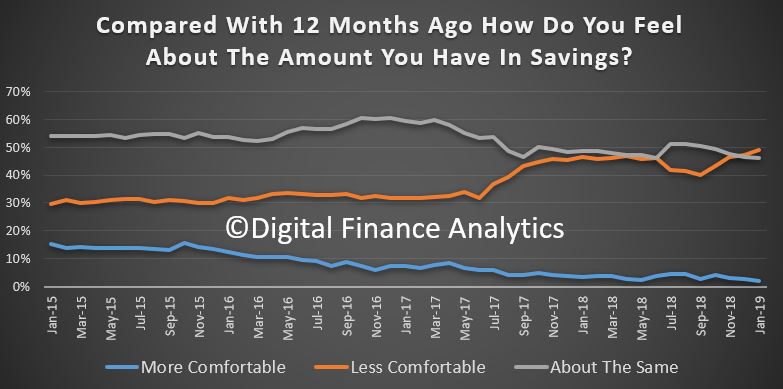
Savings rates continue to fall for many, and others are raiding what savings they have to maintain their lifestyles – something which of course cannot continue indefinably – one reason why the savings ratio continues to fall. June 1.98% of households were more comfortable than a year ago, down 1.28%, while 48.96% were less comfortable, a rise of 2.52%. 46.24% were about the same, down 1.56%.
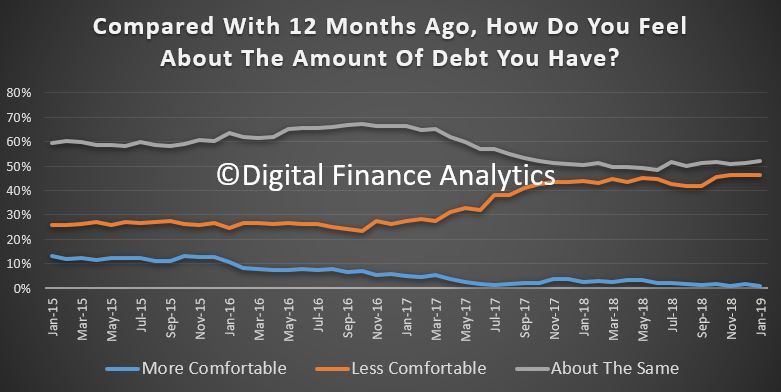
Turning to debt, 1.11% of households are more comfortable than a year ago, and 52% are about the same. 46% are less comfortable than a year back, thanks to rising rates, switches to interest and principal from interest only loans and problems in servicing the repayments. We also continue to see growth in quasi credit such as Afterpay, as well as other forms of short term credit. Household debt of course continues to rise faster than incomes or inflation.
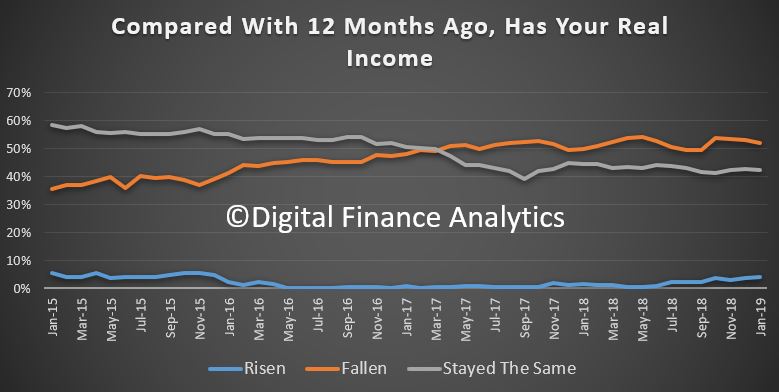
Income growth remains a real concern for many households (in real terms many have seen falls in recent years). 3.88% of households reported their real incomes had grown in the past year, 51.99% said incomes had fallen in real terms, and 42.5% said there had been no change. We continue to observe pressure on the income side of household balance sheets, despite the RBA’s expectation that wages will rise eventually. One bright spot was dividend payments which were higher, but this failed to offset the total picture.
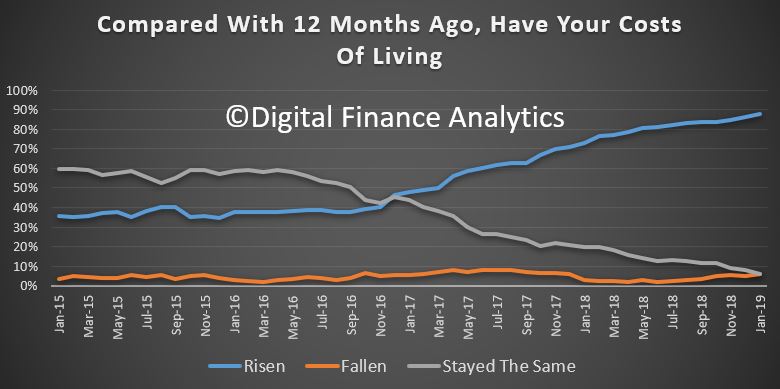
One of the killer categories is the costs of living. Once again we think the CPI figures just do not reflect the lived experience of many households. 87.75% said their costs had risen over the past year, up 3.2%. This includes the old favorites, electricity, child care, health care, and household staples, despite a fall in costs of fuel at the bowser.
And finally, household net worth continues to take a dive thanks for falling home prices – this despite recent positive share price moves. Overall 32.18% of households sand their net worth had improved, down 1.82% from last month, 37.28% said their net worth had fallen, up 4.05% and 27.42% said there had been no change, down 2.52%.
One other interesting point which came out from the analysis is that potential property investors are more active now, thanks to the falls in asking prices, and importantly, the burning fuse with regards to ending negative gearing should Labor win the next election. Thus we have seen a rise in investors considering transacting. Some lenders are offering “special” fixed rate offers, in the light of APRA’s hands off approach, and of course Hayne did not do anything on responsible lending. The tighter underwriting standards are still in play of course – for now – but I would not bee surprise to see a kick up in new investor lending in the weeks ahead, despite the lower levels of financial confidence.
In summary then, interesting times as household finances are squeezed, yet the fixation on property for many Australians remains strong. There is still a belief that falls will be limited, and they will bounce back. We are not so sure!
We will update the index next month.

– “Investors are back” ? That shows how powerful the property propaganda is.
– The biggest risk is and remains – in my opinion – the reset from “Interest Only” to “Principal & Interest”. MACROBUSINESS has charts that show that the amount of resets was (comparitively) minimal in 2018. The amount of resets in each of the years 2019,2020 and 2021 will be larger than those in 2018. When I remember correctly those resets will be about 3 times larger in each of these 3 years when compared to 2018. I think I still have the chart.
– Does DFA/Mr. North have data that show in which e.g. regions/postcades the bulk of those resets are going to take place ? Are the bulk of the resets also tied to the regions/postcodes that saw high sales volumes at the peak of the property market ? Or is it more widespread e.g. also in the more affluent postcodes/subusrbs ?