From the St. Louis Fed On The Economy Blog.
How are government deficits financed, and what are the implications for monetary policy and inflation?
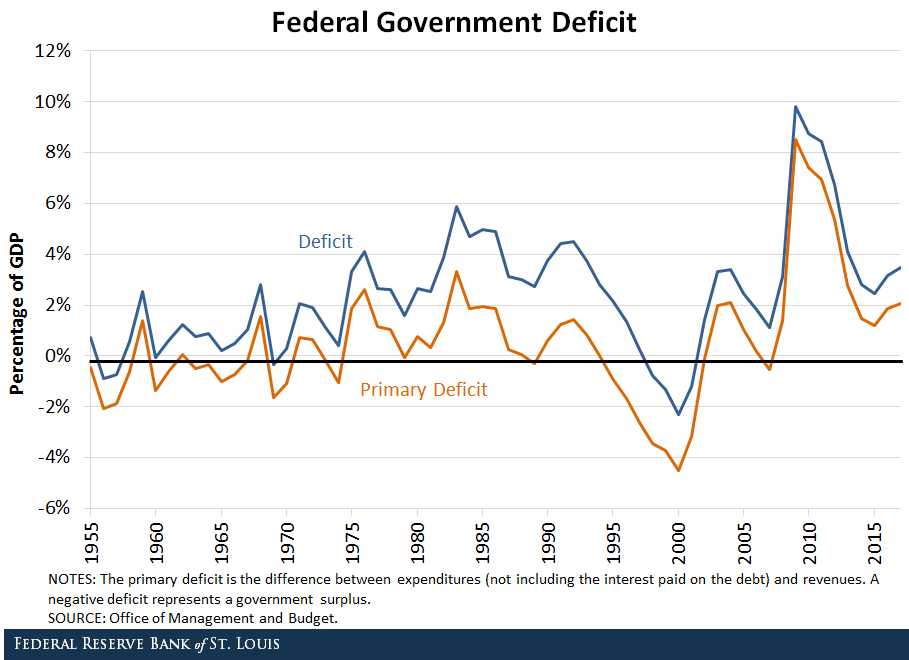
The deficit is defined as the difference between expenditures (including the interest paid on debt) and revenues. If the difference is negative, we get a surplus.
Between 1955 and 2007, the deficit of the U.S. federal government averaged about 1.9 percent of gross domestic product (GDP). In the decade since, the deficit averaged about 5.3 percent of GDP. Roughly two-thirds of this increase is attributable to larger expenditures.
Federal Debt Expansion
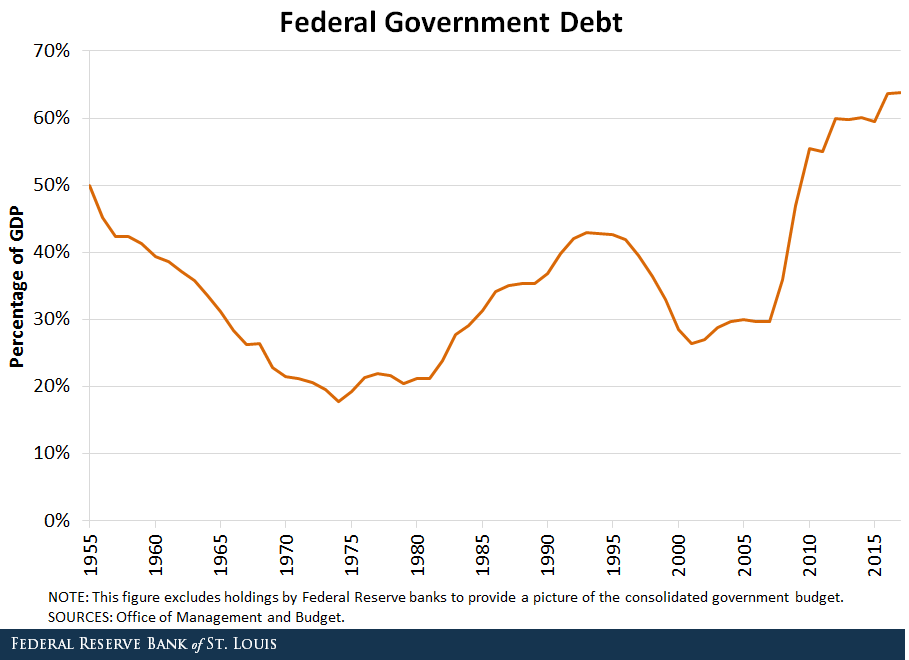
Deficits are financed by issuing debt. Since 2007, the federal debt in the hands of the public has grown at an average annual rate of 11 percent.1 As a share of GDP, it went from about 30 percent in 2007 to almost 64 percent as of the end of fiscal year 2017.2
According to the Financial Accounts of the United States, about 40 percent of this debt expansion was absorbed by foreigners, mostly in Japan and China.3
Before Congress approved the tax cut package in December, deficits and the debt were expected to grow significantly over the next decade.4 The new tax plan is expected to add further to the deficit. Though estimates of how much have varied widely, the most recent put the increase in the deficit over the next 10 years at about 10 percent.5,6
What Can Monetary Policy Do?
By influencing interest rates, the Fed can affect the servicing cost of debt. The current path of monetary policy normalization will imply generally higher interest rates, which will add to the deficit and require the Treasury to issue even more debt, raise taxes or reduce expenditures.
Federal revenues are supplemented by Federal Reserve remittances. These have been unusually large in recent years, about 0.5 percent of GDP, due to the Fed’s large balance sheet. Monetary policy normalization contributes to the expected increase in the deficit, since remittances are expected to decline to historical levels as the Fed’s balance sheet contracts.
The burden of debt can also be alleviated with higher inflation. This is not unprecedented in the United States. For example, after World War II, high inflation was used to finance part of the accumulated debt.7 Arguably, in the post-Paul Volcker era, the Fed has enjoyed increased independence and has not been very accommodative to the Treasury.
Inflation Becoming a Fiscal Phenomenon
However, as government debt has increasingly become more widely used as an exchange medium in large-value transactions (either directly or indirectly as collateral), the control of the “money” supply has shifted away from the Fed. In other words, the more cash, bank reserves and Treasuries resemble each other, the more inflation depends on the growth rate of total government liabilities and less on the specific components controlled by the Fed (i.e., the monetary base).
Thus, inflation becomes more of a fiscal phenomenon. Traditional monetary policy tools, such as swapping reserves for Treasuries, may be less effective in controlling it.
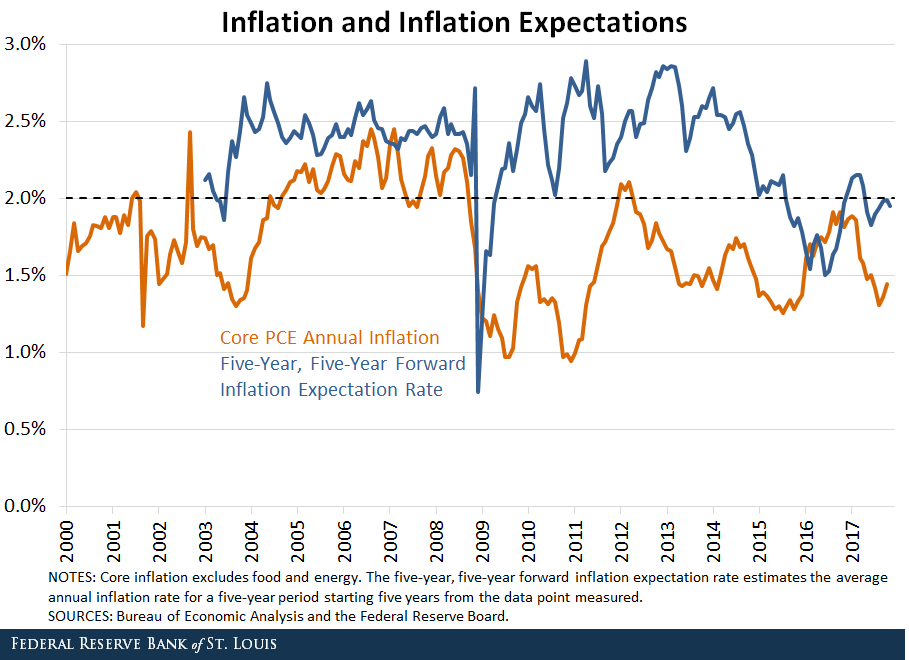
Though government debt has expanded significantly in recent years and is expected to continue growing, inflation and inflation expectations have not diverged far away from the Fed’s target of 2 percent annually. The likely reason is that demand for government liabilities has kept pace with the growth of the supply.
In this sense, during and after the financial crisis of 2007-08, there was a big appetite for U.S.-dollar denominated safe assets. As mentioned at the beginning of this post, 40 percent of the debt increase since the crisis has been absorbed by foreigners.
The high demand for U.S. Treasuries may continue or may reverse. If taste for U.S. debt declines, the projected deficits (with their associated debt expansion) may imply an increase, potentially significant, in inflation in the long run.
In this last scenario, the Fed would face a difficult challenge if facing a strong-headed Treasury and Congress that refuse to lower the deficit in the long run. Increasing interest rates—as during the Volcker disinflation, but now in an era of liquid government debt—may only exacerbate the deficit problems and do little to lower inflation.
Notes and References
1 The official figures of “Debt in the hands of the public” include holdings by the Federal Reserve Banks. I have netted those out since we are looking at the consolidated government budget.
2 The U.S. government’s fiscal year begins Oct. 1 and ends Sept. 30 of the subsequent year and is designated by the year in which it ends.
3 Martin, Fernando. “Who Holds the U.S. Public Debt?” Federal Reserve Bank of St. Louis On the Economy Blog, May 11, 2015.
4 Martin, Fernando M. “Making Ends Meet on the Federal Budget: Outlook and Challenges.” The Regional Economist, Third Quarter 2017, pp. 16-17.
5 For example, see Jackson, Herb. “Deficit could hit $1 trillion in 2018, and that’s before the full impact of tax cuts,” USA Today, Dec. 20, 2017; and The Associated Press. “The Latest: Estimate says tax bill adds $1.46T to deficit.” Dec. 15, 2017.
6 The Joint Committee on Taxation, the Senate’s official scorekeeper, estimates the deficit increase at about $1.5 trillion; the committee’s macroeconomic analysis of the “Tax Cuts and Jobs Act” is available here (JCX-61-17).
7 Postwar inflation (1946-1948) is estimated to have resulted in a repudiation of debt worth about 40 percent of output. See Ohanian, Lee E. The Macroeconomic Effects of War Finance in the United States: Taxes, Inflation, and Deficit Finance. New York, N.Y., and London: Garland Publishing, 1998.


