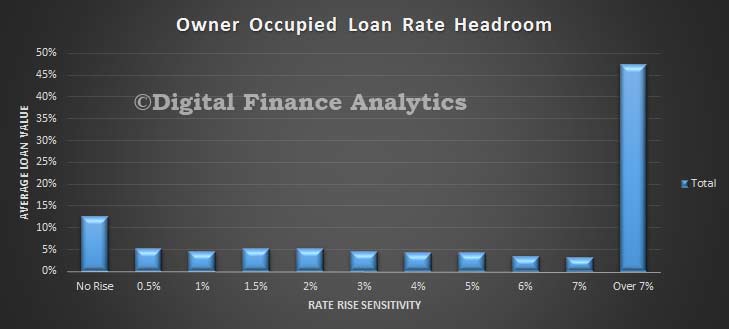
Continuing our analysis of the impact of rate rises on mortgage holders, today we turn from investors (where we showed that a considerable proportion would be in difficulty if rates rose even a little), to look at owner occupied borrowers. For this snapshot we are only looking at households loans for occupation, so exclude investment loans from the picture (later we will combine the two). Again we use data from our surveys to assess how much of an interest rate rise households felt they could cope with, without getting into financial difficulties. “No Rise” means any lift in rate would be a problem. The remaining values show where a households tipping point is. (For example, if rates rose 2%, then the proportion of households under stress would be the sum of No Rise, 0.5%, 1%, 1.5% and 2% = 32% of households.)
We start with a summary view. This shows that about 13% of households with an owner occupied loan would be in financial discomfort if rates were to rise at all. This is a smaller proportion than we showed for investment property recently which was 27%. However, more than one third of households said they would be in difficulty if rates rose by 3%.
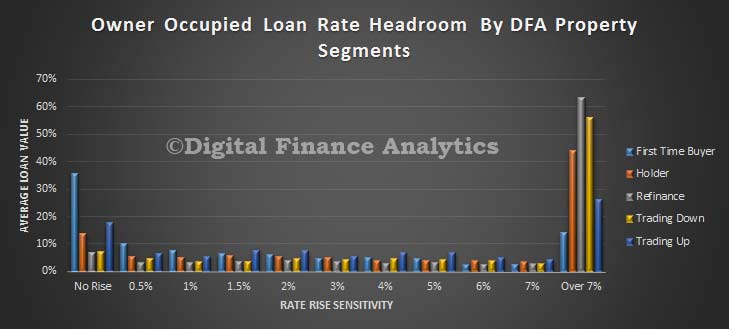
 Drilling into the segmented data using the DFA property segments, we see that 35% of first time buyers would have difficulty if rates were to rise at all, and 18% of those trading up would be in pain. In both cases, these groups had large recent mortgages at higher LVR’s.
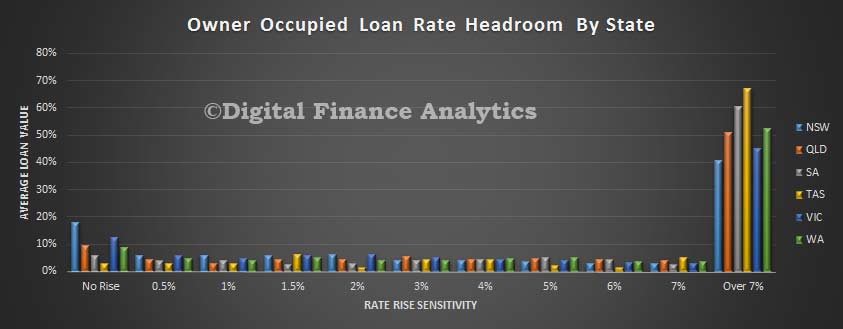
 The state by state analysis shows that households in NSW and VIC are the most exposed to potentially rising rates, thanks to larger mortgages and higher loan-to-income (LTI) metrics. QLD and TAS households are somewhat exposed thanks to static income. Those in WA, have enjoyed high incomes in recent times, so despite high prices, are more insulated – though this could change with the re-balancing of the economy from the mining sector.
 If we drill into the regions within states – and using NSW as an example – we see that more than 20% of those under pressure are in the Central Coast, and 27% are in the Sydney metro area – significantly correlated with recent high house prices. Other areas are less exposed to rate rises (though other risks, such as employment may be higher – refer to our earlier probability of default analysis).
 Finally, if we cut the data by the DFA master household segments, we see that there are two which stand out. Those segments which are more affluent – Exclusive Professionals, and Young Affluent are more exposed, thanks to their higher leverage into property – they have the capacity to borrow more, and buy more expensive real estate. We also see a number of young growing families and wealthy seniors potentially exposed.
 So once again we find a proportion of households on the brink of difficulty, and with little headroom to accommodate potential interest rate rises. Rates are currently very very low, and will probably remain that way for some time, but there are no guarantees. We also found that households who borrowed in the earlier part of 2015 were more exposed because lender underwriting criteria were more generous than in recent times, especially considering income multiples and LVR’s. However once again we see evidence that some households do not have the 2-3% interest rate buffer which the current APRA guidelines suggest.
Next time we will combine our owner occupied and investment loan analysis. We suspect for many households it will not look pretty!

One thought on “How Sensitive Are Owner Occupied Mortgage Holders To Rising Interest Rates”