From The St. Louis Fed On The Economy Blog.
The new incoming president and Congress will likely engage in vigorous discussions about economic policies, including ones that will impact the national debt.
This post will give a thumbnail report on the recent history of this important macroeconomic indicator.
Economists typically measure the size of the national debt as the ratio of the total publicly held federal debt to the current level of the gross domestic product (GDP). By looking at only publicly held debt, the measure excludes government bonds owned by the government itself, such as those in the Social Security Administration’s portfolio. In scaling the debt by GDP, the resulting ratio accounts for the fact that a larger economy may more easily sustain a larger debt.
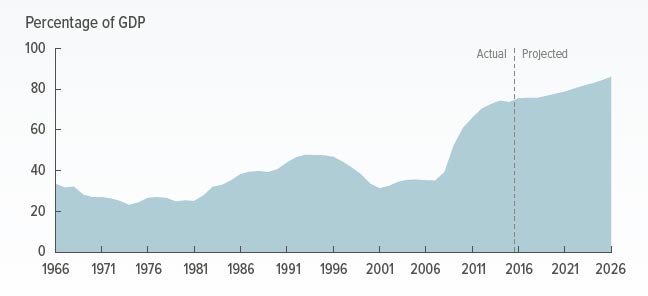
In the six or so years preceding the most recent recession, the debt-to-GDP ratio was relatively constant, around 34 percent. Although stable, it still sat relatively close to its post-World War II era peak experienced in the mid-1990s.
This stability was upset dramatically with the onset of the recession. The federal debt increased largely because falling incomes led to lower tax receipts. Also, unemployment and poverty rose, which increased the cost of social insurance programs such as Medicaid and unemployment insurance. The figure below shows average increases in the debt-to-GDP ratio for the past 10 years. (Each year is as of the second quarter.)
In the two years containing the 2007-09 recession, the debt-to-GDP ratio grew by about 16 percentage points. By the second quarter of 2009, this ratio equaled 50 percent.
Following the recession, there was no (at least successful) effort to bring this ratio down. Instead, a number of factors, including the implementation of the $840 billion American Recovery and Reinvestment Act, caused the debt-to-GDP ratio to increase at a rapid pace. Between 2009:Q2 and 2012:Q2, the ratio increased by 6.2 percentage points on average per year.
In the following three years, a dramatic slowdown in the growth rate of the debt-to-GDP ratio returned. It grew by 1.4 percentage points on average per year over that period.
This relatively slow pace of increase seems to have quickened over the past year. Between 2015:Q2 and 2016:Q2, the ratio increased by 2.9 percentage points. During that one-year period, the debt-to-GDP ratio crossed the 75 percent level for the first time in most Americans’ lifetimes. 2016 put the ratio at its highest value since the WWII drawdown.


