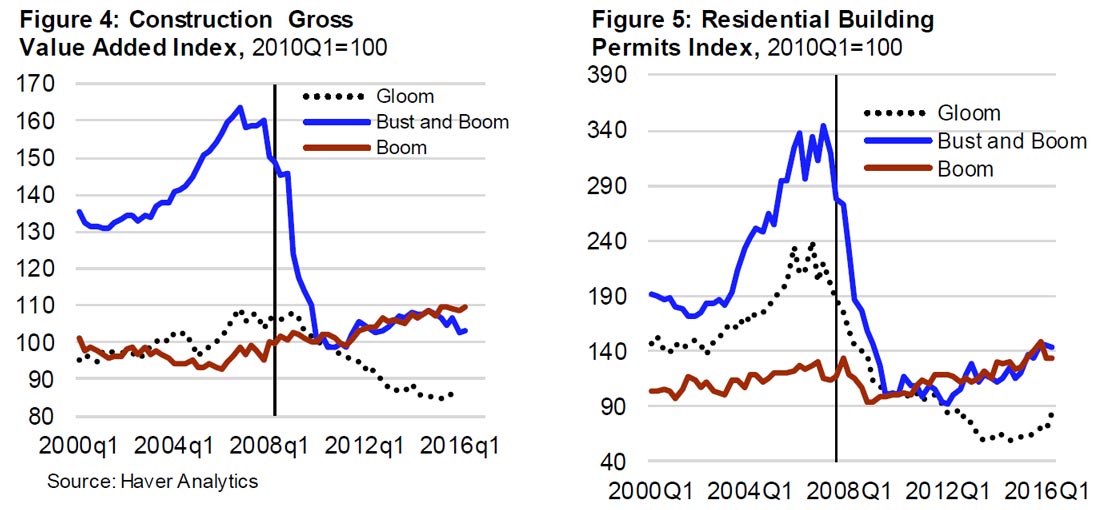
The latest IMF’s Global House Price Index—an average of real house prices across countries—is now almost back to its level before the financial crisis. But there are significant variations, and policy responses.
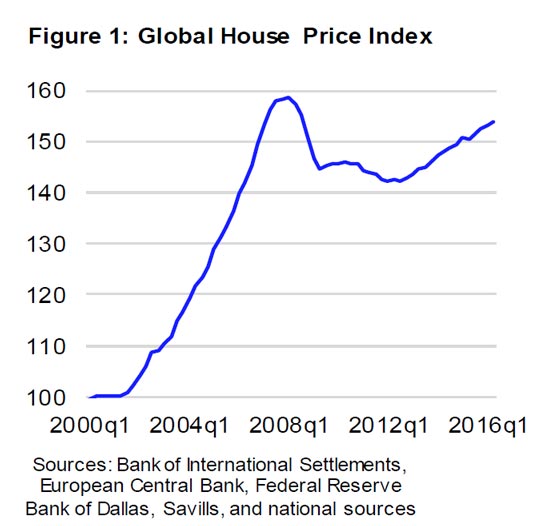 Developments in the countries that make up the index fall into three clusters. The first cluster—gloom—consists of 18 economies in which house prices fell substantially at the onset of the Great Recession, and have remained on a downward path. The second cluster—bust and boom— consists of 18 economies in which housing markets have rebounded since 2013 after falling sharply during 2007-12. The third cluster—boom—comprises 21 economies in which the drop in house prices in 2007–12 was quite modest and was followed by a quick rebound.
 Gloom = Brazil, China, Croatia, Cyprus, Finland, France, Greece, Italy, Macedonia, Morocco, Netherlands, Poland, Russia, Serbia, Singapore, Slovenia, Spain, Ukraine.
Bust and boom = Bulgaria, Denmark, Estonia, Germany, Hungary, Iceland, Indonesia, Ireland, Japan, Latvia, Lithuania, Malta, New Zealand, Portugal, South Africa, Thailand, United Kingdom, United States.
Boom = Australia, Austria, Belgium, Canada, Chile, Colombia, Czech Republic, Hong Kong SAR, India, Israel, Kazakhstan, Korea, Malaysia, Mexico, Norway, Peru, Philippines, Slovak Republic, Sweden, Switzerland, Taiwan.
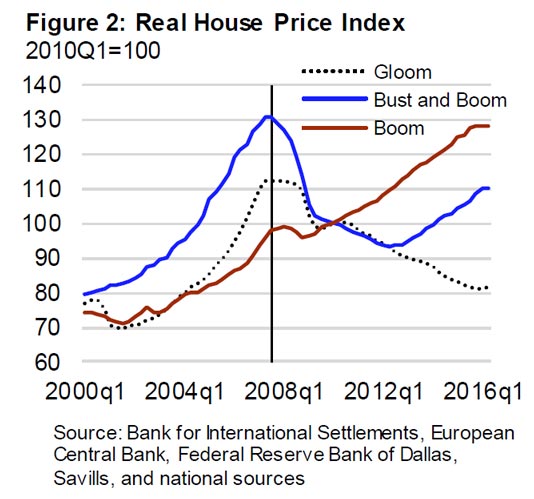
Credit has expanded much faster in the boom group than in the other two.
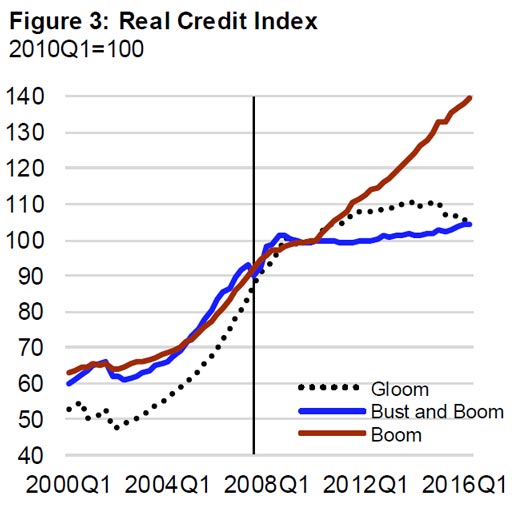 Construction gross value added and residential building permits have stagnated in the gloom group relative to the other two.
In China, excess inventory remains high. The IMF assessment points out that for lower-tier cities, where multi-year excess inventory levels are particularly acute, restricting new starts seems warranted, for example by tightening prudential measures on credit to property developers.
In Netherlands, the turnaround in house prices presents an opportunity to remove some of the incentives for excessive leverage—thereby reducing the likelihood and intensity of boom-bust cycles.
There are some concerns about sustainability in a few boom or bust and boom economies:
IMF assessments state that in Belgium, Canada, Luxembourg, Malaysia, Malta, and the United Kingdom, additional macroprudential measures may be needed or considered if housing market vulnerabilities intensify.
In the case of Norway, the IMF assessment points to a substantial overvaluation. In some other cases—Belgium, Korea, and Morocco—the assessments do not find overvaluation.
IMF assessments point to supply constraints as a factor driving house prices in a number of countries where prices have rebounded, including Denmark, Germany, New Zealand, and the United Kingdom.
Many countries have been actively using macroprudential tools to manage house price booms. The main macroprudential tools employed for this purpose are limits on loan-to-value ratios and debt-service-to-income ratios and sectoral capital requirements.
Figure 6 shows that macroprudential policies have been very active in the boom group, followed by gloom group, and bust and boom group.
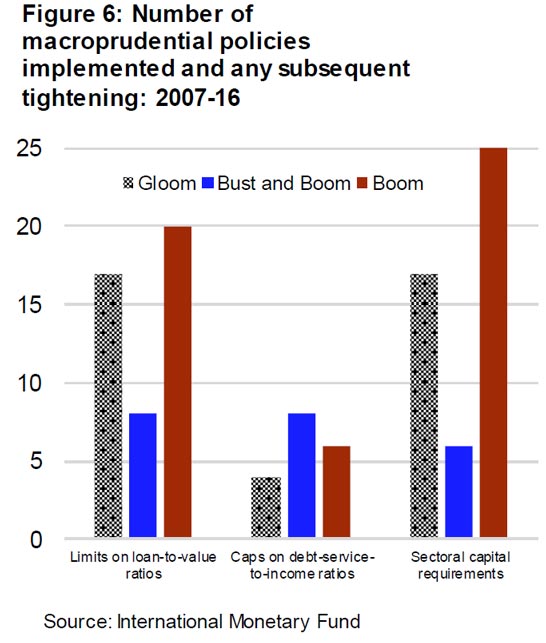 Loan-to-value ratios: Gloom = Brazil, China, Finland, Netherlands, Poland, Serbia, Singapore, Spain. Bust and boom = Estonia, Hungary, Iceland, Indonesia, Latvia, Lithuania, New Zealand, Thailand. Boom = Canada, Chile, Czech Republic, Hong Kong, Israel, Korea, Malaysia, Norway, Philippines, Slovak Republic, Sweden, Taiwan.
Debt-service-to-income ratios: Gloom = Cyprus, Netherlands, Poland, Serbia. Bust and boom = Estonia, Hungary, Ireland, Latvia, United Kingdom, United States. Boom = Canada, Hong Kong, India, Israel, Malaysia, Norway.
Sectoral capital requirements: Gloom = Brazil, Croatia, France, Italy, Poland, Russia, Serbia, Spain. Bust and boom = Bulgaria, Estonia, Iceland, Ireland, Latvia, Lithuania, New Zealand, South Africa, Thailand, United Kingdom, United States. Boom = Australia, Belgium, Colombia, Hong Kong, India, Israel, Korea, Malaysia, Norway, Peru, Slovak Republic, Switzerland, Taiwan.

