VIX Is Low, Overvaluation Risk Is Not
Overvaluation does not preclude an even higher market value of common stock relative to current and expected corporate earnings. Moreover, provided that the now extraordinarily low VIX index stays under 11.8, a further narrowing by corporate bond yield spreads is likely. However, an increasingly overvalued equity market favors a higher VIX index.
A convincing explanatory model for the high-yield bond spread employs measures of default risk and business activity, in addition to the VIX index. This model recently predicted a 411 bp midpoint for the high-yield spread, which eclipses its recent actual gap of 394 bp. By the way, the latter is the thinnest high-yield spread since September 2014.
What is now the lowest predicted midpoint since April 2015 owes much to an ultra-low VIX index. After removing the VIX index from the explanatory model, the predicted midpoint for the high-yield spread widens to 456 bp. (Figure 1.)
Record highs for stocks, not so for profits
For the first time ever, the blue-chip Dow Jones Industrial average broke above 20,000. Meanwhile, the market value of all US common stock as measured by the Wilshire Index set a new record high.
Nevertheless a popular measure of core profits, though improving, remains well under its apex. Since the moving yearlong estimate of pretax profits from current production peaked at the end of March 2015, the market value of US common stock has climbed higher by 10%. By contrast, the consensus estimates that for the year-ended March 2017, core pretax profits will still trail March 2015’s zenith by -5%. Moreover, the consensus does not expect yearlong profits to eclipse its record high until 2018’s second quarter.
As inferred from the different directions taken by share prices and profits since March 2015, the US equity market is richly priced, if not significantly overvalued. However, overvaluation does not promise impending doom for share prices.
For example, during 1998-2000’s stock market frenzy, though overvaluation first resembled today’s excesses in 1998’s second quarter, the market value of US common stock continued its ascent until March 2000 despite becoming increasingly overvalued. Amazingly, notwithstanding the accompanying -7% drop by yearlong profits from December 1997’s peak, the market value of US common stock managed to soar by a cumulative 49.5% from 1997’s final quarter through the first quarter of 2000.
Not surprisingly, March 2000’s unprecedented overvaluation of equities set the stage for a cumulative -43% plunge to October 2002’s bottom. Granted that today’s overvaluation falls considerably short of the excesses of late 1998 through early 2000, buying into an overvalued market necessarily entails above-average risk.
Based on the historical record, the current rally may not expire soon. Absent another extended bout of profits deflation, the US equity market is likely to set new records regardless of today’s overvaluation. For now, the consensus expects pretax operating profits to grow through 2018.
Interest rate risk now poses the biggest danger to stocks.Nevertheless, substantially higher interest rates could temporarily drive the market value of US common stock down by at least -5%. Sharply higher interest rates previously outweighed the positive effect of profits growth and temporarily sank share prices in 1994 and late 1987. In both instances, deep declines by interest rates allowed profits to re-assume its leading role as the primary driver of equity valuation.
Incredibly, 1987’s outsized 19% annual advance by core profits was not enough to prevent a stock market crash of frightening severity. In late 1987, the market value of US common stock plunged by as much as -27% from its then record high largely because of a lift-off by the 10-year Treasury yield from a January 1987 average of 7.08% to the 10.36% of October 17, 1987.
In fact, it was at the morning of October 19, 1987’s infamous -18% daily plummet by the market value of US common stock that the benchmark Treasury yield was last above 10%. Who would have thought back then that 30 years later markets would fret over the possibility of a 3% benchmark Treasury yield?
Regarding 1994’s far less dramatic episode, a climb by the 10-year Treasury yield’s month-long average from October 1993’s 5.3% to April 1994’s 7.0% helped to sink the market value of common stock by -5.3% from its then record high despite an accompanying 19% annual advance by profits.
Do not underestimate the power of sharply higher benchmark interest rates to pummel share prices. The equity market sell-offs of both 1994 and 1987 occurred despite significant narrowings by medium- and low-grade bond yield spreads. Nor did the declining trends of high-yield defaults offset the selling pressure arising from fast rising Treasury yields.
As inferred from what occurred in 1987 and 1994, the 10-year Treasury yield may need to approach 3% for there to be at least a 50% likelihood of a 5% drop by equities amid profits growth. However, the record also makes clear that an especially disruptive ascent by benchmark yields is likely to be reversed. In order to stabilize share prices, the 10-year Treasury yield’s month-long average fell to 8.21% by February 1988 and to 5.65% by January 1996.
VIX Index stays low despite risks surrounding overvalued equities
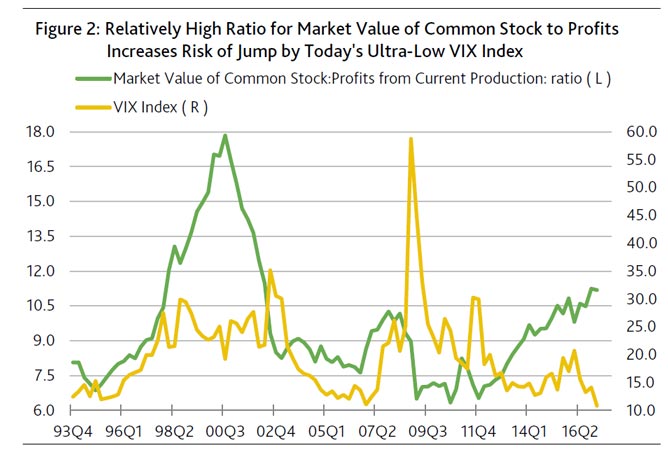
Overvaluation warns of a painful correction in the event market sentiment worsens considerably. In recognition of ample downside risk, the VIX index has tended to be greater in richly priced equity markets, where above-trend VIX indexes have typically been joined by above-average corporate bond yield spreads. (Figure 2.)
In the current market, however, the VIX index has broken from the norm and remained unexpectedly low amid elevated ratios of equity’s market value to core profits. The market value of US common stock recently approximated 11.2-times the yearlong estimate for pretax profits from current production for the highest such ratio since the 11.5:1 of 2002’s second quarter. It was in 1998’s first quarter that common equity’s market value last climbed up to 11.2-times core profits. At that time, the VIX index averaged 21.3, which was far above its recent 10.8. Similarly, when the ratio of common equity’s market value to profits rose to Q4-2007’s previous cycle high of 10.3:1, the VIX index averaged a well above-trend 22.1. Thus, the longer elevated price-to-earnings ratios persist, the more likely is a climb by the VIX index that ordinarily is accompanied by wider corporate yield spreads.
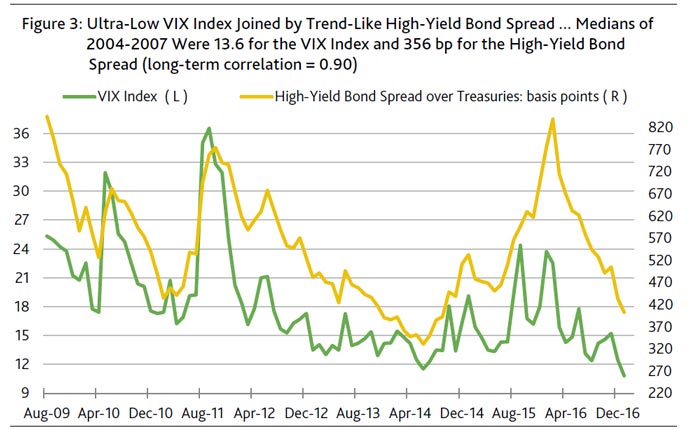
On January 24, 2007 the VIX index closed at a record low 9.89. Ten years later the VIX index closed at the 10.83 of January 25, 2017. The latter was its lowest finish since the 10.32 of July 3, 2014, or when the high-yield bond spread was an exceptionally thin 322 bp. However, even that gap was wider than the 276 bp of January 24, 2007. Do not be surprised if an ultra-low VIX continues to lead the high-yield bond spread lower.
According to the historical statistical relationship, by itself, the recent VIX index of 10.9 predicts a 326 bp midpoint for the high-yield bond spread, which is much thinner than the recent 394 bp. As shown in Figure 3, exceptionally low readings for the VIX index have tended to prompt narrowings by the high-yield spread throughout the current business cycle upturn. (Figure 3.)


