So the banking analysts are lining up to talk about the risks in the housing market, and the potential impact on bank earnings. But the latest line being peddled is that the major risks are located among low income – small mortgage – urban fringe – households.
But this is just not true. Our household surveys, probably the most accurate and current view of households financial footprints, tell a different story. We have already explored this from a segmented perspective, and highlighted that affluent households are also exposed – they have the big incomes and life-styles, but also the mortgages to match.
Here is a different view, mapping income bands to loan to income (LTI) bands. LTI is relevant because traditionally a ratio of much above 3 times begins to look more risky, especially in a low income growth environment.
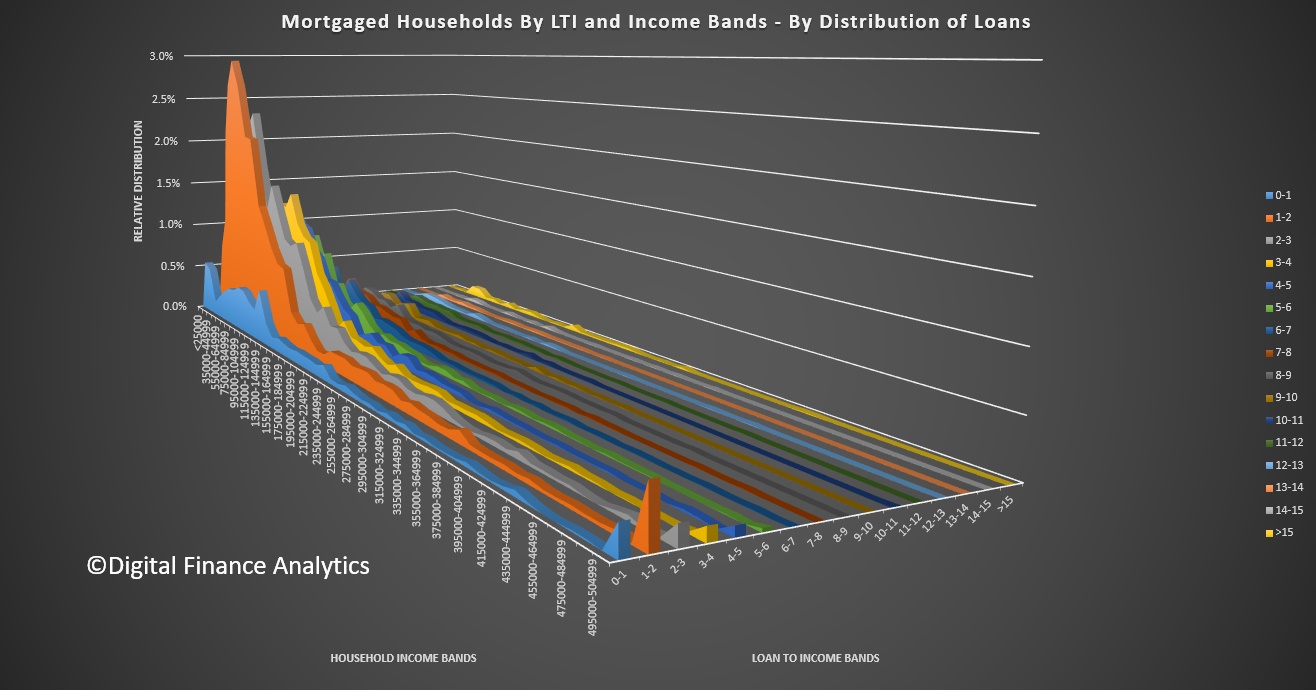
First we look at the relative distribution by count of loans. This visualisation shows that around 55% of loans are sitting in the 3 times or below LTI range, and 68% of the loans are sitting in the household income bands below 100k. But this is deceptive.
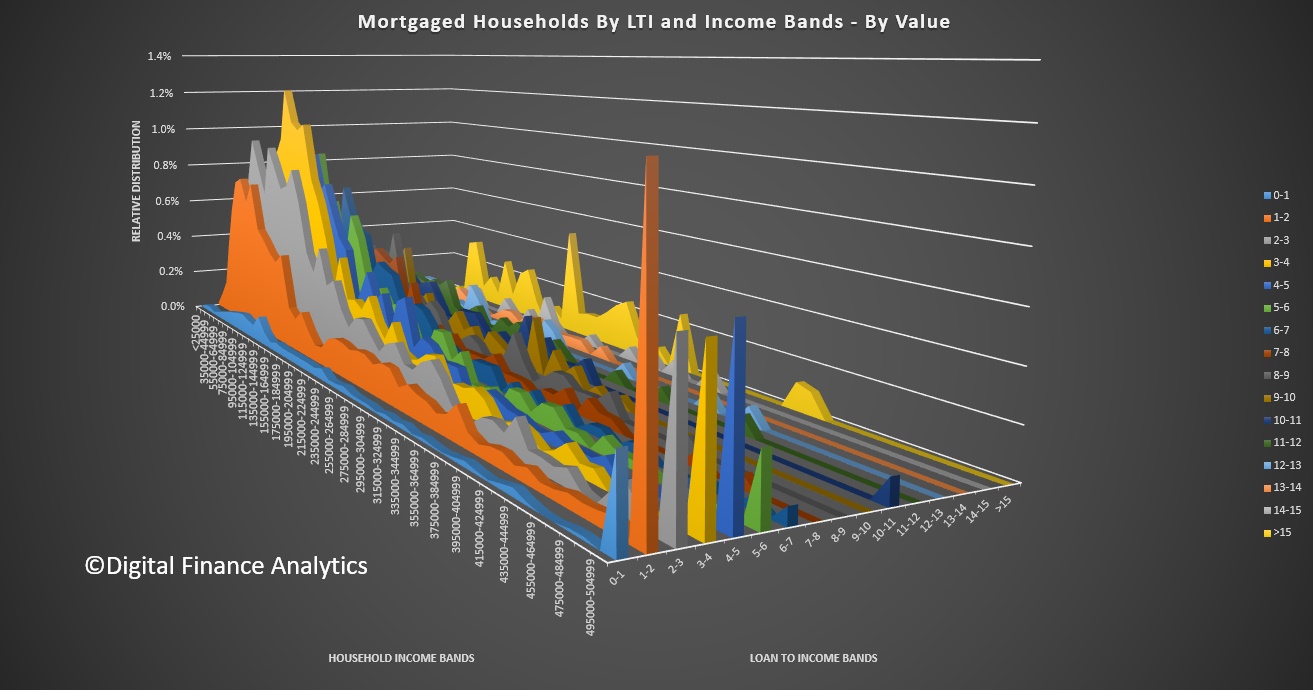
 An alternative and more concerning view is based on the value of loans outstanding. This next visualisation shows that by value the loans spread up the income bands, but also spread across the loan to income bands. In fact only 28% of loans by value sit at LTI’s below 3 times and 34% sit with household incomes of $100k or below.
 So, once you take the relative size of loans into account, mortgage stress breaks the boundaries of “low income, small mortgage” households. The problem is much more deep seated, and more affluent households are some of the most leveraged, to the point where small rate rises will hurt, especially where they have both owner occupied and investment mortgages. They are also less likely to know how to respond, whereas the battlers are use to sailing close to the wind in terms of managing a household budget.

One thought on “It’s Not Just Low Income Households In Mortgage Stress”