The latest data from the Australian Financial Security Authority gives us data for the September 2017 quarter on personal insolvencies across the country. They changed the format of their reports so trending data is not easy. But WA and QLD are where the relative higher proportion of defaults are to be found, especially business related failures.
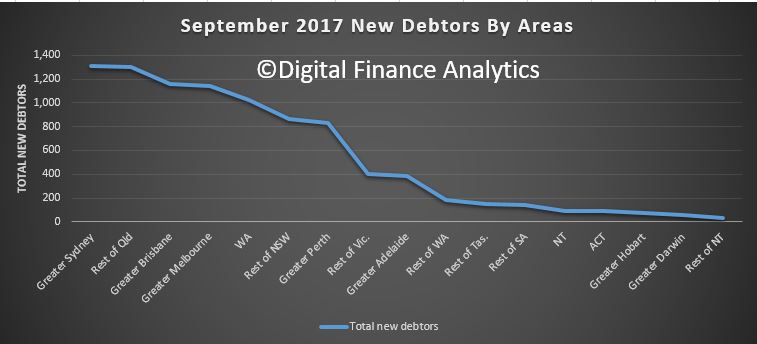
Lets look at the absolute count of new debtors by areas. The blue line shows the number of new debtors. The most new ones were in Greater Sydney, Regional Queensland, Greater Brisbane and Greater Melbourne. These are areas of relative high populations, so on one level no surprise.
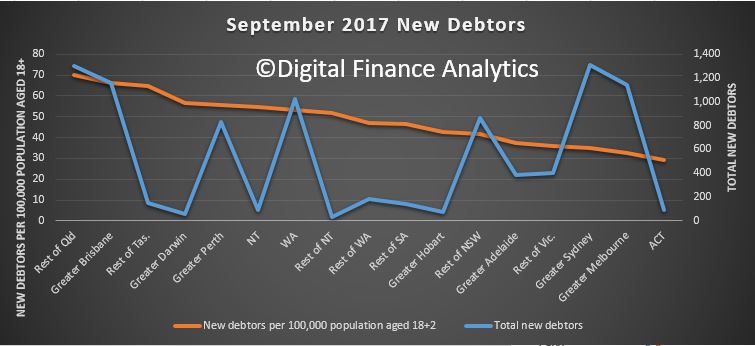
 But, a better way to compare the relative impact is to use a relative measure – the number of new debtors per 100,000 population, using the ABS data.
 On this basis, the Regional Queensland, Greater Brisbane and Rest of Tasmania have the highest concentration. Queensland is clearly a problem area. Greater Sydney and Melbourne are at the lowest end of the spread.
Finally, we sort the data by proportion of business failures. That shows Greater Perth and Regional WA, then Regional Queensland have the higher business related failure rates.
 The largest numbers of debtors entering a business-related personal insolvency in Greater Perth in the September quarter 2017 were in:
- Wanneroo (20 debtors)
- Rockingham (19 debtors)
- Joondalup (14 debtors).
The largest numbers of debtors entering a new business-related personal insolvency in rest of Western Australia in September quarter 2017 were in:
- Goldfields (8 debtors)
- Bunbury (7 debtors)
- Wheat Belt – North (5 debtors).
The largest numbers of debtors entering a new business-related personal insolvency in rest of Queensland in the September quarter 2017 were in:
- Ormeau – Oxenford (23 debtors)
- Townsville (17 debtors)
- Mackay (16 debtors).
We find these data series to be helpful in assessing the risks of default within our Core Market Models.
