The APRA ADI data for November 2017 was released today. As normal we focus in on the mortgage datasets. Overall momentum in mortgage lending is slowing, with investment loans leading the way down.
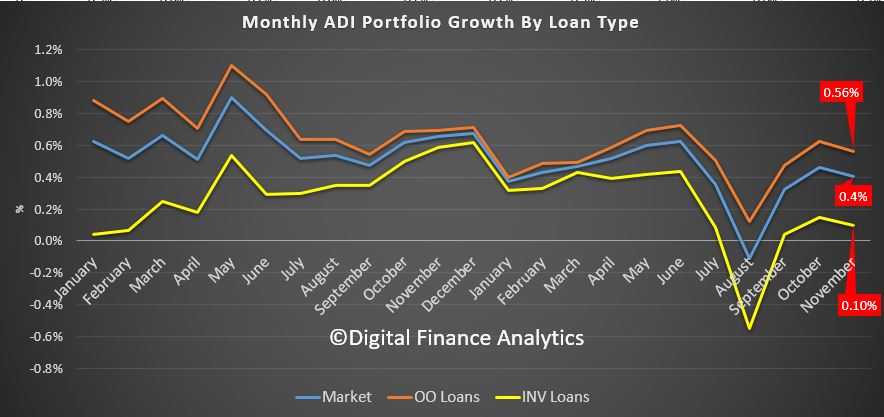
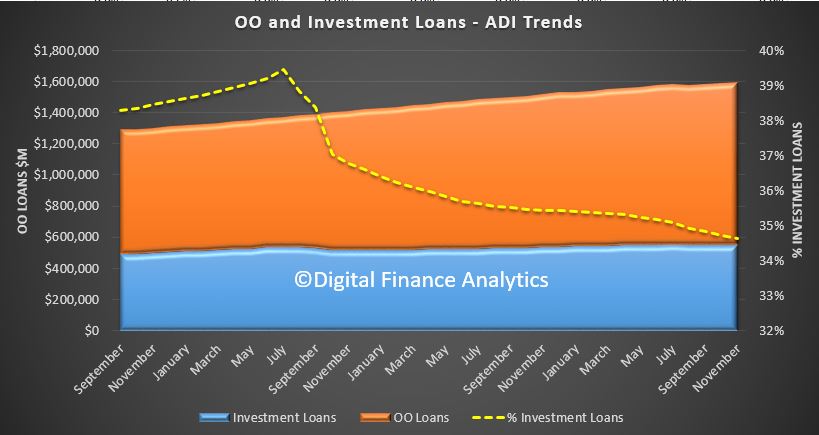
Total Owner Occupied Balances are $1.041 trillion, up 0.56% in the month (so still well above income growth), while Investment Loans reach $551 billion, up 0.1%. So overall portfolio growth is now at 0.4%, and continues to slow (the dip in the chart below in August was an CBA one-off adjustment). Total lending is $1.59 Trillion, another record.
 Investment lending fell as a proportion of all loans to 36.6% (still too high, considering the Bank of England worries at 16% of loans for investment purposes!)
 The portfolio movements of major lenders shows significant variation, with ANZ growing share the most, whilst CBA shrunk their portfolio a little. Westpac and NAB grew their investment loans more than the others.
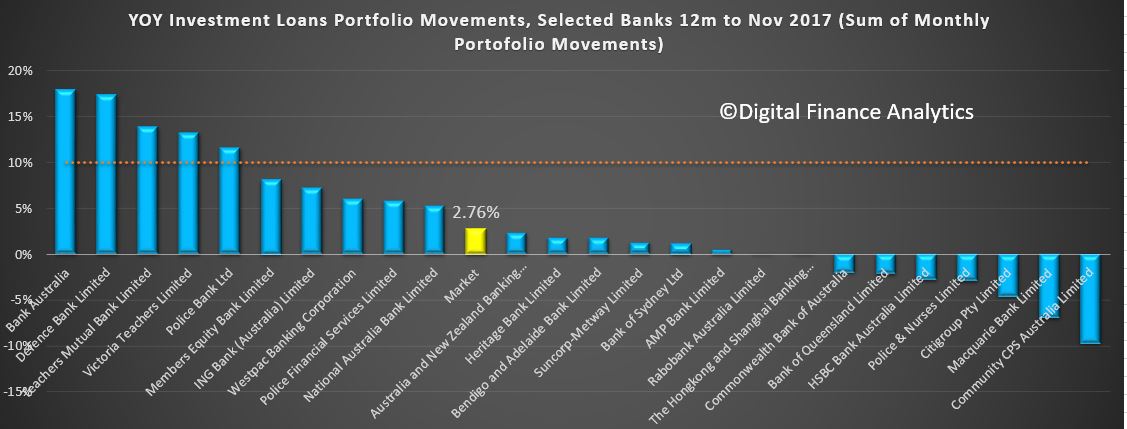
 On a 12 month rolling basis, the market growth for investor loans was 2.8%, with a wide spread of banks across the field. Some small players remain above the 10% APRA speed limit. This reflects a trend away from the majors.
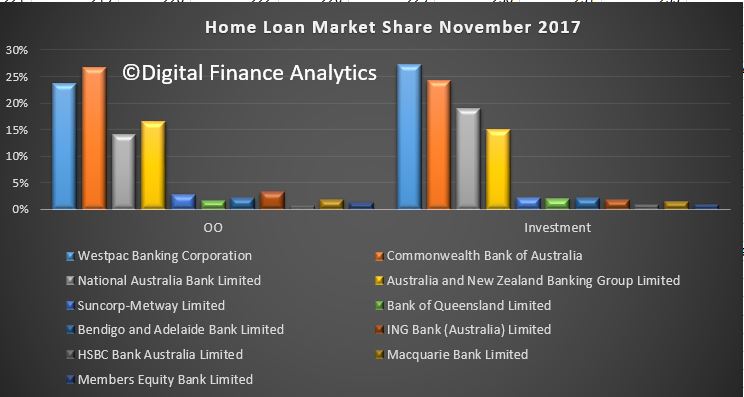
 Finally, here is the portfolio view, with CBA leading the OO portfolio, and WBC the INV portfolio.

