We continue our update on our rental yield modelling, using data from our household surveys. Last time we looked across the average gross and net yields (in cash-flow terms) by state, and also at average capital gains. Today we drill into the location specific analysis and also look at our master household segmentation.
 But before we look at the data specifically, it is worth reflecting on why we show the data the way we do. New rules from Basel will require banks to hold more capital against loans which are required to be serviced from income other than rent. As a result, the question of net yield – meaning rental income, less loan repayments and other costs before tax suddenly become more important. Whilst the Basel rules are yet to be finalised (there are internal squabbles between members as to where to set the limits), this data is significant – and needs to be separated from any equity held in the property – as equity is no guide to loan serviceability, only an indicator of potential risk should a sale be forced.
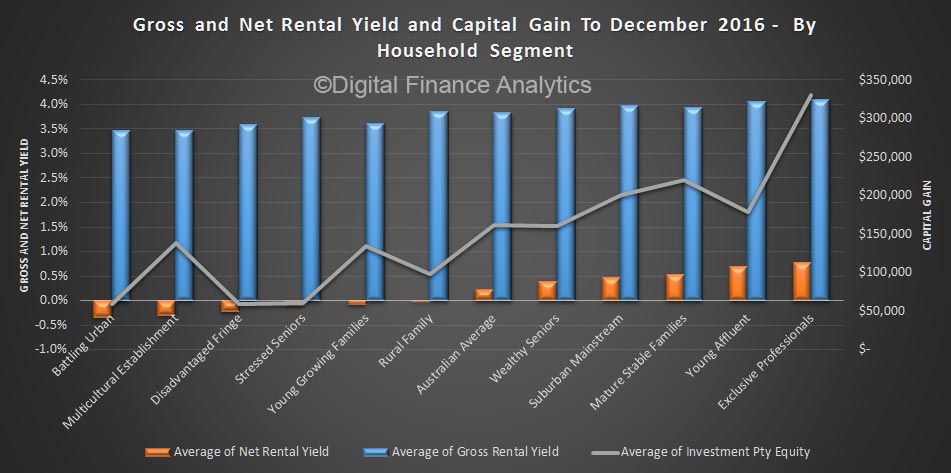
So now we turn to our household master segments. We find a startling truth. Most affluent households seem to be able to hold investment property where net yields are still positive, whereas less affluent households – those on the urban fringe, battlers, stressed older households and multicultural segments, as well as young growing families; on average have net yields in negative territory. Whilst there are a smaller number of these households, compared with the number of more affluent households who hold investment property, it is telling. In addition – and no surprise – more affluent households on average have more equity in the property (and more properties per household).
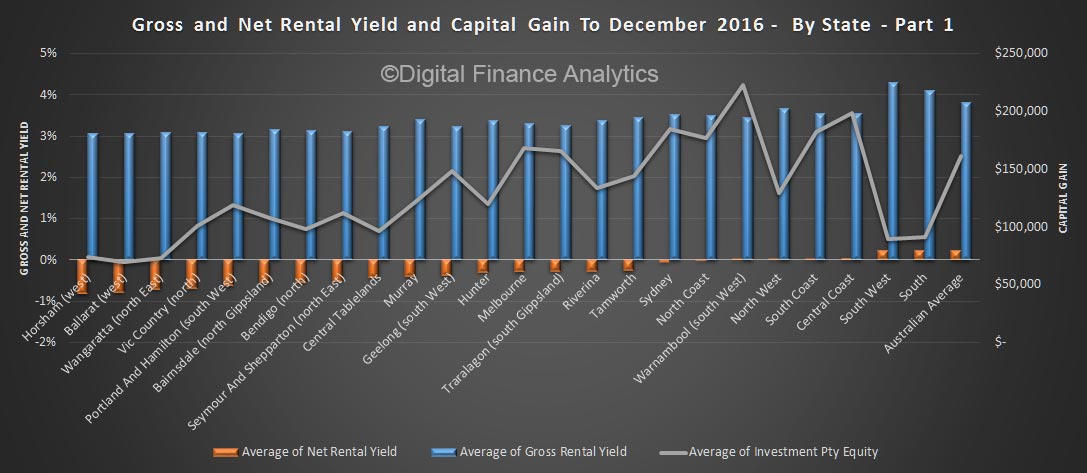
 Another way to look at the investment portfolio is by regions and locations. We use a list of 50 or so, which cover the country. There are variations across these. On average households in Horsham, Ballarat and Wangaratta have little equity in their investment properties, and are well underwater in terms of net rental yields.
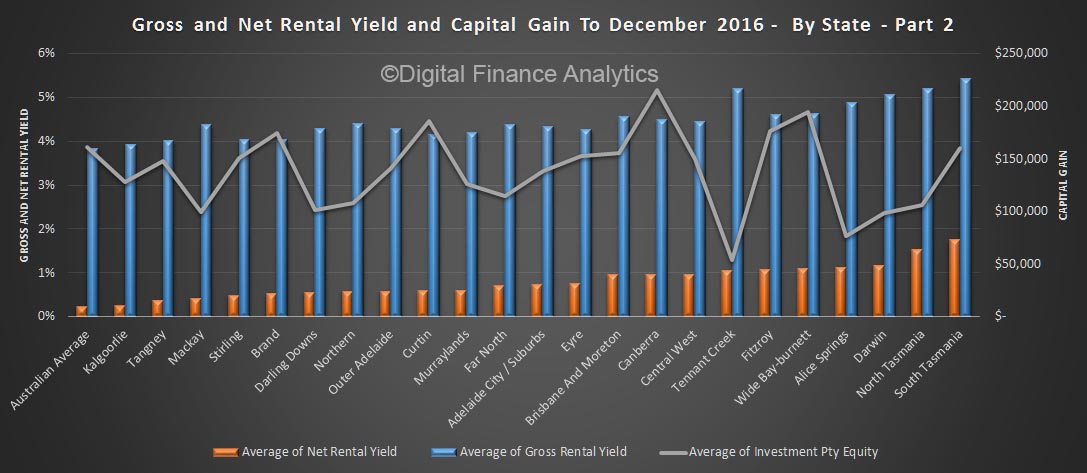
 At the other end of the spectrum, investment properties in Darwin, Tasmania and areas of Queensland are in much more positive territory.
 Investors in Warnambool, Canberra and in the Central Coast have the highest average paper capital profits (current property value less outstanding mortgage). But of course many investment households have large mortgages so they can offset interest against other income thanks to negative gearing.
The pressure of rising investment loan interest rates, low rental income growth, and in some cases, vacant property are all having an impact. But the fallout is not equally spread across the country, or across households.
